Children's sleep in the family environment : a pilot study using actigraphy with 6 8 year old New Zealand children : a thesis presented in partial fulfilment of the requirements for the degree of Master of Public Health at Massey University, Wellington, N
239
0
0
Full text
(2) Children’s Sleep in the Family Environment: A Pilot Study Using Actigraphy with 6 – 8-Year-Old New Zealand Children. A thesis presented in partial fulfilment of the requirements for the degree of. Master of Public Health at Massey University, Wellington, New Zealand.. Diane P. Muller 2010.
(3) Abstract Historically, children were considered to rarely experience sleep problems and daytime sleepiness in middle childhood (5 – 12-years of age), however more recent findings indicate this may have changed. Psychosocial and environmental factors, such as technology use and bedtime routines, have been associated with reduced sleep quantity and/or quality. Links have also emerged between shorter sleep duration in children, and an increased risk of obesity in childhood and adulthood. Although a number of studies have investigated children’s sleep internationally, data are limited on both average sleep duration and the stability of sleep patterns of New Zealand children. This study aimed to collect normative data on the sleep of 6 – 8-year-olds, living in New Zealand, across both school and non-school nights, identify modifiable factors that impact on children’s sleep within the family environment, explore the relationship between children’s sleep and BMI, and pilot methods for potential future research. Actigraphy and diaries were used for seven consecutive days and nights, as well as a questionnaire incorporating the Children’s Sleep Habits Questionnaire (CSHQ), with 52 families living in the Wellington region. Stable objectively measured sleep patterns were identified, consistent with findings of Nixon et al. (2008). School night sleep duration was found to be, on average, longer than non-school night sleep, and parents tended to over-estimate their children’s sleep duration.. Mean school night sleep. duration was 9.9 hours (SD = 0.5) and non-school night sleep duration was 9.5 hours (SD = 0.7). No differences were identified between boys’ and girls’ sleep, and the 14% of children categorised as being overweight did not exhibit significantly different sleep patterns from the rest of the sample. Modifiable factors of technology and caffeine use were associated with differences in children’s sleep, as were non-modifiable familial factors of shiftworking adults living in the home, childcare duration and finishing times, and younger children in the household. Recommendations for future research include increasing the size and diversity of the sample, extending actigraphic recording to at least 10 consecutive days and nights to incorporate two weekends, using PSG with a sub-sample of children, and implementing a longitudinal study.. ii.
(4) Acknowledgements I would like to thank all of the children and parents who put in so much time and effort to participate in the study, without whom this would not have got off the ground. I would also like to acknowledge the numerous (busy) school principals who willingly allowed flyers to be distributed. I feel very privileged to have been supervised by Professor Philippa Gander and Dr Leigh Signal. Their wealth of knowledge, support, and patience has enabled this process to be a positive learning journey, and is much appreciated. Thank you also to Dr Dawn Elder for her paediatric expertise. Her availability of clinical follow-up for families was invaluable. The entire team at the Sleep/Wake Research Centre has provided a supportive learning environment, for which I am grateful. In particular, I would like to thank Rosie Gibson for leading the way with her infant sleep study (and sharing so much knowledge on the process); Jo Fink for proofreading, formatting, and (many hours of) listening; Bronwyn Sweeney for formatting and providing many pearls of wisdom; Ally Clark for double entering all my data; and Margo van den Berg for her valuable statistical expertise. Thank you to Brigit Laidler and Caro Robinson for providing excellent proofreading and feedback. I would also like to acknowledge the generous support of numerous friends who provided food, coffee, and childcare when it was most needed. Also a big thank you to Pat Muller, Marie Brown, and Alistair Brown who came to the rescue with their grandparenting expertise. This project was able to be carried out due to funding by the Massey University Research Fund. I would also like to acknowledge the financial assistance I received from the Massey Masterate Scholarship. Last, but certainly not least, I would like to thank my wonderful family. Thank you to Emily and Alex who put up with many hours of mother-absenteeism and helped to count down the sleeps to the end of “my project”. And, of course, thank you to Colin who supported and encouraged me throughout the ups and downs of this journey, and believed I could do it without faltering.. iii.
(5) Table of Contents Abstract ............................................................................................................................. ii Acknowledgements .......................................................................................................... iii List of Tables.................................................................................................................. viii List of Figures .................................................................................................................. xi 1.. Introduction ................................................................................................................ 1 1.1 Overview ............................................................................................................. 1 1.2 Normal Human Sleep .......................................................................................... 2 1.2.1 Sleep Architecture ................................................................................... 2 1.2.2 Sleep Onset and Offset ............................................................................ 5 1.2.3 Sleep/Wake Regulation ........................................................................... 6 1.2.4 Function of Sleep .................................................................................... 8 1.3 Sleep Across the Lifespan ................................................................................. 12 1.4 Measuring Children’s Sleep .............................................................................. 16 1.4.1 Objective Measures ............................................................................... 16 1.4.2 Subjective Measures ............................................................................. 20 1.5 Normal Sleep in Middle Childhood .................................................................. 22 1.5.1 Psychosocial and Demographic Factors ............................................... 24 1.6 Sleep Problems in Childhood............................................................................ 32 1.6.1 Impact of Sleep Problems in Middle Childhood................................... 33 1.7 Sleep and Obesity ............................................................................................. 36 1.8 Thesis Aims ...................................................................................................... 39. 2.. Method ..................................................................................................................... 42 2.1 Measures .......................................................................................................... 42 2.1.1 Actigraphy............................................................................................. 42 2.1.2. Child’s Sleep/Wake Diary .................................................................. 45 iv.
(6) 2.1.3 Child/Family Questionnaire ................................................................ 47 2.1.4. Parental Feedback ............................................................................... 51. 2.2 Ethics ................................................................................................................ 52 2.3 Participant Criteria ............................................................................................ 52 2.4 Recruitment ....................................................................................................... 53 2.5 Procedure .......................................................................................................... 54 2.6 Scoring of the CSHQ ........................................................................................ 56 2.7 Scoring of Actigraphy ....................................................................................... 57 2.7.1. Manual Actigraphy Screening ............................................................ 57. 2.7.2. Computer-Based Actigraphy Scoring ................................................. 58. 2.7.3. Inter-Rater Reliability ......................................................................... 59. 2.7.4. Actigraphy Variables .......................................................................... 60. 2.8 Data Management ............................................................................................. 60 2.8.1 Confidentiality ...................................................................................... 60 2.8.2. Data Entry ........................................................................................... 60. 2.9 Data Analysis .................................................................................................... 62 2.9.1. Hypothesis 1: School versus Non-School Sleep ................................ 62. 2.9.2. Hypothesis 2: Girls’ versus Boys’ Sleep............................................ 63. 2.9.3. Hypothesis 3: Parental Report versus Objectively Measured Sleep .. 63. 2.9.4. Hypothesis 4: Relationship between Body Size and Sleep ................ 63. 2.9.5. Hypothesis 5: Normal versus Problem Sleepers ................................ 63. 2.9.6. Hypotheses 6 and 7: Psychosocial, Behavioural and Environmental Factors in Relation to Sleep ................................................................ 64. 3.. 2.9.7. Hypothesis 8: Younger Siblings and Sleep ........................................ 64. 2.9.8. Hypothesis 9: Waking Activity and Sleep ......................................... 65. 2.9.9. Parental Feedback ............................................................................... 65. Results ...................................................................................................................... 66. v.
(7) 3.1 Description of the Sample ................................................................................. 66 3.1.1. Sample Characteristics: Child/Family Questionnaire ........................ 66. 3.1.2. Parental Reports of Sleep Behaviour: CSHQ .................................... 76. 3.1.3. Daily Activity: Diary Data ................................................................. 78. 3.1.4. Objective Sleep and Waking Activity: Actigraphy............................ 82. 3.2 Comparison of School and Non-School Sleep and Waking Activity ............... 92 3.3 Gender Differences in Sleep Duration and Timing .......................................... 94 3.4 Comparison of Subjective and Objective Sleep................................................ 94 3.5 Relationship between Body Size and Sleep ...................................................... 96 3.6 Subjectively and Objectively Defined Problem Sleepers ................................. 96 3.7 Family Demographic, Environmental and Lifestyle Factors .......................... 102 3.7.1. Caffeine Consumption ...................................................................... 102. 3.7.2. Shiftworking Adults .......................................................................... 102. 3.7.3. Bedroom Sharing .............................................................................. 104. 3.7.4. Technology........................................................................................ 104. 3.7.5. Childcare ........................................................................................... 106. 3.7.6. Younger Siblings............................................................................... 108. 3.8 Relationship between Daily Activity and Sleep ............................................. 108 3.9 Parental Feedback on Study Participation ...................................................... 110 4.. Discussion .............................................................................................................. 113 4.1 Overview ......................................................................................................... 113 4.2 Sample Characteristics .................................................................................... 114 4.3 Objectively Measured Normal Sleep .............................................................. 115 4.4 Subjectively Measured Normal Sleep ............................................................. 116 4.5 Significant Findings ........................................................................................ 118 4.5.1. Hypothesis 1: School and Non-School Night Sleep ........................ 118. 4.5.2. Hypothesis 2: Gender Differences in Sleep ..................................... 119 vi.
(8) 4.5.3. Hypotheses 3: Subjective versus Objective Sleep ........................... 120. 4.5.4. Hypothesis 4: Body Size and Sleep ................................................. 120. 4.5.5. Hypothesis 5: Normal and Problem Sleepers .................................. 121. 4.5.6. Hypotheses 6 and 7: Psychosocial, Behavioural and Environmental Factors ............................................................................................... 123. 4.5.7. Hypothesis 8: Younger Siblings and Sleep ...................................... 127. 4.5.8. Hypothesis 9: Daily Activity and Sleep ........................................... 127. 4.6 Pilot Study Design: Strengths and Limitations .............................................. 129 4.6.1. Recruitment ....................................................................................... 129. 4.6.2. Measures ........................................................................................... 129. 4.6.3. Procedures ......................................................................................... 132. 4.7 Recommendations for Future Research .......................................................... 133 4.8 Summary and Conclusion ............................................................................... 134 References ..................................................................................................................... 136 Appendix A ................................................................................................................... 153 Appendix B ................................................................................................................... 163 Appendix C ................................................................................................................... 177 Appendix D ................................................................................................................... 182 Appendix E ................................................................................................................... 192 Appendix F .................................................................................................................... 198 Appendix G ................................................................................................................... 206. vii.
(9) List of Tables Table 2.1. Actigraphy Variables Selected for Analyses ............................................. 61. Table 3.1. Child’s Sleep/Wake Diary and Actigraphy Database Sample Sizes ........ 66. Table 3.2. Family and Home Environment Descriptive Statistic ............................... 70. Table 3.3. Descriptive Statistics for CSHQ Scores..................................................... 77. Table 3.4. Distribution of Transport To and From School ......................................... 78. Table 3.5. Distribution of Parentally Reported Screen Use ........................................ 79. Table 3.6. Distribution of Parentally Reported Organised Activities ......................... 80. Table 3.7. Descriptive Statistics for Averaged Parental Report of Activity ............... 82. Table 3.8. Parentally Reported Events that Impacted on Sleep and Wake Times ...... 83. Table 3.9. Descriptive Statistics for Averaged School Night Rest and Sleep ............ 83. Table 3.10 Descriptive Statistics for Averaged Non-School Rest and Sleep .............. 84 Table 3.11 Descriptive Statistics for Averaged School and Non-School Activity ...... 90 Table 3.12 Comparison of School and Non-School Sleep/Wake Activity (Dependent t-test) .......................................................................................................... 93 Table 3.13 Comparison of School and Non-School Sleep/Wake Activity (Wilcoxon Signed-rank test ......................................................................................... 93 Table 3.14 Comparison of Parental Report and Actigraphic Sleep Duration on School Nights ......................................................................................................... 95 Table 3.15 Comparison of Parental Report and Actigraphic Sleep Duration on NonSchool Nights ............................................................................................. 95 Table 3.16 Comparison of Problem and Non-Problem Sleepers Defined by Total CSHQ Score > 41 ...................................................................................... 98 Table 3.17 Comparison of Problem and Non-Problem Sleepers Defined by Parental Report of a Small or Serious Problem ....................................................... 99 Table 3.18 Comparison of Problem and Non-Problem Sleepers Defined by Actigraphic Sleep Duration < 9 Hours .................................................... 100 Table 3.19 Comparison of Problem and Non-Problem Sleepers Defined by Actigraphic Sleep Duration < 10 Hours .................................................. 101 Table 3.20 Comparison of Children who Did or Did Not Drink Caffeinated Beverages ............................................................. .................................................... 103. viii.
(10) Table 3.21 Comparison of Children With and Without Screens in their Bedrooms . 105 Table 3.22 Association between Daily Screen Time and Sleep ................................ 106 Table 3.23 Association between Childcare and Sleep on School Nights .................. 107 Table 3.24 Associations between Screen Use and Childcare Duration and Children’s Sleep Onset Latency on School Nights.................................................... 108 Table 3.25 Comparison of Children Living with at Least One Younger Child and those with No Younger Children at Home .............................................. 109 Table 3.26 Association between Objective Daily Activity and Sleep ....................... 110 Table 3.27 Parental Report of Difficulty Level of Using Data Collection Tools ...... 111 Table A1. Polysomnographic Values from Paediatric Normative Literature ........... 154. Table A2. Actigraphic Values from Paediatric Normative Literature ...................... 156. Table A3. Subjective Values from Paediatric Normative Literature ........................ 159. Table G1. Shapiro-Wilk Test of Normality Results for Questionnaire Data ............ 207. Table G3. Descriptive Statistics for BMI ................................................................. 209. Table G4. Distribution of CSHQ Responses ............................................................ 210. Table G5. Shapiro-Wilk Test of Normality Results for CSHQ Data ....................... 215. Table G6. Shapiro-Wilk Test of Normality Results for Child’s Sleep/Wake Diary Data .......................................................................................................... 216. Table G7. Shapiro-Wilk Test of Normality Results for Averaged Actigraphy Rest and Sleep Data ................................................................................................ 217. Table G8. Shapiro-Wilk Test of Normality Results for Averaged Actigraphy Waking Activity Data ............................................................................................ 218. Table G9. Comparison of Girls’ and Boys’ School and Non-School Night Sleep Duration and Timing ................................................................................ 219. Table G10 Comparison. of. ‘Thin/Normal’. and. ‘Overweight’. Groups’. Sleep. (Independent t-test) .................................................................................. 220 Table G11 Comparison of ‘Thin/Normal’ and ‘Overweight’ Groups Sleep (MannWhitney U test) ........................................................................................ 221 Table G12 Comparison of Children who Did or Did Not Live with a Shiftworking Adult ........................................................................................................ 222 Table G13 Comparison of Children who Did or Did Not Share a Bedroom ............. 223 Table G14 Comparison of Children With and Without Technology in their Bedroom .. ............................................................................................................... 224. ix.
(11) Table G15 Comparison of Children With and Without Childcare During the Week … .. ............................................................................................................... 225 Table G16 Comparison of Children who Did and Did Not Engage in an Organised Activity .................................................................................................... 226 Table G17 Comparison of Children using Active or Passive Transport To and From School ...................................................................................................... 227. x.
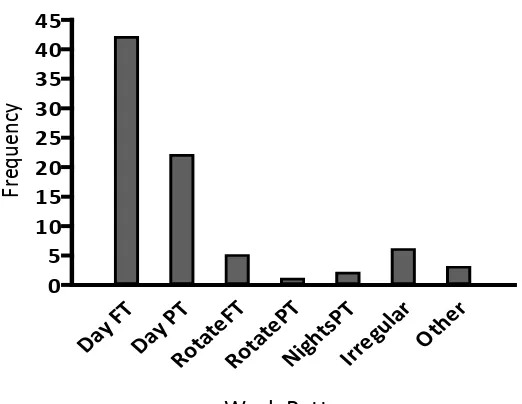
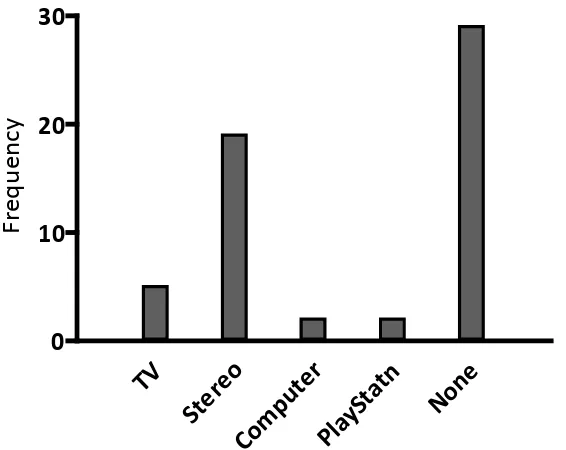
(12) List of Figures Figure 1.1. An example of NREM sleep recorded by PSG............................................ 3 Figure 1.2. An example of REM sleep recorded by PSG .............................................. 4 Figure 1.3. Hypnogram showing the sleep architecture of an 8-year-old child ............. 5 Figure 1.4. The two-process model of sleep regulation ................................................. 8 Figure 1.5. Night sleep hypnograms from a child, young adult and older adult .......... 13 Figure 1.6. Trends across age for stage 1 and 2 sleep, SWS, REM sleep, wake after sleep onset (WASO) and sleep latency (in minutes) ................................. 14 Figure 1.7. The international 10-20 system for electrode placement in PSG .............. 17 Figure 1.8. Relationship between sleep disturbance, daily functioning and injury ..... 34 Figure 1.9. Global prevalence of childhood obesity .................................................... 36 Figure 1.10. Possible mechanisms of short sleep duration and obesity ......................... 39 Figure 2.1. The Actiwatch-2™..................................................................................... 44 Figure 2.2. Example of a scored actogram, running from mid-day to mid-day ........... 58 Figure 2.3. Activity count calculation using one minute sampling epochs.................. 59 Figure 3.1. Frequency distribution of children’s age ................................................... 67 Figure 3.2. Frequency distribution of school decile ratings ......................................... 68 Figure 3.3. Ethnic identification of children in the sample .......................................... 69 Figure 3.4. Frequency distribution of family work patterns ........................................ 71 Figure 3.5. Frequency distribution of technology in bedrooms ................................... 72 Figure 3.6. Frequency distribution of children’s BMI ................................................. 73 Figure 3.7. Frequency distributions of boys’ BMI by age ........................................... 74 Figure 3.8. Frequency distributions of girls’ BMI by age ............................................ 75 Figure 3.9. Frequency distribution of CSHQ Total Score............................................ 76 Figure 3.1.0 Frequency distribution of average screen time use on school and nonschool days ................................................................................................. 81 Figure 3.11. Frequency distribution of average rest start times on school and non-school nights .......................................................................................................... 85 Figure 3.12. Frequency distribution of average sleep start times on school and nonschool nights .............................................................................................. 85 Figure 3.13. Frequency distribution of average sleep duration on school and non-school nights .......................................................................................................... 86. xi.
(13) Figure 3.14. Frequency distribution of average total sleep time on school and nonschool nights .............................................................................................. 86 Figure 3.15. Frequency distribution of average sleep efficiency on school and nonschool nights .............................................................................................. 87 Figure 3.16. Frequency distribution of average sleep onset latency on school and nonschool nights .............................................................................................. 88 Figure 3.17. Frequency distribution of average snooze time on school and non-school nights .......................................................................................................... 88 Figure 3.18. Average percentage of children asleep across 24 hours on school nights . 89 Figure 3.19. Average percentage of children asleep across 24 hours on non-school nights .......................................................................................................... 89 Figure 3.20. Frequency distribution of average activity duration on school and nonschool days ................................................................................................. 91 Figure 3.21. Frequency distribution of total activity counts on school and non-school days ............................................................................................................ 91 Figure 3.22. Frequency distribution of average activity counts per minute on school and non-school days ......................................................................................... 92 Figure G2. Ethnicity of mothers and fathers who completed the ethnicity question in the Child/Family Questionnaire ............................................................... 208. xii.
(14) INTRODUCTION. 1. Introduction 1.1 Overview Middle childhood (5 – 12-years of age) is a time when children’s routines become predominantly based around school. Social and recreational activities often increase and children begin to gain independence from their parents in various aspects of daily activity. Sleep during this stage of life is important for both mental and physical development and well-being (Mindell & Owens, 2003). When all is well, middle childhood is deemed to be a time of good quality sleep and for daytime sleepiness to be rare prior to significant pubertal changes of adolescence. It is estimated, however, that approximately one quarter of children in this age group will experience a problem with their sleep at some time (Owens, 2005). A number of psychosocial and environmental factors such as school schedules, technology use and family routines can impact children’s sleep (Gruber, Sadeh, & Raviv, 2000) resulting in potential decreased sleep duration and/or reduced sleep quality. Importantly, links have emerged between shorter sleep duration in childhood and an increased risk of obesity in childhood and adulthood (Marshall, Glozier, & Grunstein, 2008a). When sleep problems occur, the impact can be far-reaching. Children’s mood, behaviour and learning can suffer (Alfano, Zakem, Costa, Taylor, & Weems, 2009; Buckhalt, El-Sheikh, Keller, & Kelly, 2009; Gregory & O'Connor, 2002), and the risk of accidents (Li, Jin, Owens, & Hu, 2008) and obesity increase (Landhuis, Poulton, Welch, & Hancox, 2008). Parents may in turn experience mood and sleep difficulties, resulting in potential family discord (Bell & Belsky, 2008). Issues with learning and behaviour at school may also add strain on community resources. Sleep in middle childhood is therefore an important area of public health. Although a number of international studies have investigated children’s sleep, limited objective data exist on the sleep of New Zealand children. In order to better understand how long and how well our children are sleeping, this study has focused on the objective measurement of sleep as well as psychosocial factors within the family. 1.
(15) INTRODUCTION. context that may have an impact. Methods have been piloted to identify study design requirements for future research. Chapter One provides a broad overview of sleep.. Basic sleep physiology,. including sleep architecture and regulation, is outlined along with sleep changes across the lifespan. Options for measuring children’s sleep are reviewed, as is current New Zealand and international literature on the sleep quantity and quality of school-aged children. A summary is provided of psychosocial and demographic factors that affect children’s sleep, the prevalence and impact of common sleep problems and the relationship between children’s sleep duration and obesity. In response to identified research gaps, thesis aims are outlined.. 1.2 Normal Human Sleep What is sleep and why do we do it? This has fascinated people throughout history and led to a variety of beliefs about what occurs during sleep. Broadly speaking, these theories, including ancient Chinese, Egyptian and Mesopotamian beliefs dating back to 3000BC (Williams, 2005), can be dichotomised according to whether they classify sleep as a passive or active process (Dement, 2005; Williams, 2005). Sleep science as it is known today is relatively young, with beginnings associated with the discovery of the discrete state of rapid eye movement (REM) sleep in the early 1950s by Nathaniel Kleitman and Eugene Aserinsky (Dement, 2005; Hobson, 2002; Williams, 2005). Since then technological advances and the dedicated work of many researchers have led to the growing body of knowledge we have today about the active process of sleep. A number of gaps still remain, however, including what exactly sleep is for (Williams, 2005). In order to examine children’s sleep, it is beneficial to have an understanding of basic human sleep structure, or sleep architecture, and mechanisms that regulate sleep-wake cycles.. 1.2.1 Sleep Architecture Normal human sleep consists of two separate states – non-rapid eye movement (NREM) sleep and REM sleep. Across a normal period of sleep these alternate in a cyclical pattern (Carskadon & Dement, 2005; P. Gander, 2003).. 2.
(16) INTRODUCTION. NREM During NREM (pronounced non-REM) sleep, relatively low levels of brain activity occur but physiological systems in the body continue to be actively regulated and body movements remain intact. NREM sleep is typically divided into four stages – 1, 2, 3 and 4 (see Figure 1.1).. The stages are defined by distinct brain wave. (electroencephalogram or EEG) patterns, eye movements (electrooculogram or EOG), and muscle tone (electromyogram or EMG).. As outlined in section 1.4.1, these. physiological variables can be simultaneously recorded by a technique known as polysomnography or PSG (Carskadon & Dement, 2005; P. Gander, 2003; Guilleminault & Kreutzer, 2003; Mindell & Owens, 2003; Rama, Cho, & Kushida, 2006).. Figure 1.1. An example of NREM sleep recorded by PSG. The arrow indicates a Kcomplex and the underlining shows two sleep spindles. Adapted from Carskadon, M. A., & Dement, W. C. (2005). Normal Human Sleep: An Overview. In M. H. Kryger, T. Roth, & W. C. Dement (Eds.), Principles and Practice of Sleep Medicine (4th ed.) (p. 13). Philadelphia: Elsevier Saunders.. Stage 1 sleep, as well as stage 2, is often referred to as ‘light sleep’. In the normal sleep of young adults, initial stage 1 often lasts from 30 seconds to five minutes, and it is common to drift in and out of NREM stage 1 sleep a number of times before descending into stage 2. During the transition from wakefulness to stage 1 NREM sleep, EEG activity changes from low voltage mixed frequency and alpha waves (measured as 8 – 13Hz) to theta waves (3 – 7Hz). Slow rolling eye movements, recall of fragmented visual imagery (hypnogogic hallucinations) and short involuntary muscle contractions (hypnic jerks) often occur (Carskadon & Rechtschaffen, 2005; Gander, 2003; Mindell & Owens, 2003). 3.
(17) INTRODUCTION. Stage 2 is usually deemed to be the beginning of ‘true’ sleep. Occasional bursts of rapid rhythmic EEG activity (sleep spindles) and high amplitude slow wave spikes (K-complexes) identify the beginning of stage 2 NREM sleep (see Figure 1.1). As this stage progresses, larger, slower waves (delta waves, < 2Hz) of EEG activity begin to occur (Carskadon & Rechtschaffen, 2005; Gander, 2003; Mindell & Owens, 2003). Stage 3 and Stage 4 sleep is also referred to as slow-wave sleep (SWS) or ‘deep’ sleep. Stage 3 is entered when delta waves account for 20 - 50% of the sleep pattern, and stage 4 when they make up more than 50%. Breathing is most regular and slowest during SWS and this is the time when it is most difficult to awaken people (Gander, 2003; Mindell & Owens, 2003). Slow-wave activity reduces the longer people are asleep and increases in relation to the length and quality of prior wakefulness (Borbely & Achermann, 2005; Chokroverty, 2009; Horne, 1992). This is discussed further in section 1.2.3. REM REM sleep is different to NREM sleep or wakefulness, to the extent that there are three distinct states of existence (Gander, 2003). Although EEG during REM sleep looks similar to that of being awake, bursts of rapid eye movement occur and EMG activity is suppressed, as illustrated in Figure 1.2 (Carskadon & Rechtschaffen, 2005; Gander, 2003). REM sleep is sometimes referred to as ‘paradoxical sleep’, with the paradox being high levels of cortical brain activity (associated with dreaming) but virtual body paralysis (Carskadon & Rechtschaffen, 2005; Gander, 2003; Jouvet, 1999).. Figure 1.2. An example of REM sleep recorded by PSG. Eye movements appear as outof-phase deflections in the left and right EOG channels. Adapted from Carskadon, M. A., & Rechtschaffen, A. (2005). Normal Human Sleep: An Overview. In M. H. Kryger, T. Roth, & W. C. Dement (Eds.), Principles and Practice of Sleep Medicine (4th Ed.) (p. 1368). Philadelphia: Elsevier Saunders.. 4.
(18) INTRODUCTION. Sleep Cycles Ideally, although not always, NREM and REM sleep alternate in a cyclical pattern with each cycle lasting approximately 90 – 110 minutes in normal adults and 90 minutes in school-aged children. Approximately 4 – 6 cycles occur during a regular sleep period in healthy young adults. The first two cycles are dominated by SWS, compared to REM sleep which increases from the first to last cycle (Chokroverty, 2009). Children spend a greater amount of time in SWS than adults (see Section 1.3). Figure 1.3 illustrates a typical pattern for a healthy 8 year old sleeping at night.. Figure 1.3. Hypnogram showing the sleep architecture of an 8 year old child. Adapted from Capp, P. K., Pearl, P. L., & Lewin, D. (2005). Pediatric Sleep Disorders. Primary Care: Clinics in Office Practice, 32, 549 – 562.. 1.2.2 Sleep Onset and Offset There is no exact moment when sleep commences (sleep onset).. Instead,. gradual behavioural and physiological transitions occur including changes in EEG, and cognitive and mental processing. Sleepiness starts before stage 1 NREM is reached and is characterised by drooping, heavy eyelids and the potential clouding of senses. Slow eye movements (SEMs) occur at sleep onset and continue in stage 1 NREM sleep (Chokroverty, 2009). Sleep offset, or the moment of awakening, is also a gradual process. During this period sleep inertia occurs. This is sometimes described as ‘sleep drunkenness’ and is experienced as a graduated return to a state of wakefulness or alertness (Chokroverty, 2009).. 5.
(19) INTRODUCTION. 1.2.3 Sleep/Wake Regulation At least two processes play a part in the physiological regulation of sleep and wake timing – circadian rhythms and the sleep homeostat (Gander, 2003). A complex interaction between the two influences sleep initiation, consolidation and architecture (Beine, 2007). Circadian Rhythms These have been defined as “the self-sustained oscillations of living systems that display near-24-hour periodicity when the system is kept away from all external time cues” (Van Gelder, 2004, p. 166). Basically they are cycles, approximately 24 hours in length, of behaviour and physiology that are generated by endogenous biological clocks (Mistlberger & Rusak, 2005). In humans, a central clock located in the suprachiasmatic nucleus (SCN) of the hypothalamus regulates many of the body’s functions including the timing of hormone production and sleep-wake rhythms (Reid, Zee, & Buxton, 2010). The circadian system assists sleep-wake timing by sending signals that are interpreted as ‘sleep gates’ when high-circadian sleep pressure exists (Tzischinsky, Shlitner, & Lavie, 1993, as cited in Jenni & LeBourgeois, 2006) and ‘wake maintenance zones’ when circadian sleep pressure is low (Strogatz, 1986, as cited in Jenni & LeBourgeois, 2006). In the early evening, the wake-promoting signal of the circadian system is at maximum levels and in the early morning it is at its lowest (Dijk & Czeisler, 1995, as cited in Jenni & LeBourgeois, 2006). Circadian rhythms continue (or ‘free-run’) with near 24-hour periods in environments without time cues, but are normally synchronised to the 24 hour day by a variety of environmental stimuli called zeitgebers. The process known as entrainment involves daily phase shifts induced by stimuli to correct the difference between the intrinsic pacemaker period and the environmental cycle period (Mistlberger & Rusak, 2005). Simply put, this enables the body to synchronise to the 24-hour environmental day even though the biological clock’s cycle is typically longer. Light is the dominant zeitgeber for humans (and most other species) but nonphotic zeitgebers, such as social or work/school-imposed schedules and physical activity, also play a role in entraining rhythms (Mistlberger & Rusak, 2005). A series of studies in adults found that the combination of bright light and social cues resulted in. 6.
(20) INTRODUCTION. more robust regularly timed circadian rhythms compared with bright light or social cues on their own (Wever, 1989, as cited in McGraw, Hoffmann, Harker, & Herman, 1999). Exercise has been found to elicit phase shifts in people, with exercise at night potentially delaying the SCN pacemaker and exercise in the afternoon and evening advancing it (Buxton, Lee, L'Hermite-Baleriaux, Turek, & van Cauter, 2003). Sleep Homeostat The sleep homeostat is the process by which a person’s need for sleep (sleep propensity) increases in relation to the amount of time they have been awake (Sorenson, Carskadon, & Ursin, 2007). The nature of this drive for sleep is unknown, but the process has been conceptualised as a homeostatic pressure that increases across waking and dissipates with sleep (Fuller, Gooley, & Saper, 2006). A measure of the sleep homeostat is the strength of slow-waves (NREM stages 3 and 4) relative to other frequencies in brain activity. The longer a person stays awake, the faster they enter SWS and the greater the duration of SWS when they next fall asleep (Gander, 2003). Another marker for sleep homeostasis is the time it takes to fall asleep (sleep latency), with faster sleep onsets associated with sleep deprivation (Jenni & LeBourgeois, 2006). Two-Process Model One model widely adopted as a conceptual framework of sleep regulation is the two-process model (Borbely, 2009). Jenni and LeBourgeois (2006) concluded that the two-process model of sleep regulation was useful for understanding sleep-wake behaviour and problems in children as well as adults. The two-process model considers the alternating pattern of wakefulness and sleep to be the result of the interaction between two processes, S and C (see Figure 1.4) (Beersma & Gordijn, 2007). Process S represents the homeostatic process of sleep need which increases during waking and decreases during sleep (Beersma & Gordijn, 2007; Borbely & Achermann, 2005). In contrast, process C is entirely controlled by the circadian pacemaker and sets limits on process S, according to the time of day. As soon as S is at its lower limit during sleep, awakening occurs. When S reaches its upper limit during wake, sleep begins (Beersma & Gordijn, 2007). A number of adaptations have been made to the two-process model. A sleep inertia process (W) was added to create the three-process model (Folkard, Akerstedt, & 7.
(21) INTRODUCTION. MacDonald, 1999, as cited in Borbely & Achermann, 2005), and Zavada et al. (2009, as cited in Borbely, 2009) developed a process Z to account for changes in different regions of the brain in sleep homeostasis.. Figure 1.4. The two-process model of sleep regulation. Process S represents sleep need that increases during waking (W) and decreases during sleep. The dotted lines represent process C which is controlled by the circadian pacemaker. Adapted from Beersma, D. G. M., & Gordijn, C. M. (2007). Circadian control of the sleep-wake cycle. Physiology & Behavior, 90, 190-195. Doi:10.1016/j.physbeh.2006.09.010.. 1.2.4 Function of Sleep Sleep has a multiplicity of functions, which are not yet well understood. A number of theories exist regarding sleep’s functionality, some of which are outlined below. Restorative Theory This theory proposes that NREM sleep functions in the restoration of body tissue, and REM sleep in the restoration of brain tissue (Frank, 2006; Sheldon, 2005b). Findings that support this include the increased secretion of anabolic hormones, such as growth hormone and testosterone, and decreased levels of catabolic hormones, such as cortisol, during sleep. Additionally, the feeling of being refreshed after sleep, and increased SWS after sleep deprivation, support the role of NREM sleep as being restorative (Dement, 2009). It may be, however, that sleep influences the physiological. 8.
(22) INTRODUCTION. processes involved in tissue restoration as opposed to having a direct effect (Sheldon, 2005b). REM sleep is thought to assist the restoration of central nervous system (CNS) function.. It may have evolved to incorporate knowledge and learned behaviours. acquired during wakefulness and to reprogramme innate behaviours (Jouvet, 1975, as cited in Sheldon, 2005b).. During REM sleep, the synthesis of CNS proteins is. increased (Giuditta et al., 1984, as cited in Sheldon, 2005b) and significantly higher proportions of this sleep state are found in foetuses and newborns, gradually decreasing across the early years of life (Sheldon, 2005b). Energy Conservation Theory Animals with a higher metabolic rate have a longer total sleep time, suggesting that energy is conserved during sleep (Zepelin & Rechtschaffen, 1974, as cited in Chokroverty, 2009). The energy conservation theory observes that during sleep, energy reduction is greater than during quiet wakefulness and that sleep provides enforced rest periods (Sheldon, 2005b). However, in humans the reduction in metabolism that occurs during sleep is only slight (approximately 8 – 10%) compared with relaxed wakefulness (Chokroverty, 2009; Sheldon, 2005b). This equates to around only 120 calories being conserved during 8 hours of sleep compared to the expectation that significantly more calories would be conserved if energy conservation was sleep’s main function (Chokroverty, 2009). Learning Theory This theory views sleep as playing a crucial role in the process of memory and learning (Frank, 2006; Sheldon, 2005b). A meta-analysis of animal studies conducted by Smith (1996, as cited in Stickgold, Hobson, Fosse, & Fosse, 2001) concluded that REM sleep is critical in the consolidation of procedural learning but not in declarative memory.. Declarative memory relates to the learning of facts and events whereas. procedural memory corresponds to learning how to do something, such as riding a bike (Wagner, 2007). Smith (1996, as cited in Stickgold, et al., 2001) proposed that after procedural training, which was done with rats, ‘REM windows’ occur when increased amounts of REM assist memory retention. Supporting this, studies with humans have shown that. 9.
(23) INTRODUCTION. REM deprivation after training impairs procedural learning (Smith, 1987, & Smith, 1996, as cited in Stickgold, et al., 2001). A number of studies have shown declarative memory tasks not to be dependent on sleep (Castaldo, Krynicki, & Goldstein, 1974, as cited in Stickgold, et al., 2001). Others suggest SWS early in the night may assist declarative memory consolidation (Plihal & Born, 1997, as cited in Stickgold, et al., 2001) which is particularly relevant for children who have high amounts of SWS compared with adults. Backhaus et al. (2008) found that in a group of 9 – 12-year-olds (N = 27) declarative memory retention was significantly increased only after a sleep interval, either immediately after learning or after daytime wakefulness. They therefore concluded that in children sleep does play an active role in declarative memory consolidation. It has also been proposed that the length of the NREM-REM sleep cycle may play an important part in declarative memory (Sheldon, 2005b). Overall, disturbed sleep is not conducive to learning or concentration, but the proof that sleep is essential for memory consolidation is still to be found (Siegel, 2005). Unlearning Theory The juxtaposing theory to learning and memory consolidation is that of unlearning. This is based on the premise that the brain needs to eliminate unnecessary or undesirable information in order to prevent being overloaded (Plaford, 2009). Sleep, particularly REM sleep, may reduce or prevent unwanted information acquired during waking to remain.. This enables the reprogramming and consolidation of more. important material by using a ‘reverse learning’ mechanism (Crick & Mitchison, 1983, as cited in Sheldon, 2005b). Emotional Regulation REM sleep may play a role in emotional processing and the regulation of mood and emotion (Cai, 1991). Perlis and Nielsen (1993, as cited in Harvey, Mullin, & Hinshaw, 2006) summarised three findings that support this theory. Abnormal REM sleep can be seen in a variety of people diagnosed with psychiatric disorders such as schizophrenia and major depression. Secondly, mood and stress prior to sleep seem to influence dream content, emotion within dreams, latency to REM, and REM density (De Koninck & Brunette, 1991, as cited in Harvey, et al., 2006). Thirdly, daytime mood has been shown to be influenced by REM sleep and dreaming. Evidence of this has 10.
(24) INTRODUCTION. been derived from studies involving REM deprivation which have produced irritability, anxiety, and reduced adaptability the following day (Perlis & Nielsen, 1993, as cited in Harvey, et al., 2006). Neuroscience literature has also shown the presence of amygdala activity during REM sleep (Maquet et al., 1996, as cited in Harvey, et al., 2006). These structures have been associated with the acquisition of emotional memories, which enhances the possibility that REM sleep’s role is that of emotional regulation (Harvey, et al., 2006). NREM sleep may also play a part in the regulation of emotions. One of the strongest adverse effects of sleep deprivation has been found to be increased negative mood (Dinges et al., 1997, as cited in Harvey, et al., 2006). Emotional behaviours such as concentration and psychotic tendency can be disrupted by sleep deprivation (Wilkinson, 1965, as cited in Cai, 1991). Shorter NREM sleep durations have been found in people diagnosed with depression and schizophrenia (Spiegel, 1986, as cited in Cai, 1991) and conversely, Wehr et al., (1979, as cited in Cai, 1991) found that increased NREM sleep in people diagnosed with depression resulted in improved mood. Function of Dreaming Besides theories relating to REM function such as the facilitation of memory storage, learning, and unlearning, it has been proposed that a major function of REM sleep, and dreaming associated with it, is the development and maintenance of personal identity. In dreams people appear to be present in the first person and there is always (except in people who are congenitally blind) a succession of events occurring in a typographical setting. This, combined with the fact that dreams are often difficult to remember, led to the conclusion that being in the dream world, as opposed to remembering what happened while there was most important (Staunton, 2001). Foulkes (1982, as cited in Staunton, 2001) found that dream content becomes more complex as children increase in age. Staunton (2001) suggests that this is related to the level of development children have achieved during waking, when attempting to understand their environment and to separate themselves from it. For infants, creating a dream environment that they are in, at regular intervals throughout sleep, may enable them to remember who they are and develop a sense of personal identity. Additionally, as most dreams are forgotten, they are not burdened by having to store a large amount of information about actual dream experiences (Staunton, 2001). Notably, this is only. 11.
(25) INTRODUCTION. one of a number of theories relating to dream function, and therefore requires further investigation. As described, beneficial links have been identified between sleep and brain functioning, body maintenance, mood and emotional regulation, and the development of self-identity. It is therefore reasonable to assume that getting enough good quality sleep is important for children, particularly as they are in a stage of life involving a great deal of knowledge and skill acquisition as well as physical and emotional growth and development.. 1.3 Sleep Across the Lifespan Sleep changes as we age, which is a normal part of the human life cycle. Differences in sleep architecture of childhood, early adulthood and old-age are represented in Figure 1.5. Newborn babies sleep a total of approximately 16 – 18 hours per day, which is made up of multiple bouts of sleep across day and night (Colten & Altevogt, 2006; Gander, 2003). Unlike any other stage of life, newborns have three types of sleep – active sleep (similar to REM), quiet sleep (similar to NREM), and indeterminate sleep (Davis et al., 2004, as cited in Colten & Altevogt, 2006). Sleep is entered through the active state, which accounts for approximately 50% of sleep (Mindell & Owens, 2003). From 2 – 12 months of age sleep duration gradually decreases, with 6-montholds sleeping approximately 14 – 15 hours in total including two naps accounting for 2 – 4 hours of sleep (Lee-Chiong, 2008). Sleep cycles are approximately 50 – 60 minutes long (Gander, 2003; Mindell & Owens, 2003), quiet sleep becomes the dominant sleep stage by 3-months of age (Lee-Chiong, 2008) and REM sleep accounts for approximately 30% of sleep in 1-year-olds (Sorenson, et al., 2007). Toddlers (aged 1 – 3 years) sleep a total of approximately 12 hours per day and naps usually decrease to once a day, resulting in a biphasic sleep pattern at around 18 months to 2-years-old (Lee-Chiong, 2008).. 12.
(26) INTRODUCTION. Figure 1.5. Night sleep hypnograms from a child, young adult and older adult. Adapted from Kales, A., & Kales, J. D. (1974) (p.489) as cited in Chokroverty, S. (2009). An Overview of Normal Sleep. In Chokroverty, S. (Ed.), Sleep Disorders Medicine (3rd Ed.) (p. 15). Philadelphia: Elsevier Saunders.. By the time children start school at age 5-years-old, the majority have stopped napping (monophasic sleep pattern) and have approximately 10 – 11 hours sleep per night (Beine, 2007; Weissbluth, 1995). There is some variability in napping patterns, however. The National Sleep Foundation’s (2004) Sleep in America poll indicated that 2% of 6-year-olds napped daily, compared with Kieckhefer, Ward, Tsai, and Lentz (2008) who found that 32% of 9 – 11-year-olds (N = 54) napped. Cultural variation also occurs in napping, with afternoon naps and later nocturnal sleep times being common in circum-Mediterranean communities.. Worthman and Brown (Worthman & Brown,. 2007) reported that Egyptian children aged 2 – 10 years regularly napped, with a mean diurnal sleep onset of 15:11 (SD = 1.3 hours), mean nocturnal sleep onset of 23:20 (SD = 1.4 hours), and mean total sleep per day of 11.0 hours (SD = 3.6).. 13.
(27) INTRODUCTION. At 5-years of age sleep cycles have normally increased to approximately 90 minutes long (Sheldon, 2005d). REM sleep has usually decreased to approximately 20 – 25% of total sleep time which, as illustrated in Figure 1.6, is the same as adults (Kahn, Dan, Groswasser, Franco, & Sottiaux, 1996; Wolfson, 1996). Unlike adults, however, the percentage of time spent in SWS is greatest in children before they reach puberty (Gander, 2003). Boys have been found to have a greater proportion of SWS than girls (Carskadon et al., 1987, as cited in Kahn, et al., 1996).. Figure 1.6. Trends across age for stage 1 and 2 sleep, SWS, REM sleep, wake after sleep onset (WASO) and sleep latency (in minutes). Adapted from Ohayon, M. M., Carskadon, M. A., Guilleminault, C., & Vitiello, M. V. (2004). Meta-Analysis of Quantitative Sleep Parameters from Childhood to Old Age in Healthy Individuals: Developing Normative Sleep Values Across the Human Lifespan. Sleep, 27(7), 12551273.. 14.
(28) INTRODUCTION. Growth hormone (GH) secretion is clearly linked with sleep onset in this age group and peaks early in the first third of the night during SWS (Lee, Song, Kim, Park, & Moon, 2004; Sheldon, 2005c).. Spontaneous movements during sleep may also. become shorter in duration but increase in frequency as the CNS continues to mature (Hayes & Mitchell, 1998). A low rate of polysomnographically measured arousals have been found at this age, with mean (SD) arousals per hour of total sleep equalling 9.3 (3.9) in 5 – 7 year olds (N = 15) and 9.1 (3.6) in 10 – 11 year olds (N = 14) (Stores & Crawford, 2000). Previous studies have shown pre-pubescent school-aged children to be very alert and active during the day (Carskadon, et al., 1980). However, the impact on sleep time of social and environmental factors such as school schedules, family routines and television viewing, may mean that this has changed in more recent times (Dollman, Ridley, Olds, & Lowe, 2007; Gulliford, Price, Rona, & Chinn, 1990; Ohayon, Carskadon, Guilleminault, & Vitiello, 2004; Szymczak, Jasinska, Pawlak, & Zwierzykowska, 1993; Wolfson, 1996). Middle childhood is also a time when circadian sleep-wake rhythm preferences can begin to develop resulting in children becoming either more morning or evening types, although usually to a lesser degree than teenagers and adults (Achari & Pati, 2007; Lee-Chiong, 2008; Russo, Bruni, Lucidi, Ferri, & Violani, 2007; Werner, LeBourgeois, Geiger, & Jenni, 2009). This may add to the difficulty of getting enough sleep when combined with the environmental factors outlined. Puberty brings more changes in sleep, although sleep latency and sleep efficiency remain similar to that of children aged from five years (Ohayon, et al., 2004). Across the teenage years, SWS decreases by nearly 40% (Carskadon, et al., 1980; Gander, 2003), and the percentage of REM sleep modestly, but significantly, increases from childhood to the end of adolescence (Ohayon, et al., 2004). Circadian sleep-wake rhythms can become significantly phase delayed, resulting in later sleep start times at night and difficulty with waking in the morning when having to get up for school (Borlase, 2001; Carskadon, Vieira, & Acebo, 1993; Gander, 2003). Ohayon et al. (2004) found that total sleep time requirements did not change significantly from the age of five to the end of adolescence and that environmental factors such as school schedules had a greater impact on actual sleep time than biological factors.. This has been found to commonly result in teenagers having. 15.
(29) INTRODUCTION. cumulative sleep debt with negative impacts on daytime functioning (Dorofaeff & Denny, 2006; Meltzer & Mindell, 2006). Once adulthood is reached, sleep duration tends to be approximately 7.5 – 8 hours per night (Chokroverty, 2009). Sleep architecture continues to change as adults age, resulting in earlier wake times and reduced sleep consolidation in older adults (Dijk, Duffy, & Czeisler, 2000). Sleep latency, and percentages of stage 1 and stage 2 NREM sleep increase with age and the percentage of REM sleep and SWS decreases (Ohayon, et al., 2004). In older adults sleep patterns may also become biphasic (Chokroverty, 2009), with afternoon naps making up for sleep disruptions at night (Gander, 2003). Sleep in middle childhood is therefore one of many stages in a continuum of normal sleep changes across the lifespan. Positively, it has been identified as an ideal time for developing healthy sleep habits that may benefit children through to their later years in life, as children are considered to be particularly receptive to learning about sleep at this age (Mindell & Owens, 2003).. 1.4 Measuring Children’s Sleep There are a number of ways to measure the sleep of children, both objectively and subjectively, and accurate assessment is often difficult (Quan, et al., 2003). In order to account for the complexities of sleep, which involves both biological and psychosocial/environmental factors, it is advantageous to use a multi-method approach (Harvey, et al., 2006).. 1.4.1 Objective Measures Two commonly used objective measures of children’s (and adults’) sleep are polysomnography and actigraphy. They have a number of advantages associated with the objective nature of data collection and analysis. Significant discrepancies can still occur, however, due to a variety of methods and devices used (Ohayon, et al., 2004). Polysomnography Polysomnography (PSG) is the gold standard measure of sleep. It was first described in 1937 as the monitoring of brain wave signals (Loomis, Harvey, & Hobart, 16.
(30) INTRODUCTION. 1937, as cited in Collop, 2006). Originally, signals were recorded on paper with pen and ink and reviewed page by page. Since then, a number of physiological variables have been added and PSG has become digitised (Collop, 2006; Gander, 2003). PSG involves the placement of electrodes on the surface of the scalp and face to measure EEG, EOG and EMG (Harvey, et al., 2006). Depending on the aims of the research, additional variables can be measured including chest and abdominal wall movement, electrocardiogram (ECG), air flow, arterial oxygen saturation via pulse oximetry, and end-tidal CO2 levels (Golan, Shahar, Ravid, & Pillar, 2004). The standard International 10-20 System (see Figure 1.7) is predominantly used for electrode placement.. This enables symmetrical and reproducible placement,. resulting in comparable data from the same or different participants, and recordings from the same or different laboratories (Sheldon, 2005d).. Figure 1.7. The International 10-20 system for electrode placement in PSG. EEG leads are placed 10-20% apart accordingly, using the four major landmarks. Adapted from Collop, N. A. (2006). Polysomnography. In Lee-Chiong, T. L. (Ed.), Sleep: A Comprehensive Handbook (p. 974). New Jersey: John Wiley & Sons.. 17.
(31) INTRODUCTION. Sleep is normally scored in 30 second epochs using standard guidelines of Rechtschaffen and Kales (1968, as cited in Carskadon & Rechtschaffen, 2005), or more recently altered guidelines published by the AASM (American Academy of Sleep Medicine, 2007), which is a time-consuming process. The scoring of standard sleep stages is usually possible for children from 6 – 12 months of age, and once middle childhood is reached all stages of sleep are usually easily identifiable (Griebel & Moyer, 2006; Sheldon, 2005d). For younger infants a breakdown of active versus quiet sleep is conducted (Griebel & Moyer, 2006). Using PSG with children requires careful consideration of factors such as prestudy preparation, patient safety, and the sleep laboratory environment. Children and parents may feel anxious about the general process, and that the electrode placement and equipment may interfere with the child’s sleep (Sheldon, 2005d; Sitnick, GoodlinJones, & Anders, 2008). They may also have concerns about safety due to electrical equipment being used, and children may feel uncomfortable sleeping in a laboratory setting. This can result in a ‘first night effect’, where the first night’s recording does not represent typical sleep due to adjustment to the sleep laboratory environment (Montgomery-Downs, O'Brien, Gulliver, & Gozal, 2006). A minimum of two nights in the laboratory is therefore the usual standard. An alternative can be home-based PSG using ambulatory monitoring systems, depending on equipment and staff availability. Better sleep quantity and quality in children have been found when using this method, resulting in the measurement of only one night due to the lack of ‘first night effects’ (Stores, Crawford, Selman, & Wiggs, 1998). Although PSG is considered the gold standard measure of sleep, there are a number of associated disadvantages. These include the financial expense, potential discomfort, and the relatively intrusive and labour-intensive nature of the process (Griebel & Moyer, 2006; Harvey, et al., 2006).. These need to be weighed up. particularly when working with children, who are deemed a vulnerable population. Actigraphy An alternative means of measuring sleep objectively is actigraphy. It involves the use of a portable wristwatch-like measuring device that records body movement in order to differentiate between periods of wakefulness and sleep, and has been. 18.
(32) INTRODUCTION. extensively used in the study of circadian rhythms and sleep (Harvey, et al., 2006; Morgenthaler, et al., 2007; Sadeh & Acebo, 2002). A miniaturised acceleration sensor samples physical motion. This is translated by a processor into numerical digital data, with frequency of motion summarised into epochs of specified time duration which are then stored in the actigraph’s memory (Harvey, et al., 2006; Sadeh, Hauri, Kripke, & Lavie, 1995). Data are downloaded to a computer and analysed to generate sleep variables including sleep onset latency, sleep duration, and sleep efficiency (Harvey, et al., 2006; Owens, et al., 2009). Actigraphy has the advantages of being less expensive, minimally intrusive, and able to monitor sleep over longer periods of time (such as across school and non-school nights) compared to PSG (Harvey, et al., 2006; Sadeh, 2008; Sadeh, et al., 1995). It also enables sleep to be measured more easily in the naturalistic home environment (Aronen, Paavonen, Fjallberg, Soininen, & Torronen, 2000; Owens, et al., 2009; Sadeh, 2008), which can result in more typical sleep patterns compared to those seen in the laboratory (Ancoli-Israel, et al., 2003). It has been identified as being particularly useful for measuring the sleep of people who are less tolerant of PSG, such as children (Ancoli-Israel, et al., 2003; Morgenthaler, et al., 2007). Actigraphy can provide reassurance to parents who may be concerned about the quantity or quality of their children’s sleep, as significant discrepancies may exist between parental perception and the reality of their children’s sleep (Applebee, Bingham, & Attarian, 2009). This may, in part, be due to parents being less aware of when their children wake during the night as children become more independent during middle childhood and therefore require less support to resettle (Sadeh, 2008). The main disadvantage of using actigraphy is that it does not measure actual sleep, but rather infers sleep from activity (Morgenthaler, et al., 2007; Paavonen, Fjallberg, Steenari, & Aronen, 2002). Although it can provide useful information on behavioural aspects of sleep, it is unable to provide details of the internal structure of sleep (Harvey, et al., 2006; Sadeh, Raviv, & Gruber, 2000). Also, because it estimates sleep based only on movement, it is a relatively blunt measure particularly when identifying the precise time of sleep onset (Ancoli-Israel, et al., 2003; Harvey, et al., 2006; Tryon, 2004). Further difficulties may be experienced when using actigraphy with people who lie still for long periods, such as those with insomnia, as this may be incorrectly scored as sleep as opposed to still wakefulness (Kushida, et al., 2001; Sadeh & Acebo, 2002). 19.
(33) INTRODUCTION. Overall, actigraphy has been found to be a reliable objective measure of sleep which has a number of advantages when working with children, including being minimally intrusive and enabling sleep to take place in the natural home environment over long periods of time. It is not as accurate or as informative as PSG, particularly in relation to sleep architecture and night waking. It is more reliable, however, than simply using sleep logs or observation and can provide useful objective information on a number of sleep-wake parameters (Ancoli-Israel, et al., 2003).. 1.4.2 Subjective Measures Subjective measures of sleep such as sleep diaries, questionnaires, and interviews can provide valuable information not only on when people are sleeping but how they believe or feel they have slept, which can affect functioning during the day (Semler & Harvey, 2005). They are commonly used in studies of children’s sleep and are either completed by parents or children themselves, depending on age. Children often do not complain about problems they are experiencing with their sleep, therefore asking children and parents to report on their sleep may assist with the identification of issues that may have otherwise gone unnoticed (Goodlin-Jones, Waters, & Anders, 2009; Owens & Mindell, 2005). Sleep Diaries Sleep diaries prospectively measure sleep patterns and sleep quality over a number of days. They are low in cost, easy to administer, and able to capture weekday and weekend data (Meltzer, Mindell, & Levandoski, 2007), which is particularly useful when exploring whether children’s sleep may be affected by school schedules (Ohayon, et al., 2004). They are widely used in clinical and research settings and have been found to have high internal consistency and reasonable face validity (Corkum, Tannock, Moldofsky, Hogg-Johnson, & Humphries, 2001).. The need has been identified,. however, for a standardised, validated sleep diary format which currently does not exist (Smith, et al., as cited in Meltzer, et al., 2007). Using diaries, parents can often accurately report specific, observable problems such as bedtime resistance and night terrors; however, as already discussed, other issues such as night waking may not be noticed due to children’s independence in resettling. 20.
(34) INTRODUCTION. (Acebo, et al., 2005; Aronen, et al., 2000). Limited awareness of sleep onset delays has also been found (Owens, Spirito, McGuinn, & Nobile, 2000). In busy family lives, diaries may not be completed immediately resulting in less accurate retrospective completion (Meltzer, et al., 2007; Sadeh, et al., 2000). Parents may also exhibit poor adherence with multi-day sleep diaries or forget to return them (Smith, et al., as cited in Meltzer, et al., 2007). Including strategies in study protocols such as follow-up phone calls to parents during the data collection period may enhance the accuracy of diary data (Acebo, et al., 2005). Combining sleep diaries with objective measures, such as actigraphy, can provide a more accurate picture of children’s sleep. Questionnaires Questionnaires are cost effective and easy to use in large scale surveys to evaluate the impact of social and other factors on sleep quantity and quality (Johns, 1971, as cited in Gulliford, et al., 1990). However, because they provide retrospective estimates of sleep, respondents (often parents in the case of studies of children) are required to average sleep values over several days or weeks which may be difficult. The retrospective nature of reporting may result in reasoning biases such as answering on the basis of saliency (the worst night) or recency (the last night) (Harvey, et al., 2006). Parents have also been found to overestimate their children’s sleep duration, often basing times on going to bed and rising rather than going to sleep and waking (Goodwin, et al., 2007; Gruber, Sadeh, & Raviv, 1997; Gulliford, et al., 1990; Werner, et al., 2009). Children often fall asleep in their own room independently in middle childhood, therefore parents may be unaware of actual sleep start times (Nixon, et al., 2009). In adults, a number of questionnaires and clinical sleep scales have been validated to measure the presence of insomnia (e.g. Insomnia Severity Index) (Bastien, Vallieres, & Morin, 2001), sleep disturbance (e.g. Pittsburgh Sleep Quality Index) (Buysse, Reynolds, Monk, Berman, & Kupfer, 1989, as cited in Barclay & Gregory, 2010), and daytime sleepiness (e.g. Stanford Sleepiness Scale) (Hoddes, Dement, & Zarcone, 1972, as cited in Short, Lack, & Wright, 2010). However, these measures have not been validated on, or specifically designed for, children (Harvey, et al., 2006; Kothare & Kaleyias, 2008). A more recently developed sleep scale tool is the Pediatric Daytime Sleepiness Scale which is a validated measure (internal consistency Chronbach’s α = 0.80) for 21.
(35) INTRODUCTION. assessing excessive sleepiness in school children (Drake, et al., 2003). Additionally, two validated and widely used questionnaires in children are the Pediatric Sleep Questionnaire (PSQ) (Chervin, Hedger, Dillon, & Pituch, 2000) and Children’s Sleep Habits Questionnaire (CSHQ) (Owens, Spirito, & McGuinn, 2000). The PSQ was developed to assist with the assessment of sleep-related breathing disorders (Chervin, et al., 2000), while the CSHQ was developed to survey both behavioural and medical sleep problems in children aged 4 – 10-years-old, primarily in community populations (Owens, Spirito, & McGuinn, 2000).. 1.5 Normal Sleep in Middle Childhood Understandably, it is common for parents to want to know how much sleep their children should be getting and what is considered to be ‘normal’. The National Sleep Foundation in America (http://www.sleepfoundation.org) recommends that children aged 5 – 12-years have 10 – 11 hours sleep. Similar estimates are included on New Zealand websites including http://www.kiwifamilies.co.nz (which uses National Sleep Foundation information) and http://liveto100.everybody.co.nz (9 – 11 hours for 5 – 12year-olds). While guidelines can be helpful for families, it is important to realise that individual children may have differing sleep needs. Large interindividual variability has been found in children’s sleep duration, with trait-like stability over time from the ages of 1 – 10 years (Jenni, Molinari, Caflisch, & Largo, 2007). Jenni and colleagues (2007) concluded that there could not be one specific optimal amount of sleep recommended for the entire child population (for example, all children should sleep for 12 hours) due to these individual differences. The recognition that some children sleep less than others is important in order for health professionals and parents to develop realistic expectations regarding bedtimes and sleep length. As a general guide, if children wake by themselves in the morning, engage in age-appropriate behaviour during the day, and do not show signs of daytime sleepiness, then it is likely they are getting enough sleep (Jenni, et al., 2007; Mindell & Owens, 2003). Summary data from a sample of academic literature on the normal sleep of healthy school-aged children, categorised by polysomnographic, actigraphic and subjective measures, are provided in Tables A1, A2, and A3 (see Appendices Section A). Variability between findings from the three groupings can be seen, with longer 22.
(36) INTRODUCTION. sleep durations reported in the subjective (predominantly parentally-reported) data versus polysomnographic and actigraphic findings. Notably, equipment and protocols varied not only between the types of measures used but also within the three clusters. For example, PSG was carried out in both laboratory and home settings (Table A1). Although direct comparison of results in these studies is impossible due to variability in age groups, sample sizes, and conditions, it appears that in general home-based PSG resulted in longer sleep than laboratory-based PSG (see Section 1.4.1). Similarly, Table A2 shows a range of actigraphic placement, analysis sensitivity settings/algorithms and measurement periods which may have impacted on values deemed to be normal. Importantly, the amount of sleep children had was defined in numerous ways across the studies including polysomnographically scored sleep time (Table A1), actigraphically scored sleep time (not including wake periods during the sleep interval), actigraphically scored sleep duration (the time period from sleep starting to sleep finishing including periods of wake) (Table A2), parentally reported bedtime to wake time, and parentally reported sleep onset time (as opposed to bedtime) to wake time (Table A3). This highlights some of the difficulties with being able to identify, interpret and compare normative data. However, bearing these limitations in mind, the reviewed data do provide a useful range of ‘normal’ sleep values. These can be used to assist parents, health professionals, teachers, and ultimately children, to identify sleep requirements, provided individual needs are taken into account. In line with recommendations for school-aged children’s sleep, the literature reviewed in Tables A1, A2 and A3 indicates that children spent approximately 9 – 12 hours in bed and 7 – 10 hours sleeping. Sleep efficiency ranged from around 84 – 98% and children took approximately 12 – 33 minutes to get to sleep (sleep onset latency). New Zealand data are limited. However, using actigraphy with 519 children from the Auckland Birthweight Collaborative (ABC) Study, Nixon et al. (2008; 2009) found that 7-year-olds were sleeping an average of 10.1 hours, with median sleep latencies of 26 minutes (Table A2). Subjective reports indicated that 5 – 11-year-olds in New Zealand spent approximately 10 – 11.9 hours in bed (Duncan, Schofield, Duncan, & Rush, 2008; Landhuis, et al., 2008) (Table A3), which is similar to overseas findings. Limitations of New Zealand data include the small number of studies carried out to date on school-aged children’s sleep, with only one using objective measures. Objective data gathered by Nixon et al. (2008; 2009) were obtained using 24 hours of actigraphic recording, as opposed to the recommended minimum of five nights (Acebo, 23.
Figure


+7


Related documents
1. Behrens & Margaret Horn, Liability for Asbestos-Containing Connected or Replacement Parts Made by Third Parties: Courts Are Properly Rejecting this Form of Guilt by
proportion of available habitat in the VPS ...53 2.8: Results of the Euclidean distance analysis for habitat selection of yellowtail snapper ...54 2.9: Spatial positions
In general, the six clusters differed mainly on Richness, Working with students and materials, Student participation in meaning making and reasoning , and in
This special issue of the Nordic Journal of Science and Technology Studies is interested in how nature, in different versions and forms, is invited into our studies, analyses,
Considering the control re- quirements that are characteristic of this topology and its applications, several variations of the algorithm are stud- ied and compared to classical
Compared to the conventional linear model predictive controller, the horizontal off-track distance reduced by 36.8% and the longitudinal deviation reduced by
provincial and national and international levels – has a role in performing good disease surveillance and in using information for action... Components of an
This study is grounded on previous empirical studies regarding attitude to advertisements, highlighting the embed creative feature to appeal to consumers, though these studies
