2 About the authors
Jon Andrews is Director for School System and Performance and Deputy Head of Research at the Education Policy Institute. Prior to this, Jon worked in the Department for Education from 2003 to 2016.
Dr John Jerrim is Professor of Social Statistics at UCL Institute of Education. He conducted all PISA-related statistical analysis for this publication, and contributed to the writing of the report.
Natalie Perera is Executive Director and Head of Research at the Education Policy Institute. Natalie was formerly a civil servant, working in the Department for Education and the Cabinet Office until 2015.
Acknowledgements
The authors are grateful to EPI colleagues, including Peter Sellen and David Laws, as well as to colleagues in the Department for Education for their advice on the interpretation and use of the PISA data.
About the Education Policy Institute
The Education Policy Institute is an independent, impartial, and evidence-based research institute that aims to promote high quality education outcomes, regardless of social background.
Education can have a transformational effect on the lives of young people. Through our research, we provide insights, commentary, and critiques about education policy in England – shedding light on what is working and where further progress needs to be made. Our research and analysis spans a young person’s journey from the early years through to higher education and entry to the labour market. Because good mental health is vital to learning, we also have a dedicated mental health team which considers the challenges, interventions, and opportunities for supporting young people’s wellbeing. Our core research areas include:
• Benchmarking English Education
• School Performance, Admissions, and Capacity • Early Years Development
• Vulnerable Learners and Social Mobility • Accountability, Assessment and Inspection • Curriculum and Qualifications
• Teaching and Leadership: Supply and Quality • School Funding
• Higher Education, Further Education and Skills
3 ISBN: 978-1-909274-46-4
This publication includes analysis of the National Pupil Database (NPD): https://www.gov.uk/government/collections/national-pupil-database
The Department for Education is responsible for the collation and management of the NPD and is the Data Controller of NPD data. Any inferences or conclusions derived from the NPD in this publication are the responsibility of the Education Policy Institute and not the Department for Education.
4
Contents
Foreword ... 5
Executive summary ... 6
Our findings ... 6
Introduction ... 9
Part 1: Calculating a world class benchmark ... 10
Identifying the world leading countries ... 10
Data ... 13
Results ... 15
Mathematics ... 15
English Language ... 19
Science ... 23
Attainment 8 ... 23
Part 2: England’s performance against a world class benchmark ... 25
Overall performance in England ... 25
Performance by local authority area ... 26
Performance by Regional Schools Commissioner region ... 29
Performance in Opportunity Areas ... 31
Part 3: Performance in Wales, Scotland, and Northern Ireland ... 33
Part 4: Conclusions and policy implications ... 38
Annex A: A comparison of the distribution of GCSE grades in PISA compared to national figures ... 39
5
Foreword
Much debate about education in England focuses on how well our education system is performing, in terms of measures of student progress and attainment.
But it is difficult to assess properly England’s education system without comparing it fairly and meaningfully to that of other comparable countries. Unfortunately, such comparisons are not always easy to make, and how well England is performing has remained highly contested territory in
political and educational debate.
An accurate understanding of what it would mean for England to have a ‘world class’ education system becomes even more important as the government introduces new GCSE exams with a new grading system, explicitly designed to set a ‘world class standard’. When the new system is in place, it is likely that the proportion of pupils achieving the government’s key measure of GCSE success will plunge by around 20 per cent – unless the government waters down its ambition to raise the benchmark for what constitutes a robust pass (from a grade C under the old system to a grade 5 under the reformed system).
This EPI report helps inform these key debates by assessing what a world class standard really looks like in key subjects – translating international PISA data into GCSE equivalents. We then look at how England, parts of England, and other parts of the UK measure up against this world class benchmark. Later this year we will publish further reports, drawing international comparisons about the size of the gaps between disadvantaged pupils and their peers, and about performance in primary education.
This will eventually allow us to benchmark England across a small range of key indicators, rather than on average GCSE equivalent attainment alone. To compare education systems fairly, we may be interested in the spread of attainment, for example, as well as in the average attainment.
EPI is very grateful to Dr John Jerrim of the Institute of Education for his work on this project. We are also grateful to the Department for Education for allowing us to use the relevant datasets.
As ever, we very much welcome comment on this report. Rt. Hon. David Laws
6
Executive summary
Over the last decade, England’s performance in maths and reading in the OECD’s Programme for
International Student Assessment (PISA) has remained average, and its ranking among other developed countries has stagnated. England now ranks 24 out of 40 countries in maths and 17 in reading.1 Given the focus and investment in education under successive governments over the past
twenty years, the inability of England to rise up these global rankings and compete with world leading countries may be considered by policy makers as disappointing.
The standards of education in England will also be brought into sharp focus this year when, for the first time, pupils receive their results in new, more challenging, maths and English GCSEs. The new GCSEs will be scored under a numerical 9-1 framework. Over time, the existing A*-G grading system is being phased out for all subjects.
In this report, we conduct two new pieces of analysis. First, we use the latest international assessment data from PISA to identify the five highest performing nations in maths, reading, and science, and consider the extent to which England needs to improve in order to catch up with these top performers. We translate the results into GCSE grades (under both the existing and new
systems), so that the world class benchmark is measurable using the English qualifications framework.
Second, we look at how well different parts of the country are performing against this benchmark: comparing local authority areas, areas under each of the eight Regional Schools Commissioners, and
the Department for Education’s twelve Opportunity Areas.
Finally, we look at the variation in performance across the devolved nations, considering what this means for the level of improvement needed in each home nation in order to compete with the highest performing countries.
Our findings
In order to match the top five performing countries in maths and reading (English Language),
pupils in England will need to score an average of a grade 5 under the new 9-1 GCSE
framework.
2The guidance from the Department for Education states that the new grade 5 represents a ‘strong pass’– our analysis finds that this has been set at broadly the right level to be considered as reaching a world class standard.
The required improvement in maths is significantly greater than in reading (English Language). In maths, the biggest challenge appears to be reducing the number of low attaining pupils (those failing to secure a grade C or higher under the existing grading structure).
The average of the top five countries in maths (Singapore, Hong Kong, Macao, Taiwan, and Japan) is currently equivalent to a GCSE point score of 5.4. The average in England is currently 4.7 – meaning
1 This includes the 35 OECD countries and 5 further high performing countries.
7
that there needs to be an increase of around two-thirds of a GCSE grade, on average, in order to match the top-performing countries.
Under the current system, this means that England needs to increase the number of top
performing pupils (those securing an A*-B grade) by over a third and almost halve the number of low performing pupils (those failing to secure a C grade or higher) in maths.
This means that around 96,000 additional pupils need to score an A*-B in maths and the number of low performing pupils needs to fall by 60,000.
The average of the top five countries in reading (Singapore, Hong Kong, Canada, Finland, and the Republic of Ireland) is currently equivalent to a GCSE point score of 4.9. The average GCSE score in England is only slightly lower, at 4.7.
In order to match the average performance of the top five countries in reading, England needs to increase the number of top performing pupils (those securing an A*-B grade) by a sixth and reduce the number of low performing pupils (those failing to secure a C grade or higher), by just under a quarter.
This means that around 42,000 additional pupils would need to score an A*-B in English. The number of low performing pupils also needs to fall by around 42,000.3
Half of pupils in England should be scoring a total of 50 points or higher across Attainment 8
subjects in order to match the top performing nations.
As our analysis finds that the world class benchmark in maths and reading (English Language) is equivalent to around a new grade 5, by applying the same criteria to all other Attainment 8 subjects, the total score that the system should be aiming for is 50 (under the new scoring criteria which is starting to be introduced from August 2017).4 Because we are looking at the level of attainment that
England would need to reach to be on par with the average of the highest performing countries, this suggests that a credible goal is for around 50 per cent of pupils to be achieving 50 points or more across Attainment 8 subjects.
Currently, only 40 per cent of pupils in England achieve this world class benchmark.
While almost 60 per cent of pupils in England achieved the old measure of 5 A*-C grades (including English and maths), only 39.5 per cent of pupils achieved 50 points or more in Attainment 8 subjects in 2016. In order to be on a par with the highest performing countries, the proportion of pupils achieving 50 plus points across Attainment 8 subjects needs to increase by over a quarter. This equates to around 60,000 additional pupils.
3By comparison, published statistics show that 158,000 pupils achieved a D grade or lower (including missed or pending results) in GCSE English in 2016: https://www.gov.uk/government/statistics/revised-gcse-and-equivalent-results-in-england-2015-to-2016.
4Mathematics and English are double weighted in the attainment 8 calculation. This means we multiply our
8
However, performance across England is variable. In London, 45 per cent of pupils achieved
the world class benchmark, while fewer than a third achieved it in other parts of the country.
Of the 150 local authority areas in England with results at GCSE, only 14 exceed the benchmark of half of pupils achieving 50 points or more across Attainment 8 subjects. Most of these high performing areas are academically selective – meaning that the performance in these areas is skewed by the selection of high attaining pupils. In some local authority areas, including the Isle of Wight, Knowsley, Blackpool, and Nottingham, the proportion is just over a quarter. Not surprisingly, attainment is particularly low in the government’s Opportunity Areas. Here, on average, less than a
third of pupils achieved the benchmark in 2016.
The other UK nations also need to improve significantly – particularly Wales.
We also consider how well UK nations perform, compared to our five world leading countries in mathematics and reading. Scotland and Northern Ireland are only just behind England in terms of the proportion of pupils achieving an A*-B (44 and 43 per cent respectively) in maths. Wales, however, is distinctly lower, at 38 per cent.
This means that, in order to compete with the highest performing countries, Scotland and
Northern Ireland would each need to improve the proportion of high attaining pupils in maths by over a third, while Wales would need to improve further still – by over a half.
All of the UK nations need to reduce considerably the proportion of low attaining pupils (those failing to secure a grade C). Wales needs to halve the proportion of low attaining pupils (from 28 to 14 per cent), while the required reduction in Scotland and Northern Ireland is just under half (from 24 per cent to 14 per cent) – similar to the reduction required in England in maths.
Conclusion
The findings from this new analysis make clear that England’s education system needs to improve
significantly if it is to be on par with the leading countries in maths and reading. In particular, England (and indeed the other UK nations) needs to focus on the lowest attaining pupils – who are over-represented in the UK compared to world leading nations.
Once again, the variation in performance across England and the UK is a cause for concern for policy-makers. London continues to outperform the rest of the country against these new world class measures.
The Education Policy Institute will continue to monitor performance against these measures in both England and the wider UK. Later this year, we will expand this work to consider world class
9
Introduction
In 2000, the Organisation for Economic and Co-Operative Development (OECD) undertook the first in a series of international benchmarking tests, the Programme for International Student Assessment (PISA).
Taking place every three years, PISA assesses 15 year olds from OECD and other participant
countries and economies in mathematics, reading and science. In the latest PISA study, conducted in December 2015, 72 countries and economies participated – including all 35 OECD countries and 37 partner countries and economies.
Since the inception of PISA almost two decades ago, England’s performance has remained at around average in mathematics and reading and just above average in science. As England’s performance
has stagnated (particularly in reading and science), countries from a variety of starting points and with a range of historical contexts, such as Poland, Portugal, Norway, and Germany, have shown marked improvements in at least one of the assessment areas.5 There is arguably, therefore, scope
for education standards in England to improve so that young people in this country are able to compete with their peers in educational terms.
In the first section of this report, we match the PISA 2015 performance data with that of English pupils who then went on to take their GCSEs in 2016. We then consider how well pupils in England are performing, compared to the highest performing nations in maths, reading and science. This enables us to identify a new world class benchmark which, if met, would place England amongst those top performing nations.
In the second section of this report, we go on to consider how well different geographical areas and different groups of pupils in England are performing against this new world class benchmark. This updates the Education Policy Institute’s reports last year: ‘Education in England: Progress and Goals’ and ‘Education in England: Annual Report 2016’.
This report focuses on identifying and monitoring a world class benchmark for secondary pupils only. Later this year, we will publish similar analysis which will identify world class benchmarks for primary pupils and for the socio-economic gap in attainment.
10
Part 1: Calculating a world class benchmark
We have used the PISA dataset, linked to the National Pupil Database (NPD), to assess how well pupils in England who sat the PISA tests then went on to perform in their GCSEs. We then simulate
how the distribution of GCSE grades would need to change in order for England’s performance in
international assessments to start matching the world’s leading countries.
Identifying the world leading countries
We have defined the ‘world leading countries’ as the top five highest attaining in each of mathematics, reading, and science as measured by PISA 2015.
It is important to recognise, however, that there are multiple outcomes from education systems, and that those at the very top of international league tables (i.e. the countries that we focus upon in this report) may also have some other undesirable features in terms of pupils’ performance. For
instance, although a country may have high average scores, there may also be large socio-economic disparities in achievement.
To help policy makers consider this issue, Figure 1.1 compares England to a group of countries across a range of indicators to establish the strengths and weaknesses of each education system in terms of
11
Figure 1.1: Key indicators across OECD and participant economies
Country Average TIMSS maths score Average PISA maths score Average PISA reading score Gap between highest and lowest achievers Gap between lowest achievers and median Socio-economic gap
Singapore 618* 564* 535* 247 135 98*
Hong Kong 615* 548* 527* 232 127 52*
Macao - 544* 509* 204* 107 * 34*
Taiwan 597* 542* 497 266* 144* 94
Japan 593* 532* 516* 227* 120 79
China - 531* 494 276* 150* 117*
South Korea 608* 524* 517* 258* 137 92
Switzerland - 521* 492 247 132 91
Estonia - 520* 519* 209* 106* 68
Canada - 516* 527* 227* 117* 67*
Netherlands 530* 512* 503 237 127 79
Denmark 539 511* 500 209* 108* 69
Finland 535* 511* 526* 210* 110* 73
Slovenia 520* 510* 505 228* 118 73
Belgium 546 507* 499 255 138 104*
Germany 522* 506* 509* 230* 119 89
Poland 535* 504* 506 226* 114* 79
Ireland 547 504* 521* 206* 105* 76
Norway 549 502* 513* 219* 113* 67*
Austria - 497 485* 247 130 89
New Zealand 491* 495 509* 238 122 88
Sweden 519* 494 500 233 120 89
Australia 517* 494 503 242 124 85
England 546 493 500 245 129 80
France 488* 493 499 249 134 110*
Northern Ireland 570* 493 497 204* 108* 75
Czech Republic 528* 492 487* 235 121 107*
Portugal 541 492 498 249 129 97*
Scotland - 491 493 219* 110* 75
Italy 507* 490 485* 241 123 78
Iceland - 488 482* 241 122 62*
Spain 505* 486* 496 220* 115* 83
Luxembourg - 486* 481* 244 123 111*
Latvia - 482* 488* 200* 101* 67*
Wales - 478* 477* 201* 101* 52
Hungary 529* 477* 470* 246 128 114*
Slovak Republic 498* 475* 453* 247 130 95
Israel - 470* 479* 269* 141* 91
United States 539 470* 497 230* 115* 86
Greece - 454* 467* 234 119 78
Chile 459* 423* 459* 221* 109* 95
Turkey 483* 420* 428* 212* 100* 59*
13
We plan to take this analysis further by identifying world class benchmarks in terms of attainment at primary (looking at the Trends in International Maths and Science Study) and minimising socio-economic disparities and raising the attainment of the most disadvantaged groups. However, in this report, our goal is to establish what a world class benchmark looks like in terms of England’s average results in national examination measures. Our focus here is therefore solely on countries with the highest average scores in mathematics, reading, and science.
The five top-performing countries in each subject are: Mathematics: (England average PISA score = 493)
▪ Singapore (average PISA score = 564)
▪ Hong Kong (548)
▪ Macao (544)
▪ Taiwan (542)
▪ Japan (532)
Reading in national first language: (England average PISA score = 500)
▪ Singapore (average PISA score = 535)
▪ Hong Kong (527)
▪ Canada (527)
▪ Finland (526)
▪ Republic of Ireland (521)
Science : (England average PISA score = 512)
▪ Singapore (average PISA score = 556)
▪ Japan (538)
▪ Estonia (534)
▪ Taiwan (532)
▪ Finland (531)
Data
We use the data from the most recent PISA cycle in 2015, when a total of 72 countries participated. While PISA 2000 to 2012 were all paper-based tests, computer-based assessment was used in PISA 2015 for the first time. Rather than assessing pupils’ knowledge of national curricula, PISA attempts to capture how well young people can apply reading, science, and mathematics skills in real-world situations.
A two-stage sample design was used to collect the data. Schools were first sampled with probability proportional to size, and then pupils randomly selected from within. A total of 5,194 pupils from 206 schools in England participated in PISA 2015, which reflects official response rates of 92 percent at the school level and 88 percent at the pupil level.6 These are high response rates for a social survey
conducted in England, with the sample consequently looking similar to the national population in
14
terms of a range of variables. 7 This is similar to the response rates achieved in most other countries,
and is fully compliant with the standards set by the OECD. In England, almost every participating pupil is within the same year group (Year 11), which is not the case in most other countries, due to variable school starting dates and the use of grade repetition.8 Further details on the comparison of
GCSE grades for the PISA 2015 sample for England compared to the national grade distribution based upon data from all Year 11 pupils is provided in Annex A. Throughout our analysis, we apply the final pupil response weights to take into account the complex PISA survey design.
The PISA 2015 sample for England has been linked to the National Pupil Database (NPD), which
includes administrative data on pupils’ backgrounds along with their performance on national
examinations. Critically, this includes pupils’ GCSE grades. A successful link has been made for 4,914 pupils (95 percent of the sample).9 The total number of pupils with valid information on GCSE
mathematics grades is 4,778 pupils (92 percent of the sample) and 4,735 pupils (91 percent of the original sample) for English Language grades.
Although in this project we are attempting to benchmark GCSEs against the PISA study, it is important to recognise that these two assessments differ in non-trivial ways. First, whereas GCSEs
measure pupils’ knowledge, understanding, and application of material taught within national curricula, PISA focuses more upon the application of skills in real-world situations. Importantly, there is no writing component in PISA equivalent to this aspect of the English GCSE. Second, previous analysis of the PISA test questions found that they typically require a greater amount of reading than GCSE examinations, particularly in science.10 Third, the tests are taken around six months apart, with
Year 11 pupils first taking PISA in November/December 2015 and then sitting their GCSEs in
May/June 2016. Fourth, whereas GCSEs continue to be implemented using pen and paper, PISA 2015 was a computer-based assessment. Finally, GCSEs are a high-stakes test for pupils and schools, who have a great deal riding upon the results. This is not the case for PISA, which is a low-stakes test, with the results having little direct impact on pupils or schools.
The main implication of these differences is that, although PISA scores and GCSE grades will be positively correlated, it is unlikely that there will be an exact relationship. Indeed, previous research has suggested that demographic groups perform differently across the two assessments.11 There will
consequently be an element of uncertainty in our results, and the benchmarks we set for England to become a world leading PISA country. Nevertheless, given that PISA scores and GCSE grades
7 See Appendix B of Jerrim, J. and Shure, N. ‘Achievement of 15-Year-Olds in England: PISA 2015 National Report., 2016’
8PISA draws an age-based sample, meaning all pupils are around age 15/16 at the time of the assessment. In England, the timing of the assessment means almost all the selected pupils are within Year 11. However, in other countries, pupils of this age are spread across different school year groups.
9 Independent school pupils were less likely to have linked GCSE data than state school pupils. Although the high overall linkage rate should mean that this has only a relatively minor impact upon our results, the multiple imputation methodology we shall describe in the following section should further limit any potential bias due to linkage not being possible.
10 G. Ruddock, T. Clausen-May,C. Purple and R. Ager, Validation Study of the PISA 2000, PISA 2003 and TIMSS-2003 International Studies of Pupil Attainment (DfES Research Report 772). Slough: NFER, 2016
15
correlated at around 0.7 to 0.8 our results provide reasonably good approximations as to how
England’s PISA scores are likely to change for a given increase in GCSE grades. 12
A full explanation of the method used to simulate the distribution of GCSE scores in high performing countries is included in Annex B.
Results
Our results are presented as a series of graphs, comparing the GCSE grades of pupils in England to the estimated distribution in each of the comparator countries. These are provided for each of the three subject areas (mathematics, reading, and science).
Mathematics
The top performing PISA nations in mathematics are (in order): Singapore, Hong Kong, Macao, Taiwan, and Japan. Figure 1.2 below compares the distribution of GCSE grades in England with the highest performing nation in maths, Singapore. This illustrates that, to match Singapore’s
performance in PISA mathematics, England needs to reduce significantly its long tail of under achievement, while simultaneously increasing the proportion of pupils reaching the top grades. For instance, while England has around 22 percent of pupils achieving an A or A* in GCSE mathematics, we predict that the analogous figure in Singapore would be approximately 41 percent. Likewise, the proportion of pupils failing to achieve a grade C would need to fall by half, from 24 per cent down to 12 per cent. Together, this demonstrates that a pronounced change in GCSE mathematics
[image:15.595.82.512.468.742.2]performance is likely to be needed in order for England to catch up with the leading East Asian nations in mathematics.
Figure 1.2: Distribution of GCSE scores in mathematics in England and Singapore (simulated)
12 The correlation of PISA scores and GCSE grades relates to the author’s own calculations 8% 14% 23% 31% 13% 4% 3% 2% 2% 19%
22% 24% 23%
8% 2% 1% 1% 1% 0% 5% 10% 15% 20% 25% 30% 35%
A* A B C D E F G U
Pe rc e nt ag e o f pu pi ls
GCSE grade in mathematics
16
Figure 1.3 shows the simulated grade distribution in all five of the high performing countries. The table highlights the relatively low proportion of high performers in England and the large proportion of those failing to secure a grade C.
In the highest performing countries, 61 per cent of pupils secure the equivalent of an A*-B grade (compared to 45 per cent in England) in maths while only 14 per cent fail to secure the equivalent of a C grade or higher (compared to 24 per cent in England).
In order to match the average performance of the top five countries in maths, England needs to increase the number of top performing pupils (those securing an A*-B grade) by just over a third (from 45 per cent to 61 per cent) and almost halve the number of low performing pupils (those failing to secure a C grade or higher, from 24 per cent to 14 per cent).
[image:16.595.74.518.329.604.2]This means that around 96,000 additional pupils need to score an A*-B in maths and the number of low performing pupils also needs to fall by 60,000.13
Figure 1.3: Distribution percentage of pupils’ GCSE scores in mathematics in England and the top five
performing countries (simulated)
With the introduction of new numeric GCSE grades in 2017 for mathematics and English Language, with other subjects following suit in future years, it is important that we consider how these results translate into the new national metrics. Figure 1.4 illustrates the percentage of pupils who need to achieve new GCSE grades 1, 2 or 3 (broadly equivalent to the old alphabetic D, E, F and G grades), 4, 5 and 6 (equivalent to the old B and C grades) and 7, 8 and 9 (equivalent to A* and A). We have also
13By comparison, published statistics show that 231,000 pupils achieved an A*-B in GCSE (or equivalent)
mathematics in 2016 and 171,000 pupils achieved a D grade or lower (including missing or pending results): https://www.gov.uk/government/statistics/revised-gcse-and-equivalent-results-in-england-2015-to-2016.
Grade England Singapore Hong Kong Macao Taiwan Japan Top 5 Ave.
A* 8 19 16 14 16 13 16
A 14 22 20 20 20 19 20
B 23 24 26 26 23 25 25
Total percentage achieving A* - B grades
45 65 62 60 59 57 61
C 31 23 25 27 25 28 26
D 13 7 8 8 9 9 8
E 4 2 3 2 3 3 3
F 3 1 2 1 2 2 2
G 2 1 1 1 1 1 1
U 2 1 1 1 1 1 1
Total percentage achieving D - U grades
17
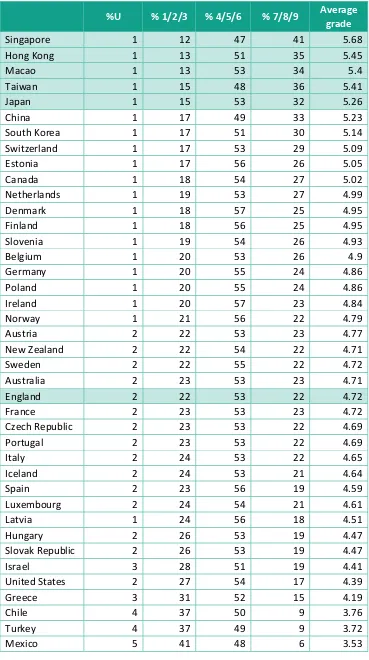
created an average numeric GCSE score for each country, following official guidance on the conversion between the old alphabetic and new numeric grades.14 Figure 1.4 suggests that over a third of pupils in England will need to achieve a grade of 7 or above to equal the standard of mathematics in the leading East Asian countries, while less than a sixth would fail to reach at least grade four.Put differently, the average mathematics grade in England will need to increase by around two-thirds of a GCSE grade – from 4.7 to 5.4 to match the standards set in these world leading countries.15
14This implies the following rules. U = 0; G = 1; F = 1.5; E = 2; D = 3; C = 4; B = 5.5; A = 7; A* = 8.5. (see Department for Education 2016: 3
18
Figure 1.4: The distribution of (simulated) GCSE grades in mathematics using the new numeric system
%U % 1/2/3 % 4/5/6 % 7/8/9 Average grade
Singapore 1 12 47 41 5.68
Hong Kong 1 13 51 35 5.45
Macao 1 13 53 34 5.4
Taiwan 1 15 48 36 5.41
Japan 1 15 53 32 5.26
China 1 17 49 33 5.23
South Korea 1 17 51 30 5.14
Switzerland 1 17 53 29 5.09
Estonia 1 17 56 26 5.05
Canada 1 18 54 27 5.02
Netherlands 1 19 53 27 4.99
Denmark 1 18 57 25 4.95
Finland 1 18 56 25 4.95
Slovenia 1 19 54 26 4.93
Belgium 1 20 53 26 4.9
Germany 1 20 55 24 4.86
Poland 1 20 55 24 4.86
Ireland 1 20 57 23 4.84
Norway 1 21 56 22 4.79
Austria 2 22 53 23 4.77
New Zealand 2 22 54 22 4.71
Sweden 2 22 55 22 4.72
Australia 2 23 53 23 4.71
England 2 22 53 22 4.72
France 2 23 53 23 4.72
Czech Republic 2 23 53 22 4.69
Portugal 2 23 53 22 4.69
Italy 2 24 53 22 4.65
Iceland 2 24 53 21 4.64
Spain 2 23 56 19 4.59
Luxembourg 2 24 54 21 4.61
Latvia 1 24 56 18 4.51
Hungary 2 26 53 19 4.47
Slovak Republic 2 26 53 19 4.47
Israel 3 28 51 19 4.41
United States 2 27 54 17 4.39
Greece 3 31 52 15 4.19
Chile 4 37 50 9 3.76
Turkey 4 37 49 9 3.72
19
English Language
We now turn to English Language GCSE outcomes. The top performing countries in this subject are: Singapore, Hong Kong, Canada, Finland and the Republic of Ireland.
[image:19.595.86.507.211.450.2]As Figure 1.5 shows, at most grades the difference between England and Singapore is smaller in reading than it is in mathematics.
Figure 1.5: Distribution of GCSE scores in reading in England and Singapore (simulated)
England’s relatively good performance in this subject is also demonstrated in Figure 1.6 (former alphabetic grading system) and Figure 1.7 (conversion into the new reformed numeric grades). We find that the improvement needed in English is slightly less than in maths.
In the highest performing countries, 52 per cent of pupils secure the equivalent of an A*-B grade (compared to 45 per cent in England) while only 19 per cent fail to secure the equivalent of a C grade or higher (compared to 26 per cent in England).
In order to match the average performance of the top five countries in reading, England needs to increase the number of top performing pupils (those securing an A*-B grade) by a just under a sixth (from 45 per cent to 52 per cent) and reduce the number of low performing pupils (those failing to secure a C grade or higher), by just over a quarter (from 26 per cent to 19 per cent).
This means that around 42,000 additional pupils would need to score an A*-B in English. The number of low performing pupils also needs to fall by 42,000.16
16By comparison, published statistics show that 219,000 pupils achieved an A*-B in GCSE English or equivalent and 158,000 pupils achieved a D grade or lower (including missed or pending results in GCSE English in 2016: https://www.gov.uk/government/statistics/revised-gcse-and-equivalent-results-in-england-2015-to-2016. 4% 15% 26% 29% 18% 5% 2% 1% 0% 6% 19% 29% 26% 14% 4% 1% 0% 0% 0% 5% 10% 15% 20% 25% 30% 35%
A* A B C D E F G U
Pe rc e nt ag e o f pu pi ls
GCSE grade in English
20
21
Figure 1.6: Distribution of percentage of pupils’ GCSE scores in reading in England and the top five
performing countries (simulated)
Grade England Singapore Hong
Kong Canada Finland
Republic of Ireland
Top 5 Ave.
A* 4 6 5 5 5 5 5
A 15 19 18 18 18 17 18
B 26 29 30 29 29 29 29
Total percentage achieving A* - B grades
45 54 53 52 52 51 52
C 29 26 29 28 28 29 28
D 18 13 14 14 14 15 14
E 5 4 4 4 4 4 4
F 2 1 1 1 1 1 1
G 1 0 0 0 0 0 0
U 0 0 0 0 0 0 0
Total percentage achieving D - U grades
22
Table 1.7 The distribution of (simulated) GCSE grades in English Language using the new numeric system
%U % 1/2/3 % 4/5/6 % 7/8/9 Average grade
Singapore 0 19 56 25 5.01
Hong Kong 0 19 58 23 4.93
Canada 0 20 57 23 4.94
Finland 0 20 57 23 4.94
Ireland 0 20 58 22 4.88
Estonia 0 21 58 21 4.85
South Korea 0 22 56 22 4.82
Japan 0 22 57 21 4.83
Norway 0 22 56 21 4.81
New Zealand 0 25 54 21 4.75
Germany 1 24 56 20 4.76
Macao 0 22 58 19 4.74
Poland 0 23 57 19 4.72
Slovenia 0 24 56 19 4.72
Netherlands 0 25 56 19 4.7
Australia 1 25 55 19 4.71
Sweden 0 25 55 19 4.67
Denmark 0 25 57 18 4.64
England 0 25 56 19 4.65
France 1 26 53 20 4.65
Belgium 0 25 55 19 4.66
Portugal 0 25 56 18 4.66
Taiwan 0 25 57 18 4.64
United States 1 26 55 19 4.64
Spain 1 25 57 18 4.62
China 1 27 54 19 4.6
Switzerland 1 26 56 18 4.58
Latvia 0 27 57 16 4.53
Czech Republic 1 28 54 17 4.53
Austria 1 28 55 17 4.53
Italy 1 27 56 17 4.54
Iceland 1 29 55 16 4.47
Luxembourg 1 29 53 17 4.49
Israel 1 30 52 17 4.48
Hungary 1 31 54 14 4.35
Greece 1 32 53 14 4.33
Chile 1 33 54 12 4.23
Slovak Republic 1 34 52 13 4.21
Turkey 1 40 51 8 3.93
23
Science
[image:23.595.72.562.210.440.2]The top five performing countries in this subject are Singapore, Japan, Estonia, Taiwan and Finland. The results for science are presented in Figure 1.8. As pupils can take a range of qualifications in science we consider outcomes in terms of points in those qualifications (where 8 is equivalent to an A*) rather than a grade in a single GCSE. The points measure performance within the qualifications taken which fulfil the science criteria of the English Baccalaureate.17
Figure 1.8: Distribution of percentage of pupils’ GCSE scores in science in England and the top five
performing countries (simulated)
EBacc Pillar points England Singapore Japan Estonia Taiwan Finland Top 5 Ave.
8 4 8 5 5 6 5 6
7.5 3 4 3 3 3 3 3
7 8 12 10 9 9 9 10
6.5 6 7 7 7 7 7 7
6.0 14 16 16 16 16 15 16
5.5 9 9 10 10 10 10 10
5 16 15 17 17 16 16 16
Total achieving 5
points or higher 60 71 68 67 67 65 68
4.5 8 7 8 8 8 8 8
Below 4.5 30 22 24 24 26 26 24
Total achieving 4.5
points or below 38 29 32 32 34 34 32
Consistent with previous research, we find that modest improvement is needed at the top end of the science achievement distribution in England.18 There needs to be an increase of over a quarter in
the proportion of pupils achieving seven EBacc pillar points and above in science for England to catch up with the highest performing countries. The proportion of pupils achieving 5 points (or a ‘strong pass’) or higher needs to increase by just over an eighth for England to match the average of the highest performing countries (an increase of 48,000 pupils).
The more pressing issue facing England in science is to improve the skills of the lowest achieving pupils. In particular, Figure 1.8 indicates that England needs to reduce the proportion of pupils within an EBacc science points score below 4.5 by just under a sixth (a reduction of around 36,000 pupils) to perform on a par with the top five countries in PISA science.
Attainment 8
As one of the main aggregate measures of school performance, it is worth considering what the results above might imply for an approximate Attainment 8 benchmark. Together, Figure 1.4 and
17 These are core and additional science, double award science and biology, chemistry and physics. 18 J. Jerrim and N. Shure, PISA 2015 National Report for England, 2016,
24
Figure 1.7 indicate that for England to be amongst the world’s top performers, the average grade in English will need to be 4.9. The average in mathematics needs to be 5.4.
This suggests that the benchmark for average attainment levels in England for English and
mathematics should be set at the new grade 5 (i.e. a ‘strongpass’). If we apply the same criteria to all other Attainment 8 subjects (i.e. that an average grade 5 becomes the aim for every subject) this then implies that the average Attainment 8 score that the system should be aiming for is 50 (under the new scoring criteria which is being introduced gradually from August 2017).19 Because we are
looking at the level of attainment that England would need to reach to be on a par with the average of the highest performing countries, we consider that a credible aim is for around 50 per cent of pupils to be achieving 50 points or more across Attainment 8 subjects.
25
Part 2: England’s performance against a world class benchmark
This section examines how well England is performing against our world class benchmark of 50 per cent of pupils to achieving 50 points or more across Attainment 8 subjects. As well as looking at England overall, we also look at different geographical areas, including: a breakdown of the 150 local authority areas;20 areas covered by the eight different Regional Schools Commissioners; and the 12
Opportunity Areas selected by the Department for Education for targeted intervention.
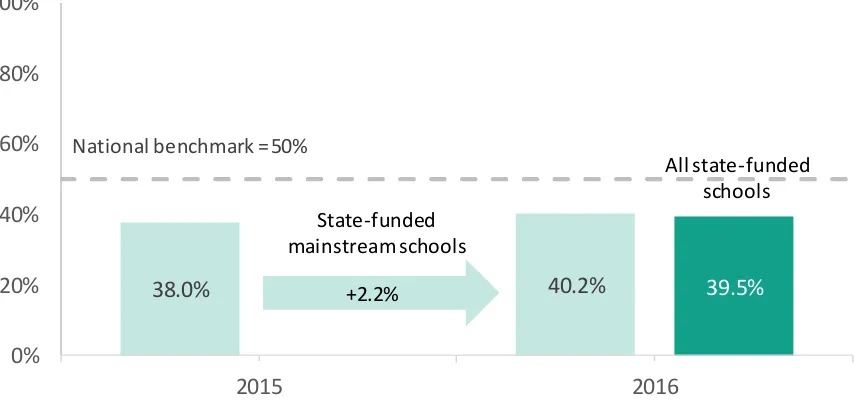
Overall performance in England
In 2016, 39.5 per cent of pupils achieved the equivalent of 50 points across Attainment 8 subjects. These figures are based on the attainment of pupils in all state-funded schools. We have previously reported the 2015 result as 38.0 per cent.21 This figure was for state-funded mainstream schools
[image:25.595.80.509.436.640.2]only. On a like-for-like basis the 2016 result represents a 2.2 percentage point increase on 2015. This analysis highlights that the percentage of pupils achieving our world class benchmark, using the new, higher threshold for a good pass, will be lower than those achieving the expected level under the previous system. Nearly 60 per cent of pupils were achieving the previous standard of five GCSEs at grades A*-C, including English and mathematics, and this falls to just under 40 per cent under the new system. In order to be on a par with the highest performing countries, the proportion of pupils achieving 50 plus points across Attainment 8 subjects needs to increase by just over 10 percentage points. This equates to around 60,000 additional pupils.
Figure 2.1: Percentage of secondary school pupils meeting our benchmark
20 Excludes the Isles of Scilly and City of London.
21 N. Perera and M. Treadaway ‘Education in England: Annual Report 2016’, April 2016.
38.0% 40.2% 39.5%
National benchmark = 50%
0% 20% 40% 60% 80% 100%
2015 2016
State-funded mainstream schools
+2.2%
26
Performance by local authority area
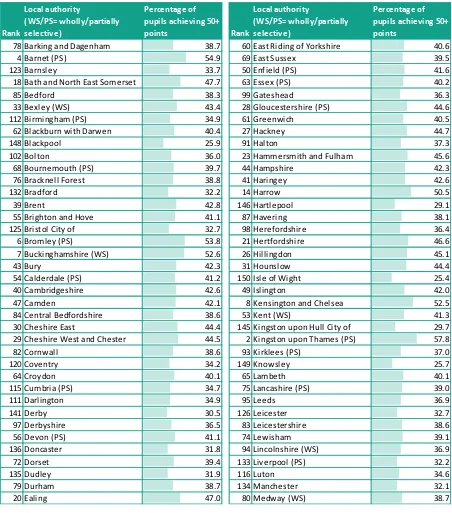
Figure 2.2 shows the proportion of pupils that achieved 50 points or more across Attainment 8 subjects by local authority area, and the map in Figure 2.3 plots relative performance between areas.22 We find that:
▪ There were 14 local authority areas that exceeded the benchmark of half of pupils achieving 50 points or more across Attainment 8 subjects;
▪ The highest performing local authority areas were Richmond-upon-Thames, Kingston-upon-Thames, and Wokingham;
▪ London continues to maintain its relatively high performance. Overall, 45 per cent of pupils in London met the world class benchmark. Nearly all local authority areas in London were relatively high performing and 9 of the 14 authorities that exceeded the benchmark of 50 per cent are in London.
▪ The majority of local authority areas (136) did not exceed the benchmark of half of pupils achieving 50 points or more across Attainment 8 subjects;
▪ Of those local authority areas that were below the benchmark, 12 authorities were within 5 percentage points of it;
▪ However, 8 authorities were more than 20 percentage points below the benchmark. In the lowest performing areas – Isle of Wight, Knowsley, Blackpool, and Nottingham – just over a quarter of pupils achieved 50 points or more across Attainment 8 subjects. In other words, the number of pupils achieving the benchmark in these lowest performing areas would need to double in order for them to meet our benchmark.
When interpreting these findings, it important to note that 36 local authorities include at least one selective school. Ten of these local authorities (Bexley, Buckinghamshire, Kent, Lincolnshire, Medway, Slough, Southend-on-Sea, Torbay, Trafford, and Sutton) are defined as ‘wholly-selective’,
while the remaining 26 are defined as ‘partially-selective’. The tables highlight those local authorities
which are either wholly or partially-selective.
27
Figure 2.2: Performance at the end of secondary school by local authority area - part 1 of 223
23Results from new GCSEs will use a scale of 1 to 9, with 9 being the top grade. 2020 will be the first year that
all results will be reported according to this new scale. Between 2017 and 2019, scores for legacy GCSEs will be based on an interim scale which converts alphabetical grades into numbers from 1 to 8.5. Our analysis is based on this interim points scale.
Rank
Local authority
(WS/PS= wholly/partially selective)
Percentage of pupils achieving 50+
points Rank
Local authority
(WS/PS= wholly/partially selective)
Percentage of pupils achieving 50+ points
78 Barking and Dagenham 38.7 60 East Riding of Yorkshire 40.6
4 Barnet (PS) 54.9 69 East Sussex 39.5
123 Barnsley 33.7 50 Enfield (PS) 41.6
18 Bath and North East Somerset 47.7 63 Essex (PS) 40.2
85 Bedford 38.3 99 Gateshead 36.3
33 Bexley (WS) 43.4 28 Gloucestershire (PS) 44.6
112 Birmingham (PS) 34.9 61 Greenwich 40.5
62 Blackburn with Darwen 40.4 27 Hackney 44.7
148 Blackpool 25.9 91 Halton 37.3
102 Bolton 36.0 23 Hammersmith and Fulham 45.6
68 Bournemouth (PS) 39.7 44 Hampshire 42.3
76 Bracknell Forest 38.8 41 Haringey 42.6
132 Bradford 32.2 14 Harrow 50.5
39 Brent 42.8 146 Hartlepool 29.1
55 Brighton and Hove 41.1 87 Havering 38.1
125 Bristol City of 32.7 98 Herefordshire 36.4
6 Bromley (PS) 53.8 21 Hertfordshire 46.6
7 Buckinghamshire (WS) 52.6 26 Hillingdon 45.1
43 Bury 42.3 31 Hounslow 44.4
54 Calderdale (PS) 41.2 150 Isle of Wight 25.4
40 Cambridgeshire 42.6 49 Islington 42.0
47 Camden 42.1 8 Kensington and Chelsea 52.5
84 Central Bedfordshire 38.6 53 Kent (WS) 41.3
30 Cheshire East 44.4 145 Kingston upon Hull City of 29.7
29 Cheshire West and Chester 44.5 2 Kingston upon Thames (PS) 57.8
82 Cornwall 38.6 93 Kirklees (PS) 37.0
120 Coventry 34.2 149 Knowsley 25.7
64 Croydon 40.1 65 Lambeth 40.1
115 Cumbria (PS) 34.7 75 Lancashire (PS) 39.0
111 Darlington 34.9 95 Leeds 36.9
141 Derby 30.5 126 Leicester 32.7
97 Derbyshire 36.5 83 Leicestershire 38.6
56 Devon (PS) 41.1 74 Lewisham 39.1
136 Doncaster 31.8 94 Lincolnshire (WS) 36.9
72 Dorset 39.4 133 Liverpool (PS) 32.2
135 Dudley 31.9 116 Luton 34.6
79 Durham 38.7 134 Manchester 32.1
28
Figure 2.2: Performance at the end of secondary school by local authority area - part 2 of 2
Rank
Local authority
(WS/PS= wholly/partially selective)
Percentage of pupils achieving 50+
points Rank
Local authority
(WS/PS= wholly/partially selective)
Percentage of pupils achieving 50+ points
12 Merton 51.2 129 Southampton 32.3
130 Middlesbrough 32.3 73 Southend-on-Sea (WS) 39.3
88 Milton Keynes 37.8 35 Southwark 43.4
119 Newcastle upon Tyne 34.3 101 St. Helens 36.2
58 Newham 41.0 89 Staffordshire 37.7
104 Norfolk 35.8 24 Stockport 45.5
128 North East Lincolnshire 32.4 66 Stockton-on-Tees 40.0
106 North Lincolnshire 35.6 140 Stoke-on-Trent (PS) 30.6
86 North Somerset 38.2 109 Suffolk 35.4
42 North Tyneside 42.5 127 Sunderland 32.6
45 North Yorkshire (PS) 42.3 16 Surrey 49.2
117 Northamptonshire 34.6 9 Sutton (WS) 52.4
108 Northumberland 35.5 121 Swindon 34.1
147 Nottingham 26.9 92 Tameside 37.1
59 Nottinghamshire 40.9 114 Telford and Wrekin (PS) 34.8
144 Oldham 29.8 110 Thurrock 35.0
52 Oxfordshire 41.4 90 Torbay (WS) 37.3
138 Peterborough 31.1 34 Tower Hamlets 43.4
137 Plymouth (PS) 31.7 5 Trafford (WS) 54.4
46 Poole (PS) 42.1 113 Wakefield 34.9
139 Portsmouth 30.6 131 Walsall (PS) 32.3
105 Reading (PS) 35.6 51 Waltham Forest 41.6
13 Redbridge (PS) 51.1 17 Wandsworth 49.2
122 Redcar and Cleveland 34.0 70 Warrington 39.4
1 Richmond upon Thames 62.3 32 Warwickshire (PS) 43.6
118 Rochdale 34.6 25 West Berkshire 45.2
107 Rotherham 35.6 57 West Sussex 41.1
11 Rutland 51.6 15 Westminster 49.9
143 Salford 29.8 77 Wigan 38.8
142 Sandwell 30.3 38 Wiltshire (PS) 42.8
71 Sefton 39.4 10 Windsor and Maidenhead 52.3
103 Sheffield 35.8 36 Wirral (PS) 43.0
81 Shropshire 38.7 3 Wokingham 55.0
37 Slough (WS) 42.9 124 Wolverhampton (PS) 33.2
22 Solihull 46.0 48 Worcestershire 42.0
67 Somerset 39.9 19 York 47.6
96 South Gloucestershire 36.8
29
Figure 2.3: Relative performance at the end of secondary school by local authority area
Bottom 25% attainment
Lower middle 25% attainment
Upper middle 25% attainment
Top 25% attainment
Performance by Regional Schools Commissioner region
In 2014 the Department for Education introduced eight Regional Schools Commissioners (RSCs), primarily as part of the academies and free schools programmes. The RSCs are split across eight regions, as shown in Figure 2.4 below.
30 Figure 2.4: Coverage of the RSCs
Bottom 25% attainment
Lower middle 25% attainment
Upper middle 25% attainment
Top 25% attainment
Figure 2.5 shows that there is variation between the regions in terms of performance against the world class benchmark. The North West London and South Central region had the highest level of secondary attainment, with 44.2 per cent of pupils achieving 50+ points in Attainment 8.
Attainments levels were lowest in the East Midlands & Humber, Lancashire & West Yorkshire, and North regions.24
[image:30.595.71.522.551.692.2]No region is currently meeting the benchmark of half of pupils achieving 50 or more points across their Attainment 8 subjects.
Figure 2.5: Performance at the end of secondary school by RSC region
24 For the purpose of the RSC regions London has been split across three different RSCs. Attainment levels across London as a whole are higher than any RSC region at 45 per cent).
Rank RSC region
Percentage of pupils achieving 50+ points in Attainment 8 (2017 points scale)
1 North West London & South Central 44.2
2 South London & South East 42.7
3 South West 39.7
4 North East London & East 39.5
5 West Midlands 37.3
6 North 37.1
7 Lancashire & West Yorkshire 36.9
31
Performance in Opportunity Areas
In October 2016, the Department for Education announced that it had identified 6 areas in the country which were ‘the most challenged when it comes to social mobility’. These areas were: West Somerset, Norwich, Blackpool, Scarborough, Derby, and Oldham. They were identified using the Social Mobility Index, published by the Social Mobility Commission in January 2016.25 The six
identified areas were not the six worst performing areas identified by the Commission – West Somerset and Norwich were the worst two, but the remaining four areas fell within the 9th and 30th worst performing areas under this measure.
In January 2017, the Secretary of State announced a further six Opportunity Areas: Bradford, Doncaster, Fenland & East Cambridgeshire,26 Hastings, Ipswich, and Stoke-on-Trent, along with a
[image:31.595.196.421.284.535.2]further investment of £3.5 million (£2m from the Education Endowment Foundation and £1.5m from the Department for Education) to establish a research school for each of the 12 Opportunity Areas. Figure 2.6: Locations of the Opportunity Areas
Figure 2.7 shows the attainment of pupils in each Opportunity Area. Attainment in Opportunity Areas is, on average, much lower than in other areas. In Opportunity Areas, 31.1 per cent of pupils achieved 50 plus points across their Attainment 8 subjects. This is nearly 9 percentage points lower than in non-Opportunity Areas.
This means that each opportunity area is well below the benchmark of half of pupils achieving 50 plus points. Blackpool, Fenland, Scarborough, Norwich, and Oldham would all need to see increases of over 20 percentage points in order to reach this benchmark.
25 See:
https://www.gov.uk/government/uploads/system/uploads/attachment_data/file/496103/Social_Mobility_Index.pdf.
32
Figure 2.7: Performance at the end of secondary school by Opportunity Area
Secondary schools: % of pupils achieving 50+ points in Attainment 8 (2017 points scale)
Pupils in all opportunity areas 31.1 East Cambridgeshire 41.1
West Somerset 33.5
Hastings 32.7
Bradford 32.2
Doncaster 31.8
Ipswich 31.7
Stoke-on-Trent UA 30.6
Derby UA 30.5
Oldham 29.8
Norwich 29.7
Scarborough 28.7
Fenland 28.5
Blackpool UA 25.9
33
Part 3: Performance in Wales, Scotland, and Northern Ireland
In this section, we look at how well pupils in Wales, Scotland, and Northern Ireland are performing compared to both England and the five leading countries we identify in Part 1 of this report. To make these comparisons, we use the same method as we do in Part 1 – we simulate GCSE attainment in each of the devolved nations based on their PISA scores. This approach enables us to make a consistent comparison, despite different qualification systems in each country.
We look first at the distribution of grades in each of the devolved nations, including England, in both mathematics and English.
We find that, in maths, England has a larger proportion of pupils securing the top grades (A*-B) than other UK countries. In English Language, 45 per cent of pupils in England and Northern Ireland scored an estimated A*-B – higher than in the other UK nations.
[image:33.595.72.428.368.527.2]Scotland’s performance is around the UK average in both maths and English Language, while Wales has a distinctly lower than average proportion of pupils achieving top grades and a long tail of underperformance in both subjects.
Figure 3.1: Distribution of GCSE grades in mathematics in the UK (simulated)
England Wales Scotland N. Ireland
A* 8 5 7 6
A 14 11 14 13
B 23 22 23 23
C 31 35 32 33
D 13 15 14 14
E 4 5 4 4
F 3 4 3 3
G 2 2 2 2
34
Figure 3.2: Distribution of GCSE grades in mathematics in the UK (simulated)
Figure 3.3: Distribution of GCSE grades in English Language in the UK (simulated)
England Wales Scotland N. Ireland
A* 4 3 3 3
A 15 12 14 15
B 26 25 26 27
C 29 32 30 30
D 18 20 19 17
E 5 6 5 5
F 2 2 2 1
G 1 1 1 0
[image:34.595.75.417.386.559.2]35
Figure 3.4: Distribution of GCSE grades in English Language in the UK (simulated)
We now turn to how well UK nations perform, compared to our five world leading countries in each of mathematics and English Language. As Figure 3.5 shows, Scotland and Northern Ireland are only just behind England in terms of the proportion of pupils achieving an A*-B (44 and 43 per cent respectively) in maths. Wales, however, is distinctly lower, at 38 per cent.
This means that, in order to compete with the highest performing countries, Scotland and
Northern Ireland would each need to improve the proportion of high attaining pupils in maths by over a third.
They would also need to reduce considerably the proportion of low attaining pupils (those failing to secure a grade C). The required reduction in Scotland and Northern Ireland is just under half (from 24 per cent to 14 per cent in each case).
36
Figure 3.5: Distribution of percentage of pupils’ GCSE scores in mathematics in the UK and the top five
performing countries (simulated)
Grade England Singapore Hong
Kong Macao Taiwan Japan Wales Scotland N. Ireland
Top 5 Ave.
A* 8 19 16 14 16 13 5 7 6 16
A 14 22 20 20 20 19 11 14 13 20
B 23 24 26 26 23 25 22 23 23 25
Total achieving A* - B grades
45 65 62 60 59 57 38 44 43 61
C 31 23 25 27 25 28 35 32 33 26
D 13 7 8 8 9 9 15 14 14 8
E 4 2 3 2 3 3 5 4 4 3
F 3 1 2 1 2 2 4 3 3 2
G 2 1 1 1 1 1 2 2 2 1
U 2 1 1 1 1 1 2 1 2 1
Total achieving D - U grades
24 12 15 13 16 16 28 24 24 14
In English Language, as Figure 3.4 shows, Northern Ireland and Scotland would need to improve the proportion of pupils securing a grade B or higher – by just under a sixth in Northern Ireland and by just over a fifth in Scotland. Wales, on the other hand, would need to improve by almost a third – from 40 per cent of pupils to 52 per cent.
37
Figure 3.4: Distribution of percentage of pupils’ GCSE scores in English Language in the UK and the top five
performing countries (simulated)
Grade England Singapore Hong
Kong Canada Finland
Republic of Ireland
Wales Scotland N. Ireland
Top 5 Ave
A* 4 6 5 5 5 5 3 3 3 5
A 15 19 18 18 18 17 12 14 15 18
B 26 29 30 29 29 29 25 26 27 29
Total achieving A* - B
45 54 53 52 52 51 40 43 45 52
C 29 26 29 28 28 29 32 30 30 28
D 18 13 14 14 14 15 20 19 17 14
E 5 4 4 4 4 4 6 5 5 4
F 2 1 1 1 1 1 2 2 1 1
G 1 0 0 0 0 0 1 1 0 0
U 0 0 0 0 0 0 1 1 0 0
Total achieving D - U grades
38
Part 4: Conclusions and policy implications
Over the last 25 years England has participated in a number of international studies of school pupils’
academic achievement.
Since the inception of PISA 17 years ago, England’s performance has remained at around average in mathematics and reading and just above average in science. As England’s performance has
stagnated (particularly in reading and science), countries from a variety of starting points and with a range of historical contexts have shown marked improvements in at least one of the assessment areas. The goal of this paper has been to consider how pupils’ achievement in national GCSE
examinations needs to improve in order for England to become a world leading education system, as judged by the PISA rankings.
These findings of course need to be interpreted in light of the limitations of this research. First, although PISA covers similar subject areas to GCSE examinations, they nevertheless measure young people’s skills in subtly different ways. This includes the extent to which they are curriculum versus
problem-solving focused, the amount of reading involved, the mode of the assessment (paper versus computer) and the importance of the results for young people and their schools. Each of these factors may potentially contribute to differences in PISA scores and GCSE grades, meaning that there is not a one-to-one correspondence between these different assessments. In other words, although an increase in national examination performance of the magnitude we suggest is needed should also lead to a marked improvement in PISA scores, the precise level of the change is subject to a degree of uncertainty. Nevertheless, the benchmarks we have identified would firmly place England’s education system amongst the world’s leading countries. Second, this paper has been about
standards, and the clear establishment of world leading benchmarks. It has not attempted to prescribe possible policy responses or interventions to enable policy makers, teachers, and
educators to reach these goals. Of course, understanding the factors and potential initiatives needed to reach the goals we have set continues to be an important line of related research. The Education Policy Institute will continue to analyse and explore these factors throughout its forthcoming programme of work, looking, for example, at the supply and quality of teachers and leaders, school admissions and the characteristics of under performing pupils.
Despite these limitations, we argue that the first step towards making real progress in improving
pupils’ educational achievement in key academic subjects is that ambitious yet realistic benchmarks need to be set. This paper has set the bar for the government, schools, teachers and young people
to achieve, in order for England’s education system to become ‘world class’. With the recent changes made to GCSE examinations, now is perhaps the optimum time for us to be considering what
39
Annex A: A comparison of the distribution of GCSE grades in
PISA compared to national figures
There are at least three reasons why the distribution of GCSE grades based upon the PISA sample may not exactly match national figures based upon population level data. These are:
1. Non-response. Although response rates to PISA are high, there is still some non-response at both the school and pupil level. Specifically, the non-response rate at the school level in England was 17 percent (8 percent once replacement schools are included in the figures), while 12 percent of pupils were absent from schools on the day of the test. Schools and pupils who do not participate tend to be lower achievers, which could in turn lead the distribution of GCSE grades observed for the PISA sample being higher than in the population.27
2. Non-linkage. As noted in section 2, GCSE data could not be linked for some pupils. This was particularly a problem for private school pupils (some of whom may have also taken international GCSEs rather than the English national qualification). In this paper, we have attempted to address this issue via multiple imputation of missing GCSE data. However, this could still lead to some discrepancy between PISA-sample based figures and official GCSE data.
3. Sampling error. PISA is a sample survey, meaning that there is some uncertainty (sampling error) surrounding the estimates. This random error could lead to the distribution of GCSE grades based upon the PISA sample to be either higher or lower than in national
examination data.
It is therefore important that some comparison is made between our estimates of the GCSE grade distribution based upon the PISA sample and official figures based upon population level data. This information is presented in Table A1. Figures refers to the cumulative percentage of pupils achieving
each grade. The ‘official’ estimates include school pupils only, and not those individuals who may
have taken these qualifications beyond the age of 16 (e.g. 17 and 18 year olds who were required to re-sit). Consistent with the discussion above (and the first point in particular), GCSE grades in the PISA sample tend to be slightly higher than in official population level statistics. For instance, around 76 percent of the PISA sample achieved at least a C grade in mathematics, compared to around 71 percent in official population estimates. The analogous figures for English Language are 74 and 71 percent respectively.
40
Table A1: The distribution of GCSE grades in PISA versus official population level statistics
Mathematics
PISA (without imputation)
PISA (with
imputation) Population
A* 8% 8% 7%
A 22% 23% 20%
B 44% 45% 40%
C 75% 76% 71%
D 89% 89% 85%
E 93% 93% 91%
Average grade 4.67 4.72 4.47
English
PISA (without imputation)
PISA (with
imputation) Population
A* 4% 4% 4%
A 18% 19% 18%
B 44% 45% 43%
C 74% 74% 71%
D 92% 92% 89%
E 97% 97% 96%
41
Annex B: Methodology
Our empirical methodology is based upon multiple imputation. The PISA-NPD file for England includes both pupils’ PISA test scores (plausible values) and their grades in GCSE examinations. We append to this the public use PISA data files for all other comparator countries. Hence we have a set of variables (PISA scores) which are observed for all participating pupils in all countries, and another set of variables (GCSE outcomes) which are only observed for pupils in England. The fact that GCSE grades are not observed in other countries is treated as a missing data problem, which we attempt to solve via multiple imputation. In other words, we predict how well children in other countries would have done had they taken GCSE exams, based upon how they performed on the PISA 2015 test. This prediction is estimated using the relationship between PISA scores and GCSE grades in England. One particular advantage of using multiple imputation by chained equations is that we are able to retain in our analysis even those pupils in England whose GCSE data could not be matched. Hence all 5,194 pupils who participated in PISA 2015 in England are included in our results.
The imputation model
Our imputation model applies multiple imputation by chained equations (MICE). A simple multi-nominal logistic regression model underpins the prediction of GCSE grades, and this is of the form:
log((𝜋𝑖𝑗) (𝜋𝑖𝐽)
) = 𝛼𝑗+ 𝛽𝑗. 𝑃𝐼𝑆𝐴𝑖
Where:
𝜋𝑖𝑗 = The probability of child i of obtaining GCSE grade j.
PISA = A vector of dummy variables referring to pupils PISA scores on the first plausible value.28
In our main specification, PISA scores are entered into the model in the form of dummy variables, based upon the level the pupil achieved in the PISA 2015 test.29 For instance, in mathematics, pupils
are divided into one of six groups based upon how they performed on the PISA test (see Jerrim and Shure 2016: Tables 4.3 and A1 for further details). By using dummy variables, we are allowing for potential nonlinearities between PISA levels and GCSE grades. The final pupil senate weight is applied, with the imputation models run separately for England in combination with each comparator country. We investigate the robustness of our results below, where a more complex imputation model is estimated, using gender, socio-economic status, and immigrant status (in addition to PISA scores) as the key covariates in the model underlying the prediction of GCSE grades. Moreover, we also investigate the robustness of our results to using raw PISA scores (percentage correct) rather than scaled scores (plausible values) as the key covariate in the imputation model.
Once the multiple imputation stage is complete, we follow Rubin’s Rules (Rubin 1987) to predict the
likely distribution of performance on GCSE examinations in each comparator country. From these
28We have experimented with using all ten plausible values and find very little change to our substantive results.