Image Processing for Traceability: A System
prototype for the Southern Rock Lobster (SRL)
Supply Chain
Son Anh VoDiscipline of ICT University of Tasmania Hobart TAS 7001, Australia
Joel Scanlan Discipline of ICT University of Tasmania Hobart TAS 7001, Australia
Paul Turner Discipline of ICT University of Tasmania Hobart TAS 7001, Australia
Luke Mirowski Discipline of ICT University of Tasmania Hobart TAS 7001, Australia [email protected]
Abstract— This paper describes how conventional image processing techniques can be applied to the grading of Southern Rock Lobsters (SRL) to produce a high quality data layer which could be an input into product traceability. The research is part of a broader investigation into designing a low-cost biometric identification solution for use along the entire lobster supply chain. In approaching the image processing for lobster grading a key consideration is to develop a system capable of using low cost consumer grade cameras readily available in mobile phones. The results confirm that by combining a number of common techniques in computer vision it is possible to capture and process a set of valuable attributes from sampled lobster image including color, length, weight, legs and sex. By combining this image profile with other pre-existing data on catch location and landing port each lobster can be verifiably tracked along the supply chain journey to markets in China. The image processing research results achieved in the laboratory show high accuracy in measuring lobster carapace length that is vital for weight conversion calculations. The results also demonstrate the capability to obtain reliable values for average colour, tail shape and number of legs on a lobster used in grading classifications. The findings are a major first step in the development of individual lobster biometric identification and will directly contribute to automating lobster grading in this valuable Australian fishery.
Keywords: Southern Rock Lobster, Supply chain, traceability, automated grading, image processing.
I. INTRODUCTION
The ability to track and trace the safety, quality and provenance of seafood from capture through to consumption has become increasingly important to consumers and regulators across national and international markets. For the Southern Rock Lobster (SRL) industry, addressing concerns related to marine bio-toxin [1], fish mortality during storing and transportation [2] and product substitution fraud all require improved traceability [3]. Traceability can be defined in a number of ways but fundamentally involves any processes, procedures or systems that support the generation of verifiable evidence about a product as it moves along its supply chain. Critically, the value of evidence that any traceability system produces is intimately related to the quality of data layer it relies on. However, for SRL much of the current data layer relies on paper based management and manual handling practices that are impeding the generation of high quality data and the levels of traceability that are increasingly required.
This research aims to directly improve SRL industry approaches to traceability by using image processing techniques as part of automated grading of lobsters. This research is, itself part of a broader investigation that aims to produce a low-cost biometric identification solution for use along the entire lobster supply chain. A key part of the feasibility of any biometric system will be the feasibility to verify individual lobsters from images taken at different points along the SRL supply chain. As a result, any system developed needs to be highly adaptable to the types of devices (e.g. mobile phones) that are anticipated to be used by industry stakeholders such as small businesses and end consumers in image capturing and verification of a lobster. This resulted in ‘low-cost’ consumer devices to be a major design constraint for developing the system proposed in this paper.
In parallel with questions related to product identification, SRL businesses are also interested in using traceability improvements to drive productivity. In this regard, it was identified that in lobster processing centres there is an opportunity to address both these issues by using image processing techniques to contribute to biometric identification and simultaneously aid in the automation of lobster grading. Grading involves the classification of lobsters by color, weight and quality as these factors directly impact on attainable market prices for different grades of lobster. This activity aims to maximize economic gains by meeting different market demands, and especially the Chinese market. The grading process is currently conducted manually using weigh-scales and manual handling which is slow and variable in their accuracy.
II. BACKGROUND
This section will present the literature review on image processing operation and its applications in food production. It then provides an overview about the SRL industry and traceability demands with a focus on data layer before moving to the methods.
A. Image Processing
1) Digial image and color spaces:
In digital imaging, each pixel contains one or multiple color channels that define its intensity (brightness) or color. The term ‘intensity’ is used in greyscale imaging. This is the color map where the brightness value of each pixel ranges from 0 (black) to 255 (white). Greyscale is especially prefered in image processing due to its easy coversion to a color map, less complexity and processing effiency [4]. The second type of image is binary where each pixel only has two color values: black or white. Moving to a color image, there are various models to represent the color value of each pixel CMYK, HSV, HSL, CIEXYZ, etc.
RGB is the most popular model used in image processing since most cameras, scanners, sensors and display equipment usually support input and output with red, green and blue channels [5]. However, the disvantages of the RGB model are the difficulty to visualise a color, the imposibility to evaluate the perceived differences between colors, and the sensitivity with changes of illumination [5].
Most other color spaces are converted from the RGB model to address certain applications. For instance, HSV (hue, saturation, value) is a human-orientated space. In this model, hue is understood as a color purity, saturation indicates the degree of colorfulness and value describes the brightness of color. Quevedo, et al. [6] emphasise that HSV together with CIELab color space are widely adopted in food related applications because these models effectively represent the colors naturally perceived by humans.
2) Image Processing Operation:
Image processing refers to a set of techniques used to enhance and analyse digital images captured by cameras/sensors to get meaningful outputs. There are several ways to interpret the operation in this area depending on specific problem situation. Egmont-Petersen, et al. [7] use
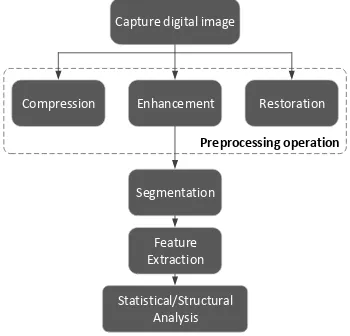
[image:2.612.93.268.60.228.2]the term of the ‘image process chain’ to demonstrate six main steps including preprocessing/filtering, data reduction/feature extraction, segmentation, object detection/recognition, image understanding and optimization. In the context of using image processing to detect plant leaf diseases, Gavhale and Gawande [8] present another six steps comprising RGB image acquisition, converting the input image into a color space, segmenting the components, obtaining the useful segments, computing the texture features, and configuring the neural networks for recognition. Research by Chitradevi and Srimathi [9] summarises this operation into five subsequent techniques including preprocessing, enhancement, segmentation, feature extraction and image classification. To simplify the interpretation in a general context, this paper refers to the model proposed by Bhabatosh [10] and re-illustrates it in Figure 1.
In the Figure 1 images after capturing under a digital format go through the preprocessing operation with multiple options such as compression, enhancement and restoration. These steps aim to increase the quality of the image before analysis as well as reducing the size for storage and better computation. Next, segmentation is the process that partitions the image to extract the region of interest (ROI). Thresholding seems to be the simplest method to support this step according to Pavlidis [11]. This technique simply replaces each pixel in an image by a black pixel if its intensity is lower than a fixed constant and vise-versa. In fact, there are open source tools to assist users to define this constant, leading to this option becoming simpler and more flexible. Beside thresholding, there are some other approaches in segmentation such as model based, edge based or region based. Following the segmentation outcome, feature extraction is used to extract desired features of ROI such as size, shape, color, texture, angle, etc. Ultimately, these features are taken into account for different purposes such as identification, recognition or classification.
3)Applications of Computer Vision in Food Production:
Image processing has proven to have useful applicability Capture digital image
Compression Enhancement Restoration
Segmentation
Feature Extraction
Statistical/Structural Analysis
Preprocessing operation
Fig 1 - Image Processing Operation
TABLE I-APPLICATIONS OF IMAGE PROCESSING IN FOOD PRODUCTION
Objectives Method Authors Year
Freshness assessment of gilthead sea bream
Measure color changes of eyes and gills,
Dowlati et al.
2013 Evaluate shrimp
product quality and value
Measure percentage of black spot on total body surface and shape
Lee et al. 2012
Detect deficiency, pest, disease or other harmful agent of vines
Measure of the amount of bad leaves using its color
Lloret et al.
2011
Real-time detect weed in crop under uncontrolled lighting
Use automatic threshold adjustment method in segmentation
Burgos et al.
2011
Estimation of body condition score of dairy cattle
Use cow’s body shape extracted from image for analysis
Giuseppe et al.
2011
Assess
the quality of pork meat
Use the lightness value of the color detected from meat slice surface
Chmiel et al.
2011
Automate strawberry grading system
Use shape, size and color features
Liming Xu and Yanchao Zhao
[image:2.612.312.543.487.722.2]in a range of fields. In the food production sector, problems relating to safety, quality and productivity have created a great potential area for researchers to seek solutions using computer vision. A survey of some typical studies summarised in Table I aims to highlight this ability. This review shows that the purposes of utilizing image analysis are very diverse. By looking at the approaches used in these studies, the opportunity to solve a similar problem of profiling individual fish in the SRL industry is completely achievable. The next section will introduce an overview of the SRL industry, traceability and the role of data layer in dealing with problems of food safety and quality.
B. Overview of the SRL Industry and Traceability
In 2014-15, the total commercial value contribution of the SRL industry was $240M [12]. China receives 90% of all lobsters caught [13] [14].
This figure is expected to grow as tariffs under the China Australia Free Trade Agreement (ChAFTA) reduce to zero from January 2019 for all Australian seafood exports [15]. However, the industry does need to address issues relating to food safety, quality and provenance through better traceability to mitigate business risks arising from bio-toxin outbreaks, fish mortality along the food chain and product substitution fraud.
Traceability has become an essential component of modern supply chain management systems to deal with food safety and quality issues. The way of defining this method is broad. It depends on the complexity of the food industry and objectives of supply chain operators. Chen [16] links this concept to the capability of stakeholders in tracking and tracing product movements through the supply chain in both directions: backward and forward. Choe, et al. [17] report that traceability is a system used to track individual products and ingredients through all phases and processes of the food chain. This interpretation is quite similar to the definition in the EU General Food Law in which food, feed, and ingredients are able to be traced through all stages of production, processing and distribution [18]. GS1, a world leading organization for traceability standards, refers this solution as “the ability to tracking forward the movement through specified stages of the extended supply chain and tracing backward the history, application or location of that which is under consideration” [19]. Due to the various approaches in defining the role of this system, Olsen and Borit [20] have analyzed over a hundred scientific studies relating to food traceability in order to explore the true definition. Their research concludes that choosing one over another will significantly affect its implementation in practice.
As such, any way of defining traceability as surveyed above, the data layer is the key to answering any question about product history. Because of this, the performance of traceability strongly relies on three main aspects of this component including depth, precision and breadth. Depth means how far along the chain both upstream and downstream where data are collected. Precision refers to the granularity of traceable items where data are collected such as containers, boxes or individual products. Breadth indicates the amount of data that is collected for each traceable item.
In reponse to the goals of the data aspects, Information Communication Technology (ICT) play a vital role to support identification, data capturing and sharing. For identification purposes, barcodes and Radio Frequency Identification (RFID) are the most popular methods. While barcodes require a line of sight reading mechanism and carry less information, RFID uses radio waves to automatically identify objects without line of sight and offers more space to hold data. However, these both traditional methods are challenged by a number of issues regarding cost and time buderns and potential counterfeit [21, 22]. To overcome these weaknesses in the SRL context, a low-cost biometric solution has been proposed by the authors. This research investigates the feasibility of identifying individual fish using image that potentially replaces the conventioanl tagging method.
In realtion to data capture, there are many advanced systems that facilitate this operation in the food chain such as wireless sensor networks, bio-sensors, electronic measurement equipment, GPS and electronic logbooks. Depending on needs and context, businesses will choose suitable solutions. In this paper, image processing is proposed as an innovative option to capture lobster attributes. The work in this research is a critical part of bio-metric identification goal that is reponsible to capture image and develop profile of each animal. Moving to data sharing, there are three main models for supply chain partners to approach traceability data including linear, centralised and distributed [23]. The next section will present steps in designing a system and software to support the grading task.
III. METHODS
The prototype system is was constructed through multiple phases. Initially, a number of field trips to lobster processors in Tasmania and South Australia were undertaken to investigate business demands, traceability practices and to take photos of the animals. These images were then analysed on a computer to examine how the valuable attributes of SRL could be extracted. A system design was then proposed to handle image capture and processing tasks with a consideration producing images consistent with low cost consumer devices. To profile individual lobsters for traceability goals, the method is structured in three main parts: system design, software design and image analysis.
Raspberry Pi V3 Relay
PiCam V2 USB Camera
Conveyor Belt Control Box
[image:3.612.334.519.552.700.2]Conveyor Belt
A. Prototype System Design
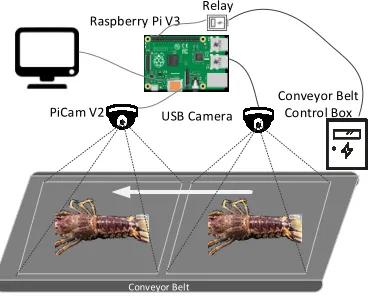
The prototype system developed in this research project is inspired by the common grading model used in fish factories. The design illustrated in Fig 2 includes four main components: conveyor belt, two cameras, processing board and relay. In this case, Pi Camera V2 (Picam) and a typical USB webcam are used to connect to a Raspberry Pi V3 board (Pi). By selecting this hardware, the authors aim to offer a low-cost solution to the industry and high adaptability to consumers’ cameras. Following the moving direction of the belt, the Picam is placed after the webcam and the height of both is set to 40cm from the conveyor surface. A relay is connected to the Pi to help control the conveyor running or stopping. The operation of the system is described as follows:
• When fish enter the conveyor belt, the webcam will detect the object. Two coordinates is set on the frames captured by this camera to create a detecting area. Until the object reaches this area, a signal is generated to stop the conveyor belt through the relay. Depending on the moving speed and distance to the second camera, the coordinates are calculated so the fish should perfectly sit in the covered area of the second camera when the conveyor pauses.
• At this time, Picam will capture image of the lobster at the highest solution and save it into a local directory. A copy version of the image is compressed to 600x450 resolution to serve the current analysis for better performance. After many tries in different scenarios, the authors decided to take photos of lobsters in the static condition to avoid any blurring of images in the processor to give the greatest quality for comparison to end consumers’ device. Right after the analysis is completed, a signal is generated to restart the conveyor belt for the next round.
• Based on the outcome of image analysis, the profile of each lobster is added to a csv log file corresponding to its ID number. At the same time, this result is also displayed on a screen for inspection purposes.
To produce high quality images for analysis, a number of assumptions were made. These elements will be considered
in the practical implementation at fish processors:
• Lobsters need to be placed in a straight position on the conveyor belt and the animals must have at least one back leg to support carapace measurement.
• All the legs of both sides should be expanded in a clear position to enable counting.
B. Software Design
The program is written in Python using OpenCV library and deployed on a Raspberry Pi V3 board. To support traceability, the software allows users to input information about the origin of fish before starting the image analysis. This information is taken from the processors’ management records when receiving fish from fishers. This step should be performed only one if the fish come from the same catch. Also at this stage, users enter the initial counting number so the software can create a correct ID number for each lobster. In this way, when the software stops for any reason then restarts, the ID number can be continuous. As such, with this operation, a profile of each lobster produced by the software will carry two groups of information as depicted in Table II.
To support color and sex identification when deploying at fish centers, the software is organised with an extra step to collect the actual values of each lobster during the scanning process. This dataset is then utilised to improve the system over time.
C. Image Processing
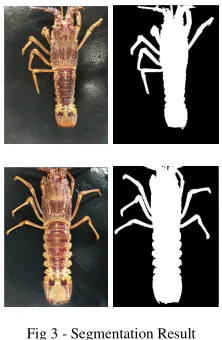
This section aims to demonstrate the methods used to extract required attributes of each lobster from the detected image. Based on a compressed version of the image, it is converted from RGB to HSV color space for the segmentation step. In this case, thresholding has proven to be highly accurate in separating the main object from the black background as shown in Figure 3. Therefore, it has been adopted in this research. To help measure threshold values in HSV, an open-source tool named range-detector provided on GitHub is used. From this result, techniques used in the feature extraction step are investigated for each of the following attributes.
1) Color group:
This attribute is determined from the average HSV color of the object. Due to Chinese market demands, lobsters are classified into two main groups: dark red (high market value) TABLE II-LOBSTER PROFILE ATTRIBUTES
Groups Attributes Source
Lobster Attributes
SRL ID
From Image Processing Image ID
Carapace length Weight Color Group Left Legs Right Legs Sex Date Time
Origin
Processor Name
Input from processor’s management sheets Tank ID
[image:4.612.373.484.52.222.2]Basket ID Fisher Name Fisher ID Arriving Date Catching Location Docket ID
[image:4.612.71.292.530.722.2]and pale red. In the HSV color space, hue significantly reflects the colorful difference between lobsters. Therefore, it is a critical value to determine which color group a lobster belongs to. To define a threshold in hue channel between two groups, the first experiment will need to collect the actual color of each fish based on the decision of staff associated with its average HSV. Then, a simple technique such as a histogram can be applied to hue values to identify an appropriate threshold.
2) Carapace length:
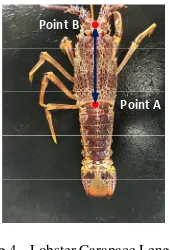
This is the important metric used by fishers for compliance purposes. In this case, measuring this attribute is the basis for calculating weight. Carapace length of SRL is determined from the middle point of two horns straight down to the edge before reaching the tail section as shown in Figure 4. As such, when the animal is placed in a straight position, determining points A and B will provide the information to measure the length.
Point A: refers to the location where the rear legs meet the carapace, where the abdomen ends and the tail begins. Thereby, this point can be positioned from both sides of the animal’s tail. The ROIs that covers enough the legs area is cut from the leftmost and rightmost points of the tail to the head with a moderate amount (120 pixels in this implementation). In these cuts, by moving from the bottom up, the first white pixel reached will signify the position of back leg. As discussed in the system design section, the animal must have at least one back leg to support this procedure. To reduce error rate in the detection, the cut regions are actually moved out from the peak values a small amount (10 pixels in this implementation). This action aims to ensure the first white pixel detected belongs to the back leg rather than the tail.
In fact, the animal’s tail can be moved from the straight position of the carapace. In this case, the tail is divided into two portions in which the upper part is more often stable than the lower one as shown in Figure 5. For this reason, finding leftmost and rightmost values of the upper tail part is prioritized. However, to obtain the upper tail part, the leftmost and rightmost points of the lower tail part still need to be identified and these values are much more accessible from the bottom of the object mask. Once the coordinate of Point A is located, only y value is retained while x value will be relied on Point B.
Point B is located between the two horns, and is the front most part of the head and is aligned with middle of the lobster. Based on the object mask, when an area is cut from Point A up to the top with an appropriate width as shown in Figure 5, Point B can be easily located by detecting the lowest black pixel. To obtain this area, while y1 and y2 are determined based on the top point of the mask and y value of Point A, x1 and x2 are calculated by coming in from the side of the animal a small amount to account for the tapering shape of the horns at the head of the animal. In this implementation 20 pixels in from the leftmost and rightmost points of the upper tail part.
Once Point A and B are defined, the length of carapace in terms of pixels can be simply measured. To calculate the actual length in mm, the diagram presented in Figure 6 is considered. From this diagram, a math formula can be formed as following:
Lobj = (Dcam x lobj) / Fcam
Note: Lobj: Actual object length (mm); Dcam: Camera
distance (mm); Fcam: Focal length (mm); lobj: Object length in
sensor (mm).
In this formula, while Dcam can be measured (from
camera to the surface of lobster carapace) and Fcam is
provided from camera specs, lobj needs a small calculation
from object length in pixels. Based on sensor length (mm) provided from camera specs, it is inferred as following:
lobj = lobjpixel x lsensor / Frpixel
Note:lobjpixel: Length of object (pixel); Frpixel: Length of
image frame (pixel); lsensor: length of sensor (mm).
As such, the particular formula applied in this case study with Picam V2 can be transformed as below:
Lobj = Dcam x (lobjpixel x 3.674 / 600) / 3.04
3) Weight:
This attribute is calculated based on carapace length using the research of McGarvey, et al. [24] relating to growth Point B
[image:5.612.141.226.52.177.2]Point A
Fig 4 - Lobster Carapace Length
Actual object length (mm)
Camera distance (mm)
Focal length (mm)
Len sensor
Object length in sensor (mm
[image:5.612.101.264.552.700.2]Parameters of the Pi camera V.2: - Focal length: 3.04 (mm) - Sensor size: 3.674 x 2.760 (mm)
Fig 6 - Camera and object model Cut Area
y1
y2 x1 x2
Upper part of the tail
Lower part of the tail
[image:5.612.326.543.603.697.2]rates at size of SRL. In this study, a formula converting from length to weight is introduced:
Weight (g) = 0.000483L3
Note:L is carapace length (mm).
4) Left and right legs:
Counting left and right legs is conducted based on the number of contours presented in specific ROIs. In particular, two cut areas used to find Point A in the Carapace Length section are reused as illustrated in Figure 8. With this result, the number of contours counted will represent the number of legs. As mentioned in the system design, one important condition of this step is the clear position of the legs to ensure high accurate results.
5) Sex:
Under the instruction of some professionals at fish processors, there are two features differentiating male and female SRL that can be observed from top down as shown in Figure 8.
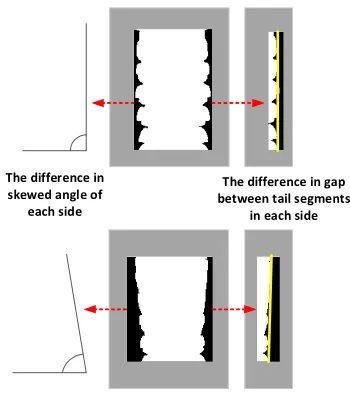
While the first feature (a little claw in the end of the back legs for females) is very hard to locate due to uncertain position of animal’s legs, the second one offers more possibility for measurement. Looking at the mask of the upper tail part, two metrics that might be metered are illustrated in Figure 9. The first point is the angle of each side of the tail. Since the tail is more tapered for male than female, the skewed angle of each side is found to be different between them. A suggestion to determine the skewed angle is the use of fit line’s coordinates in each half of the upper tail mask. The second point is the serration pattern along the left and right edges of the tail. To find the difference, a min bounding box of the upper tail part is defined where black pixels are counted. As the female has more gap between
segments than the male, it tends to have higher black/white pixels (serration) ratio in the min bounding box. Similarly with the approach in the color group section, these two types of information are collected together with actual sex determination in the first experiment. Then, an analysis using a histogram is conducted to explore thresholds in these value ranges.
IV. EXPERIMENTS AND RESULTS
Testing the system in a lab environment was necessary to minimise any risks ahead of field deployment. In this research, the initial step is conducted with Eastern Rock Lobster (ERL) shells with the aim of optimising basic parameters. Once the system is more matured, the deployment will be conducted in the field with live lobsters when the season comes back from November of this year.
[image:6.612.341.516.51.250.2]Due to the closing of the SRL season between April and November annually, this research presents only preliminary results of lab testing activity. Figure 10 shows a concept of the system associated with sample results displayed on a
[image:6.612.112.253.51.148.2]Fig 10 - A concept of the SRL grading system and displayed result Fig 7 - Left and right ROIs of lobster legs
The difference in skewed angle of
each side
The difference in gap between tail segments
in each side
Fig 9 - Differences in tail shape between female and male SRL
Female SRL
Feature 1: Little claw at the end of back legs
[image:6.612.346.503.498.704.2]Feature 2: Body shape Male SRL
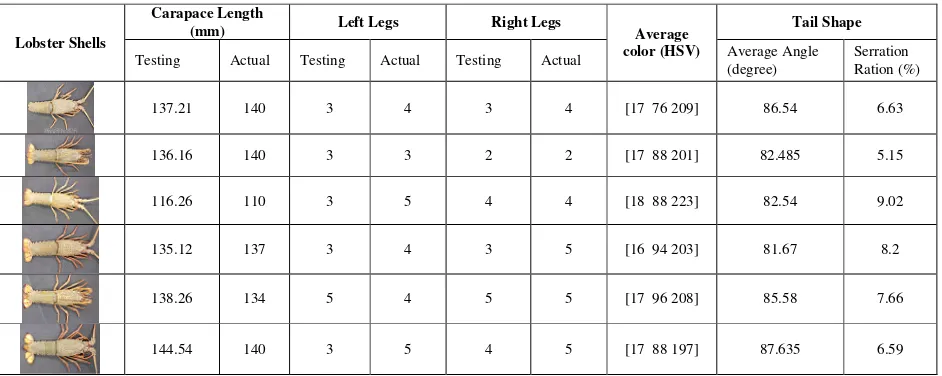
[image:6.612.105.265.538.702.2]monitor from the lobster shell’s image. In the lab experiment, the attributes of each lobster can be obtained as depicted in Table III. In these attributes, carapace length and legs number are validated with actual data at the test time. While the length measurement shows a high accurate result with the difference only ranging from 1.4% to 5.7%, legs detection achieves low accuracy. There are two main reasons for the issue of leg detection: (1) the legs are very close to each other that result in a single contour; (2) some legs are covered by the others or the animal’s head. Weight is not necessary to calculate in this case as it is simply converted from carapace length. However, the conversion formula will be validated in field experiments with more data. For average HSV, tail angle and serration ratio, the achieved result implies the ability to extract these values for color group and sex identification goals. To generate thresholds in these datasets, the need for a larger implementation scale is obvious. As such, although the measurement of the above metrics is only scoped with ERL shells, it signifies a significant step to move to the practical deployment of the system for the SRL species. The research will continue with a set of anticipated work as discussed in the next section.
V. DISCUSSION AND FURTHER WORK
The research, which is part of a PhD project, describes an novel solution to profile individual lobster to take steps to improving traceability along the supply chain. Compared with the conventional approaches by combining weight scale, calipers and visual observation, conversely the method presented in this research appears to be more efficient in terms of time and cost. The preliminary results achieved through laboratory testing have led to plans to conduct follow-up testing in the field with at lobster processors. In addition to this, the potential application of the research will lead to automation of the current manual grading with major efficiency and effectiveness gains anticipated.
In order to make the system more adaptable to the practical circumstances at fish processors, there are a number of challenges that it is anticipated will need to be overcome. Firstly, the position of lobsters on the conveyor belt is actually a challenge. For live lobsters, movement is unavoidable and this will lead to them deviating from the optimal straight position. Discussions with lobster experts
have indicated several potential ways forward including that in the first few seconds after being removed from water, the lobsters often stay still due to the sudden change of condition. Therefore, this duration can be a good opportunity for scanning process. There are also other suggestions on using boxes or belts designed with inverted triangles to hold the animals in the desired position. Such options are all currently being investigated for the practicality in terms of implementation in the processing factories.
The next challenge is the position of lobster legs to enable them to be counted. If they are overlapping or bent-up accurate counting can become very difficult. This issue needs to be evaluated during the practical experiments to understand how frequently it occurs. Moreover, an acceptable error rate for this attribute will be investigated and a suitable approach advocated.
Lighting/illumination is also a very important factor for consideration. Obviously the quality of an image in poor lighting conditions is always low. However, if more lights are supplied in an improper way, shadows will appear that may negatively impact the ability to do clear object detection. Fortunately, the lab tests conducted in this research are provided adequate light amount to produce good images. However, the operation at fish processors may face different circumstances. Therefore, in order to identify a good place to run the system in a fish factory, beside the elements of space and distance to fish tanks, light conditions are being taken into account.
VI. CONCLUSIONS
This research has demonstrated the robust capability of image processing techniques to support data capture activity. In the SRL industry, this tool can help to profile individual fish with a set of bio-metric characteristics and images in a cost effective way. These outcomes enable the first fundamental step of the ongoing bio-metric identification research to be established. Meanwhile, the work in this paper also highlights an opportunity to develop an automatic grading system at lobster processors for better performance.
Additionally, the preliminary results gained in the lab environment have formed an initial foundation for the researchers to better understand both achievements and TABLE III-TESTING RESULTS WITH LOBSTER SHELLS
Lobster Shells
Carapace Length
(mm) Left Legs Right Legs Average
color (HSV)
Tail Shape
Testing Actual Testing Actual Testing Actual Average Angle (degree)
Serration Ration (%)
137.21 140 3 4 3 4 [17 76 209] 86.54 6.63
136.16 140 3 3 2 2 [17 88 201] 82.485 5.15
116.26 110 3 5 4 4 [18 88 223] 82.54 9.02
135.12 137 3 4 3 5 [16 94 203] 81.67 8.2
138.26 134 5 4 5 5 [17 96 208] 85.58 7.66
[image:7.612.73.544.65.253.2]limitations of the research in an applied context. From here, further steps to improve the research in practical environments will take place by field trials.
REFERENCES
[1] Tasmanian Government. (2018, 17/07). Biotoxin
Fishery Events. Available:
http://dpipwe.tas.gov.au/sea-fishing- aquaculture/sustainable-fisheries-management/biotoxin-fishery-events
[2] C. J. Simon, T. C. Mendo, B. S. Green, and C. Gardner, "Predicting transport survival of brindle and red rock lobsters Jasus edwardsii using haemolymph biochemistry and behaviour traits,"
Comparative Biochemistry and Physiology Part A: Molecular & Integrative Physiology, vol. 201, pp. 101-109, 2016.
[3] A. Reilly, "Overview of food fraud in the fisheries sector," FAO Fisheries and Aquaculture Circular,
pp. I-21, 2018.
[4] M. Petrou and C. Petrou, Image processing: the fundamentals: John Wiley & Sons, 2010.
[5] S. J. Sangwine and R. E. Horne, The colour image processing handbook: Springer Science & Business Media, 2012.
[6] R. Quevedo, J. Aguilera, and F. Pedreschi, "Color of salmon fillets by computer vision and sensory panel," Food and Bioprocess Technology, vol. 3, pp. 637-643, 2010.
[7] M. Egmont-Petersen, D. de Ridder, and H. Handels, "Image processing with neural networks—a review," Pattern recognition, vol. 35, pp. 2279-2301, 2002.
[8] K. R. Gavhale and U. Gawande, "An overview of the research on plant leaves disease detection using image processing techniques," IOSR Journal of Computer Engineering (IOSR-JCE), vol. 16, pp. 10-16, 2014.
[9] B. Chitradevi and P. Srimathi, "An overview on image processing techniques," International Journal of Innovative Research in Computer, vol. 2, pp. 6466-6472, 2014.
[10] C. Bhabatosh, Digital image processing and analysis: PHI Learning Pvt. Ltd., 2011.
[11] T. Pavlidis, Algorithms for graphics and image processing: Springer Science & Business Media, 2012.
[12] ABARES. (2016). Australian fisheries and aquaculture statistics 2015. Available: http://data.daff.gov.au/data/warehouse/9aam/afstad 9aamd003/2015/AustFishAquacStats_2015_v1.0.0. pdf
[13] I. E. Putten, A. K. Farmery, B. S. Green, A. J. Hobday, L. Lim‐Camacho, A. Norman‐López, et al., "The environmental impact of two Australian rock lobster fishery supply chains under a changing climate," Journal of Industrial Ecology, 2015. [14] SARLAC, "South Australian Rock Lobster
Industry - About," 2017.
[15] A. G. Department of Foreign Affairs and Trade, "Fact sheet: Agriculture and Processed Food," ed, 2017.
[16] R.-Y. Chen, "Autonomous tracing system for backward design in food supply chain," Food Control, vol. 51, pp. 70-84, 2015.
[17] Y. C. Choe, J. Park, M. Chung, and J. Moon, "Effect of the food traceability system for building trust: Price premium and buying behavior,"
Information Systems Frontiers, vol. 11, pp. 167-179, 2009.
[18] European Commission Food. (2002). Food Law
General Requirements. Available:
https://ec.europa.eu/food/safety/general_food_law/ general_requirements_en
[19] GS1. (2018, 03/07). Traceability. Available:
https://www.gs1.org/public-policy/priorities/traceability
[20] P. Olsen and M. Borit, "How to define traceability," Trends in food science & technology,
vol. 29, pp. 142-150, 2013.
[21] Z. Bilal and K. Martin, "A Hierarchical Anti-Counterfeit Mechanism: Securing the Supply Chain Using RFIDs," in Foundations and Practice of Security, ed: Springer, 2014, pp. 291-305. [22] A. P. Mol, "Governing China's food quality
through transparency: a review," Food Control,
vol. 43, pp. 49-56, 2014.
[23] A. Kassahun, R. Hartog, T. Sadowski, H. Scholten, T. Bartram, S. Wolfert, et al., "Enabling chain-wide transparency in meat supply chains based on the EPCIS global standard and cloud-based services," Computers and electronics in agriculture, vol. 109, pp. 179-190, 2014.