CopyrightX)1977 AmericanSociety for Microbiology Printed inU.S.A.
T7-
and T3-Specific
RNA
Polymerases: Characterization and
Mapping of the In Vitro
Transcripts Read from T3 DNA
MIRIAM GOLOMB1 AND MICHAEL J. CHAMBERLIN*
Department of Biochemistry, University ofCalifornia, Berkeley, California 94720
Received for publication 25 June 1976
The late genetic region of the T3 bacteriophage genome is transcribed by a phage-specified RNA polymerase, the product of T3 gene 1. In vitro, purified T3
RNA polymerase acting with T3 DNA template synthesizes six major RNA
products, with molecular weights of 5.5 x 10⁶, 4.2 x 10⁶, 1.7 x 10⁶, 0.87 x 10⁶,
0.52 x 10⁶, and 0.23 x 10⁶. Theseare designated T3 RNA species I through VI, respectively. These RNAs are formed in equimolar amounts, with the exception of T3 species V, which is made in approximately twice this amount. T3 RNA
species I, II, and VI have been mapped by the use of terminally deleted
templates andarefoundtooriginate from promoters located at 56, 67, and 98%
genome length, respectively, and to share a common terminator at approxi-mately 100%. T3 species III, IV, and V must originate from the class III region of the T3 genome between 37.5 and 56%. Although the pattern of transcription by T3 RNA polymerase in vitro closely resembles that of the RNA polymerase from
therelatedphageT7,neitherpolymerase is able to use major promoter sites for theother enzyme at an appreciable rate.
Transcription of the T3 phage chromosome in lymerase recognizes only a single major pro-the bacterial cell proceeds in two stages, cor- motersite on T3 DNA. With T7 DNA, T7 po-responding to the "early" and "late" stages of lymeraseinitiatestranscriptionat sevenmajor infection (5, 13).Theearly region of the genome promoters, distributedthroughout the class III (leftmost 20% on the conventional genetic map) regionof the T7 genome (6). Thus both T3and istranscribed by the Escherichia coli RNA po- T7RNA polymerases are highly selective, yet lymerase (EC 2.7.7.6), whereas the remainder each appears to possess its own unique specific-ofthe chromosome is read by aphage-specific ity. This is remarkable since the two phages
RNApolymerase, theproductof gene 1 (5), as areclosely related andprobablyderived froma
has been shown for the related phage T7 (3). common ancestor (2, 4).
TheT3 RNApolymerase, asingle polypeptide We have continued our comparison of the of molecularweight 100,000, has been isolated transcriptional specificities of T7 and T3 RNA and found to require T3 DNA as a template for polymerases inthehope that this will serveas
RNAsynthesis. ThepurifiedT3 RNApolymer- aguidetoessential biochemicalandbiological
asetranscribed therstrandofT3 DNA exclu- features ofphage transcription maps. In
pre-sively, suggestingthatitishighlyselective in viousstudieswehave located four of themajor
vitro (5). promoter sites readby T7 RNApolymerase on
Although T3 RNA polymerase closely resem- theT7genomeand positioned a common termi-bles its T7 counterpartinstructureand in enzy- nationsignalforthesepromotersneartheright
maticproperties, the two phageenzymesdiffer end of the DNA. Weshowed, inaddition, that markedly in their response to different DNA the remaining major T7 promoters read by T7 templates. T7 RNA polymerasetranscribes T3 RNApolymerasewerealllocatedintheregion
DNA atapproximately 50% ofthe rate at which of the genome coding for so-called class III it transcribes T7 DNA, whereas T3 RNA po- proteins, from 40 to 100% on the T7 physical
lymerase transcribesT7 DNAatonly10to20% map (6). We report here the characterization of theratefound with T3 DNAastemplate(5). andpreliminarymapping of the majorinvitro
Thetranscription product ofT7RNApolymer- transcription products of T3 RNA polymerase ase with T3DNAtemplate has been shownto with T3 DNA.
beasingleRNAspeciescorresponding inmap
location to T7 species IIb; hence T7 RNA po- MATERIALS AND METHODS
1Presentaddress: Department ofBiochemistry,Wash- Procedures employed for the assay of T3 RNA ingtonUniversitySchool ofMedicine, St.Louis,MO 63110. polymerase and thein vitrosynthesis of T3 RNAare
743
on November 10, 2019 by guest
http://jvi.asm.org/
744 GOLOMB AND CHAMBERLIN J. VIROL.
those described previouslyfor T7 RNApolymerase the same technique to theiranalysis. T3 RNA (7), withthe substitution of T3DNAastemplateat a polymerase was allowed to transcribe T3 DNA
final concentrationof 0.3mM. (AllDNAconcentra- template in a standard reaction mixture
con-tions are here given in terms of concentration of
taining
a-[32P]CTP.
At 10min
after the addi-nucleotide.) T3 RNA polymerasewasisolated fromalate-exponential-phasecultureofDG156, aRNase
tion
ofenzyme, the reaction was stopped by the1- strain of E. coli B/r (H. Dougan, Ph.D. thesis addition of anequal volume of a solution con-Universityof California, Berkeley, 1973) grownina
taining
50 mMEDTA and 0.5% sodium dodecyl New Brunswick fermentor and harvested 15 min sulfate, and the mixturewasapplieddirectly to afterinfection by T3. Thephage RNApolymerase a1.75%acrylamide-0.5% agarose slab gel (Fig.waspurified by a modificationof the procedure of 1).
Maitra and Huang (9) and had a final specificactiv- Six major and three minor RNA bands are
ityof 91,000 U/mg. One unit ofT3 RNApolymerase discernible on autoradiograms of such gels,
leadsto a rate of incorporation ofCMPequalto 1 corresponding to at least six discrete size
nmol per h under standard assay conditions. The
purification of T7 RNA polymerase was as previ- classes of RNA. The apparent molecular ouslydescribed (3) its specific activity was 76,000 U! weights of these RNA species were determined
mg. ' , fromtheir
electrophoretic
mobilities relativetoTwo preparations ofE. coli exonuclease III were those ofthe in vitrotranscripts of T7 DNA with used; these were the generous gifts ofI.R. Lehman T7 RNA polymerase. Apparent molecular (Stanford University) and C. C. Richardson (Har- weights of the T7transcripts, relative to a
se-vard University). Aspergillus oryzae S1 nuclease ries of "standard" RNAs, have already been was thegift of P. Berg (Stanford University). Analy- established (7). Table 1 shows the size distribu-sis of RNAsby electrophoresis on acrylamide-aga- tion of the six major T3 in vitro
RNAs,
desig-rosegels (7) andconditions forS1digestionoftem- t . .
plate DNAs (6, 15) have been previously described. nated T3
transcrlpts
I to VIinorder of decreas-Exonuclease III digestions (8) were performed at ing molecular weight. Three quite long (and 37°C, in a reaction mixture containing50 mM Tris- presumably polycistronic) and three compara-hydrochloride buffer (pH 8.0), 0.5mM MgCl2, 10mM tively short RNAs span a molecular weight 2-mercaptoethanol, 1.5 mM T3 DNA, and 20 to 200U rangefrom 5.5 x 10⁶ to 2.2 x 10⁵.ofexonuclease IIIper ml. The extent ofdigestion This size distribution is highly reminiscent of wasmonitored by following the release of acid-solu- that of the in vitro transcripts of T7 DNA with
ble nucleotides, as measured by UVabsorption at T7 RNApolymerase,shown inTable1for
com-260 nm (6).
arison.
Eachmajor
T3transcri
tcan
becorre-The nomenclature employed previously to de- latith
ma
transcripthang e rorre-scribe the transcription units read by T7 RNA po- lated with a T7 transcript having a roughly lymerase has been modified for use with the T3 and similar molecular weight, although there are heterologous phage systems. The major RNAs tran- significant differences in detail (the apparentscribed by T7 or T3 RNA polymerases from their molecular weight of T3 transcript V, for in-homologoustemplates are designated by Romannu- stance, is significantly greater than that of T7 merals inorder of decreasing size (7). The template transcript V).
fromwhich the transcript is read issignified by the Assuming that the apparent molecular designation "T3 transcript" or "T3 species" (e.g., "T3 weights for T3 RNAs correspond
to,
or arepro-transcriptIII"). Transcripts read by T7polymerase . t .
from T3 DNAor by T3polymerase from T7DNA are
portional
tolarueRrNA
chain
lengths, one can designated by the Roman numeral correspondingto calculate the molar ratios of the six T3 RNAs that ofthehomologous T3 or T7 transcript, andthe made in a standard 10-mm reaction from the natureof thepolymerase is specified, i.e., "T3 tran- relative mass of RNA in each size class (7)script IIIb read by T7polymerase." The nomencla- (Table 1). Here significant differences emerge ture can be extended to additional (minor) tran- between T3 and T7transcriptionalpatterns.T7 scripts bydesignating these with Roman numerals RNA polymerase synthesizes equimolar beginning with VII. amounts of each of the six T7 RNAs, with the
exception of T7 species III, which has been RESULTS shown to be a mixture oftwo
transcripts,
T7transcript HIa and T7 transcript IIIb, which
RNAs madeinvitro by T3 RNA polymerase arise from physically distinct transcription
with T3 DNA template. Previous work has units(6). T3 RNA polymerase, in contrast,
syn-shown that the sevenmajor RNAs transcribed thesizes only one molarequivalent of T3 species
byT7RNApolymerasewith T7 DNA template III, the RNA species corresponding in molecu-can readily be resolved by electrophoresis on larweight to T7 species III, which implies that
dilute polyacrylamide-agarosegels (7, 11). An- at least one T7transcription unit (IIIaorIIIb) ticipating that thetranscriptionproductsof T3 has no counterpart read by T3 polymerase on DNA with T3 RNA polymerase would be a the T3 genome. A furtherdifference is that T3
similarly complexmixture of RNAs, we applied RNApolymerase transcribes two molar
on November 10, 2019 by guest
http://jvi.asm.org/
k,-~ 4 TABLE 1. Molecularweightsand molar ratiosof
a
b'
UmajorT3 RNA and T7 RNApolymerasetranscriptsformedin vitroa
Phage Species Mol wt (x10-6) Molar ratio
T3 I 5.5 ± 0.5 1.0
II 4.2 ± 0.3 1.0
III 1.7 ± 0.2 0.9
4 IV 0.87 ± 0.02 0.8
V 0.52 0.02 1.9
VI 0.23 ± 0.01 0.8
T7 I 5.5 ± 0.5 1.1
II 4.5 ± 0.5 1.0
III 2.0 ± 0.2 1.7
IV 0.84 ± 0.04 1.2
V 0.44 ± 0.04 0.9
VI 0.22 ± 0.02 1.1
aApparent molecular weights of T3 RNAs were
s r & j
^obtained
from electrophoretic mobilities on 1.75%_
[l wpolyacrylamide-0.5%agarosegelsrelativetothe sixT7 RNAs formed in vitro with T7 DNA template (7). Molarratios relative to T3 species II were calculated from the relative amounts of a [32P]CTP incorpo-rated into each species during a 10-min synthetic reaction and their respective molecular weights. Molecular weights and molar ratios of T7 in vitro
mU
*RNAs, shown for comparison, are taken fromGo-lomb and Chamberlin (7).
lents of T3 species V. Hypothetical
arrange-mentsgiving risetosuchadoublet are: (i) two
geographically distincttranscriptionunits
hav-ing
thesamelength (analogous
toT7transcrip-tion units IIIa and
IlIb),
(ii) apair
ofclosely
overlapping
transcription
units withadjacent
promoters andashared terminator, and (iii) a single transcription unit with apromoterthat is
employed
twice asefficiently
as the othermajorT3 promoters.
Besides the six major RNA species, T3 RNA
polymerase transcribes three minorRNA spe-cies, ofapparent molecular weights 10 x 106, 8.0 x 10⁶, and 6.5 x 10⁶,whicharetentatively
designated T3 species VII, VIII, and IX,
respec-tively. Like their T7 counterparts (M. Golomb,
Ph.D. thesis, University of California,
Berke-ley, 1974; 6), these minor species are tentatively
interpreted as "read-through" derivatives of
majortranscripts (seebelow).
FIG. 1. RNAsformedinvitrobyT3 and T7 RNA polymerases with T3 and T7DNA templates. The RNA made ina10-min syntheticreaction byT3 or
T7 RNA polymerasewasresolvedbyelectrophoresis
on a1.75%polyacrylamide-0.5% agarose gel.
Auto-radiographs show: transcriptionof T3DNAwith(a) T7RNApolymerase and (b) T3 RNA polymerase; transcriptionof T7 DNA with (c) T7 RNA polymer-aseand(d)T3 RNApolymerase. Tracks(b), (c), and (d)arefrom thesamegel; track (a), shown for
com-parison, isfromaseparategel.
on November 10, 2019 by guest
http://jvi.asm.org/
[image:3.501.251.446.94.234.2]746 GOLOMB AND CHAMBERLIN J. VIROL.
RNAs transcribed in vitro by T3 RNA po- overlapping transcription units that terminate lymerase with T7 DNA template. Under our near the ends of the genome, as with T7. We standard reaction conditions, T7 RNA polymer- therefore carried out a series of limited (2%
asetranscribes T3 DNAastemplateatabout 50 genomelength) and one of more extensive (up
to 70% of the rate at which it transcribes T7 to40%)terminal excisions on T3 DNA tolocate DNAastemplate; theproductof this transcrip- transcription units terminating neartheright
tion is a single RNA species arising from a end of the chromosome.Transcriptionfromthe
transcription unitcongruentwith T7 transcript heterologous (T7RNApolymerase) promoter at IlIb (84 to 100% onthe T7 chromosome) (6, 7). 84% genome length on T3 DNA served as an
T3RNApolymerase transcribes T7 DNA with internal control for thisprocedure.
considerably lower efficiency (5), orabout 10to Limited excision of T3 DNAtemplate and
20% of the rate with T3 DNA under standard mapping of species IV. E. coli exonuclease III conditions. It was therefore of interest to find wasemployedto remove shortsegments (from
outwhich, ifany, transcription signals onthe 0.28% to 1.4%genomelength)from the 3'-OH-T7chromosome arerecognizedby T3 RNApo- terminatedends of T3 DNA, and the resulting lymerase. Figure 1 shows the products of this 5'-P-terminated single-stranded "tails" were
heterologous reaction, resolved on a 1.75% cleaved withsingle-strand-specific Si nuclease acrylamide-0.5% agarose gel. Surprisingly, from Aspergillusorwyzae.Theresulting series of each of the major T7 RNA speciestranscribed truncated DNAswastranscribed with T3 RNA by T7 RNA polymerase appears to be made polymerase, and the RNA products were
re-with T3 polymerase. The relative molar solved by gel electrophoresis. When less than
amountsof eacharesimilartothose found with 1.5%ofthe T3genomeisexcised, T3 species VI T7 RNA polymerase (7). Several conclusions is the only transcript synthesized by T3 RNA
maybe drawnfromthisexperiment. (i) T3 RNA polymerase to besignificantly altered. The
ex-polymerase uses all of the T7 promoters, but tentofremoval of T3 templatestrandDNAand
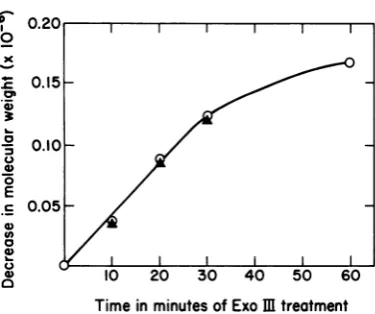
very poorly. (ii) T3 RNA polymerase uses T7 the decreaseinmolecularweight of T3 species terminators efficiently. This may be inferred VIareplottedas afunctionof incubation time from theappearanceof RNA bandsattheposi- with exonuclease III in Fig. 2. As increasing
tionsof T7 species IV and V; if theinternal T7 amountsof DNAareremoved from the T3
tem-terminatorwerenotrecognized,or werepoorly plate, T3 species VI isprogressively shortened. recognized, these products wouldnotbefound. From thisobservation, andthefact thatall T3 (iii) Asshownpreviously, T7RNApolymerase RNAs are transcribed rightward (5), one can
recognizes a strong promoter at map position conclude that theterminator for T3 speciesVI
84% on the T3 genome (6, 7). However, no mustoccur at orvery neartheright end of the
equivalentstrongpromoterfor T3 RNApolym- T3 genome. Furthermore, since the extent of
erase existsatthis location on the T7 genome RNA shortening equals theextent of
shorten-(seebelow). ingofDNAtemplate strandtowithinan
esti-It should be noted that the poorly utilized mated error of 0.2% genome length, one can promoters readby T3 RNA polymerase on T7 locate the transcription unit for T3 species VI DNAarethe first clear demonstration ofaclass moreprecisely thanhas beenpreviously estab-of "weakpromoters"readbythephage polym- lished for T7 species VI (6). The termination
erases. The existence of such weakpromoters signalfor T3 speciesVI mustlie within0.2%, or
was previously suggested to account for the 80 nucleotides, of the right end of the T3
ge-failure to find major transcripts that contain nome. Fromthe molecular weight of T3species
classIIgeneticsequences amongtheseven ma- VIand its estimated termination at 100% one
jor transcripts formedby T7 RNA polymerase can position its promoter at 98.2%. Thus the
with T7DNA, eventhoughclassII message is promotergoverning T3 transcript VI issituated transcribed invitro (Golomb, Ph.D. thesis; 10, to the right of gene 19 and must overlap the
12). region ofterminal redundancy (4).
Mapping ofT3 invitro transcriptionunits. Transcription of extensively shortened T3
The obvious similarities between thetranscrip- RNAs.AreductioninRNAmolecular weight of
tionalpatternsforT3and T7 RNApolymerase less than 105, although sufficient to map T3
with theirhomologoustemplate encouragedus speciesVI, isdifficulttodetect in the two larg-toattempt to maptheT3 in vitrotranscription estRNAspecies (molecular weights, 5.5 x 10⁶ unitsby the technique usedtomapfour of the and 4.5 x 10⁶,respectively) withpresent meth-sevenmajorT7latetranscriptionunits(6).This ods of resolution. Eventhe failure to detect a
method, the analysis of RNAs made in vitro shortening ofT3species III with short template
from enzymatically shortened templates, is excision does not rule out a terminal location
particularly well adapted to the mapping of for this transcription unit (for instance, one
on November 10, 2019 by guest
http://jvi.asm.org/
° 0.20C immediately to the left of thepromoter for T3
o species VI). Hence, more extensively deleted
x o
templates
mustbe used to locate these RNAsE 0.15
unambiguously.
With extensivedigestion
oftemplate,
alimiting
factorintheinterpretation
of mapping data is the synchrony of attack by
,0.l0 _ / _ exonuclease
Ill.
Aslight
broadening
inthedis-tribution of extent of DNA removed can lead to
E / adramatic loss in resolution of the
correspond-.= 0.05 _ / _
ing
RNAtranscript
ongels
(6).To obviatethisproblem, very high molecular ratios of
exonu-c I I I I clease III to DNA mustbe used (unpublished
oY102 20t 30 40 50 60l
~~~~~observations).
osrain)cl0056Using conditions that favor synchronous
at-Time in minutes of Exo m treatment tackonDNA molecules (6),regions of T3DNA varying in extent from 3 to 38% of the 3'-OH-FIG. 2. Decrease in molecular weight of template
terminated
strand of T3 DNA weresuccessively strand T3 DNA and T3 species VI RNA as a function removed with exonuclease III, and theresult-of exonucleolytic digestion result-oftemplate. Exonuclease ing
YPtexonu
cleaved
th slIIIdigestion (8) wasperformedat37°Cin a reaction
ng
5'-P-terminated tails were cleaved with Simixture (4.0 ml total volume) containing 50 mM nuclease. These extensively truncated DNAs
Tris-hydrochloride buffer(pH 8.0), 0.5 mM MgCl2, servedastemplates for the in vitrosynthesis of
10 mM 2-mercaptoethanol, 1.5 mM T3 DNA, and 20 RNAsby T3 RNApolymerase.
Mg
of exonuclease III per ml. After the incubation To estimatethe synchronyof excision, theseperiods indicated, 0.9-ml portions were combined DNAs were first transcribed with T7 RNA
po-with 0.1 mlof concentratedSi buffer (300 mM so- lymerase, which produces a single, well-defined dium acetate buffer fpH 4.61-5 mM ZnCl2-2 M RNA
species,
T3transcriptlHb,
previously as-NaCl), 1.6 pg ofSi enzyme was added, and thesigned
to atranscription
unit read from 83 to mixture wasincubatedat50°C for40 min. Release of 97.5%onthe T3
genome.The molecularweight
acid-soluble nucleotides was measured by adding
of
this
RNA is 2.0 x 10⁶, and itdecreases in
0.1-mlsamples oftheexonucleaseIIIorSi digestion
mixture to2ml of3.5%perchloric acid at0°C.After proportionto theterminal deletion of the
tem-10min, the mixtures werecentrifuged, and the ab- plate. With extensive shortening oftemplate, sorbanceof the supernatantwas read at 260 nm in a the heterogeneity in length of this product in-Zeissspectrophotometer. After digestion with Si nu- creases, providingasensitive measure of lossof clease,thesampleswere twice extracted with phenol synchrony during thecourse of exonucleaseIII andthendialyzed
against
asolutioncontaining
0.05digestion
(6).Figure
3showsapolyacrylamide-MNaCl,0.01 MTris,and 10-4 M EDTA. Untreated agrsgeofteRAmdbyTRN po
and
exonucleolytically
shortened T3 DNAswereused agarose gel ofthe RNA made by T7 RNA po-astemplatesina 10-minsynthetic transcriptionreac- lymerase With this series ofterminally deletedtion(7) with a-[32P]CTPaslabeled substrate. Each T3templates. As previouslyreported, the
sin-mixture(0.1 ml total volume) contained 70 U of T3 gle transcriptincreases in electrophoretic
mo-RNApolymerase per ml and 0.3 mMDNA template. bilityand hence decreasesin apparent molecu-Thereaction wasterminated by the addition of 0.2% lar weight with increasing removal of template sodiumdodecyl sulfateand 20 mMEDTA, and por- strand DNA. T3 transcript
IIb
read by T7 po-tions were subjected to electrophoresis in a 1.75%lymerase
is no longer detectable on a 1.75% polyacrylamide-0.5% agarose gel (7). After autora- polyacrylamide-0.5% agarose gel after 60min
diography,theapparent molecular weight of T3 spe- ofincubation of the T3 templatewith
exonucle-cies VI transcribed from each template was
deter-minedfromits mobility relative to a set of standard ase III. At this
podit,
2.04 x 10⁶ daltons of RNAs(RNAs madein vitroby T7 RNApolymerase template strand DNA, including the entirere-withT7 DNA template). Decrease in DNA template gion coding for this RNA, has been degraded strand molecular weight (0) is one-fourth the total (see below). However, during the period of
amountofDNAmadeacidsoluble by digestion with digestion during which T3 transcriptiIlbis still
exonucleaseIII andSi nuclease and isexpressed in discernible on gels (30 min, or 1.08 x 10⁶
dal-molecular weight values. The relative error of this tons of template strand DNA removed), the
determination isestimated at ±+10%, corresponding width of the band corresponding to this RNA
to 016%genome length. Decrease in T3 species VI increases by at most
10%,
indicating a maxi-RNA molecularweight (A)wascalculatedfrom the i.apparent decrease in molecular weight of this RNA mum
ncrease
in heterogeneity of template species, determined from the increase in its mobility strand length of less than 0.2%. This is better duringelectrophoresis. The relative error of this de- synchrony than previously achieved with this termination is estimated at +3%, corresponding to technique (6) and justifies the use of this0.05%genome length. method to map thelonger RNAs.
on November 10, 2019 by guest
http://jvi.asm.org/
[image:5.501.56.244.59.216.2]748 GOLOMB AND CHAMBERLIN J. VIROL.
i
- (In{j
Fig. 3,!
tracksatof[see alsoFig. 5],asig-nificant proportion ofradioactivelylabeled ma-terial remainsatthe top of thegel. This
mater-ial, which has not been further characterized, has been previously observed inthe transcrip-tion products of DNA templates treated with exonuclease III [6]. As it isespeciallyprominent
0 vi i whenSitreatmentisomitted from the
prepara-tionoftemplate [unpublished observations], it
maybe RNA-DNA
hybrid
ornonspecific
aggre-gates formed with incompletely degraded 5'-OH-terminated
strands.)
The shortening of T3 transcript IIIbreadby T7 polymerase is plotted as a function of the
extentof exonuclease treatmentin
Fig.
4. It isapparent
that RNAshortening
for thisspecies
equals
DNAshortening during
the first 30minof incubation. We had previously mapped the
terminator for this RNA at 98.5% genome length. However, taking into accountthe
esti-matederror inmeasuringthe amountof DNA
removed, these results suggest that the
termi-.j_
natorfor thisspecies
lies within 0.5% genome length, or about 200 nucleotides, from the right-handedend of the T3 genome. Since this termi-nator must be identical to that governing T3transcript VI,
the trueposition
is within 80nucleotides ofthe rightend of the genome.The
promoterfor T3 speciesIEDbread by T7 polym-erase can nowbe positioned more accuratelyat
approximately 84.1% genome length, or
slightly to the right of our previous estimate
(83%).
FIG. 3. Electrophoretic analysis of RNA made in vitroby T7RNA polymerase with exonucleolytically
shortenedT3 DNA template. Exonuclease III diges-tionwasperformed and assayed as described in the
legendtoFig.2. The reaction mixture (6.0 ml) con-tained1.53mMT3 DNA and 200 U of exonuclease III per ml.After the incubation periods indicated, 0.9-mlportionswerecombined with0.1ml ofconcen-trated Si buffer,1.6 pgofSi nuclease wasadded, andthemixturewas incubated at 50°C for 40 min. Thesamples wereextractedthree times withphenol and dialyzed. Untreated and truncated T3 DNAs
wereusedastemplatein a10-min synthetic reaction (0.1 ml) with a-[32P]CTP (final concentration, 0.4
mM)aslabeled substrate. Samples were mixed with 0.25% sodium dodecyl sulfate and 25 mM EDTA andsubjectedtoelectrophoresis in a 1.75% polyacryl-amide-0.5% agarose gel. Tracks (a-g): T7 RNA
po-lymerase transcript with T3 DNA template treated with exonuclease IIIfor (a) 150min,(b) 120min,(c)
60min,(d)30min,(e) 20min, (f)10min, and (g) 0
min.Track(h)isthe T7RNApolymerase transcript
withintact T7DNAtemplate.DNAtemplate
concen-trations were:(a)0.4mM,(b)0.4mM, (c)0.5mM,
(d)0.4mM, (e)0.4mM,()0.3mM, (g)0.3mM, and (h)0.3mM.
on November 10, 2019 by guest
http://jvi.asm.org/
[image:6.501.68.239.63.644.2]2.0
a
b
c
d
e
f
g
h
0
E ° 2.0 _
C)
2D0 40 60
Time in minutes of Exo m treatment
FIG. 4. Shortening of template strand T3 DNA andofT3species IIIbreadbyT7RNApolymeraseas afunction ofduration ofexonuclease IIItreatment.
RNAshortening (A) was calculated from the change
in
mobility
ofT7species
IIIb in thegel
shown inFig.
nih
3. The relative error in this determination is esti-matedat ±4%(6). DNAtemplatestrand excision (0)
was calculated as one-halfthe total DNA rendered acid soluble during exonuclease III treatment. The relative error in DNA excision is approximately
Figure
5shows the results of transcribingthe sameseriesoftemplateswithT3 RNApolymer-ase. Threemajor T3 RNAsare affectedbythe
terminaldeletion, whereas threeremain
unal-tered. As expected, species VI (molecular
weight,2.3 x 105) isnotdetectedas a
transcrip-tionproductof any of these deletedtemplates,
sincetheminimumexcisionoftemplatestrand DNA in this experiment is 4.2 x 10⁵ daltons.
The mobilities of T3 species III, IV, and Vare
unaffected byexonucleolyticcleavage of37.5%
ofthegenome.Thus, theirterminatorsmustbe
located tothe left of62% on the genetic map.
The molar abundance of T3 speciesIII, IV, and Visunchanged by the excision of upto 31%of
each strand, indicating that their promoters
must lie to the right of31% genome length.
Upon removal of37.5% ofeach strand, these
three species can still be detected, implying thattheirpromotersoccur totherightof37.5%;
however, the abundance of theseRNAs,aswell
asthe total amount ofRNA
synthesized
fromthishighly truncated DNA, is
considerably
re-duced. Thesimplestexplanationfor this
obser-FIG. 5. Electrophoretic analysis ofRNAsmadein
vitrobyT3 RNApolymerasewithexonucleolytically
shortened T3template. The RNA madein a10-min
syntheticreactionwith70UofT3RNApolymerase
per ml, and the series oftruncated T3 templates
described inthelegendtoFig.3 wasanalyzedona 1.75% polyacrylamide-0.5% agarose gel. T3 DNA
templatewastreated with exonuclease IIIfor:(a)150 polymerasetranscript with T7 DNA template. DNA
min,(b)120min,(c)60min,(d)30min,(e)20min, templateconcentrations are as described in the
leg-(f)10min, and (g)0 min. Track(h) istheT7 RNA endtoFig. 3.
on November 10, 2019 by guest
http://jvi.asm.org/
[image:7.501.74.223.49.197.2] [image:7.501.274.434.60.618.2]750 GOLOMB AND CHAMBERLIN J. VIROL.
vation isthatthe promoters for T3 species III, genetic map. Since all the RNA formedbyT3
IV, andV are in theneighborhoodof38%, and RNA polymerase with T3 DNA template is
that their recognition is impaired by proximal complementary to the r strand, all
transcrip-deletion. Alternatively, asynchronous cleavage tion units are read in a rightward direction. during the course of the reaction could have Furthermore,since these speciesareshortened degraded these promoter sites on a fraction of in parallel with truncation of the template
the DNA molecules. strand, they must overlap and sharea common
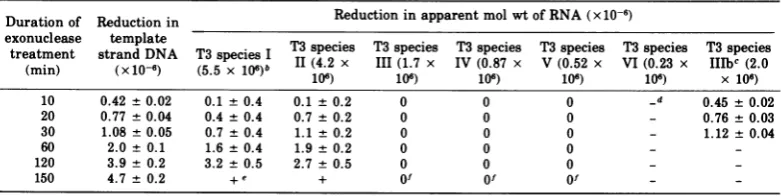
T3 species I and II are shortened as the tem- terminator near the right end of the T3 ge-plate is truncated(Fig. 5). Table 2 shows this in nome.From the data for T3speciesI, with their
quantitative form. Within the limits of error, high uncertainty, onecannot eliminate the
pos-T3 species I andII are shortened to an extent sibility of a terminator locatedimmediately to
equal to the shortening of the DNA template the left of T3 species VI; however,the data for
strand. Their terminators must therefore lie T3species IIand for the T3transcriptHIIbread near 100% on the genetic nmap, although the by T7 RNApolymerase aremoreaccurateand
uncertainty is greater than for T3 species VI rule outthispossibility. The simplest
arrange-(about 1% genome length for T3 species II and ment consistent with the data isoneof
overlap-2% genome length for I). Nevertheless, it is ping transcription units for T3 speciesI, II, and
evident that T3 species I and II must share a VI, which share asingle termination signalat common terminator with T3 species VI, and or near 100% (see Fig. 4 of the accompanying this must be quite near the right end of the paper [1]). From the apparent molecular
genome. weightsof theseRNAs, theirpromoters can be
In addition to the six major RNA species, positioned at56,67, and 98.2%,respectively. minorRNAs canbe detected inthe transcript The three remaining transcription units for
from native T3DNA. Two ofthese, species VII T3species III, IV, and V must lie in the interior
and VIII, with apparent molecularweights of of theT3genome, to the left of 56% and to the (7.5 + 0.8) x 106 and (6.1 ± 0.5) x 106, respec- right of 38%. Byanalogywith T7 species IIIa,
tively, are evident in Fig. 5. By 120 min of IV, and V (11), it is attractive to suppose that excision (3.9 x 10⁶ daltons of template strand thesespeciesoverlap,with promoters located at
DNA removed), these species have shifted to approximately 43, 49, and 52% and a common
positions correspondingtoapparent molecular terminatorat56%. According tothis hypothe-weights of5.1 x 106 and3.2 x 106,respectively, sis, the two minor T3 RNA species, VII and implying amolecularweightdecrease of2.4 x VIII, whichoriginzate atapproximately 40and 106 forthe larger species and 2.9 x 10⁶for the 50%, respectively, can most easily be inter-smaller. Thus, these minor RNAs must also preted as "read-through" RNAs, arising from terminate at or near the right-handed end of anoccasionalfailure ofT3RNA polymeraseto
the T3 genome. recognizethe termination signalat56%. Their
This information is sufficient to allow ap- molecular weights andmap position are those proximate positioning ofthe major transcrip- expected for RNAs initiating atthepromoters
tion units for T3 species I and II on the T3 for T3speciesIII and IV or Vandterminating
TABLE 2. Reductioninapparentmolecularweight of RNAstranscribed from extensively truncated
T3DNAtemplatea
Durationof Reduction in Reduction in apparent mol wt of RNA(x10-6)
exonuclease template T3species T3species T3species T3
species
T3species T3species treatment strand DNA T3 speciesI T3(4.2 x T3 (1.7xeiV
T3 87 x V(0.52 x VI(0.23
IIeT3c
x(2.s
0(min) (x10-6) (5.5 x10⁶)b I(4) 107)
1V06)
1065)
10.2)
x 10 )10 0.42 +0.02 0.1 + 0.4 0.1 ± 0.2 0 0 0 _d 0.45 + 0.02
20 0.77 ±0.04 0.4 + 0.4 0.7 + 0.2 0 0 0 - 0.76 ± 0.03
30 1.08 ± 0.05 0.7 ± 0.4 1.1 ± 0.2 0 0 0 - 1.12 ± 0.04
60 2.0 ± 0.1 1.6 ± 0.4 1.9 ± 0.2 0 0 0 -
-120 3.9 ± 0.2 3.2 ± 0.5 2.7 ± 0.5 0 0 0 -
-150 4.7 ± 0.2 +e + Of Of Of -
-a Reductionintemplatestrand DNA and reduction in apparent molecularweightof RNA are defined as for Fig. 4. Error
in measurement oftemplate strand excision is estimated from the precision of the assay procedure, and error in measurementofreductionin RNAmolecularweight is estimatedfromtheprecisionin mobility of a given RNA species on gels.
bMolecularweightoforiginaltranscript.
cReadbyT7RNA polymerase.
d,Species absentorunidentifiable.
e+,Speciespresent but size notdetermined.
fSpecies reducedinamount.
on November 10, 2019 by guest
http://jvi.asm.org/
[image:8.501.62.453.484.582.2]at100%. Two minor transcriptional units, cor- inthe specificity ofthephage RNA polymerase,
responding in size and map position to read- points to a strong selective advantage inherent
through extensions ofT7 species IIIa and IV, in such an arrangement. Some advantages of
have previouslybeen identified for T7 (Golomb, such an overlapping transcriptional pattern are
Ph.D. thesis; 6). evident. The entire late region is read much
DISCUSSION more
rapidly
than ifonly
asingle transcription
DISCUSSION unit were employed. In addition, there is a
The six major transcriptsformed by T3 RNA three- or fourfold enhancement of the mRNA
polymerasewith T3 DNAhave been character- for gene 10, for
example,
which suggeststhatized with respect to size and relative molar the positioning of several
promoters
for oneabundance. Three transcriptional units have genetic region is an effective mechanism of been assigned to definite chromosomal loca- transcriptionalcontrol thatmaywell be used in tions, and the remaining three transcription more complex
organisms
toamplify
transcrip-units are shown to be situated in the "late" tion ofcertain regions. Finally, the
arrange-region of the genetic map. Noneof the six major mentseemstominimizeterminator
signals
onprimary transcripts stems from the "early" re- the genome, although it is not evident to us
gion, and the data given here make it highly whythis should be of value.
unlikelythat any of them contain information Although the overallpatternof
transcription
for "class II" proteins (from 20 to 42% on the has beenconservedduringthe
divergence
of T3 genetic map [8]). Thistentative positioning is and T7 from theirhypothetical
commonances-confirmed by studies oftranscriptionof recom- tor, some differences in detail have
appeared.
binant phage DNAsintheaccompanying paper Thus T7 RNApolymerase
recognizes
astrong
(1). Theoverall patternof transcriptional units promoter on T7 DNA at 84% on the
genetic
for T3phageisquite similar tothat of T7 phage map, but T3 RNApolymerase does not
recog-(6, 10); two clusters of overlappingtranscription nize apromoterat this site onits
homologous
units covertheentire region of the genome that template.That sucha
promoter
onceexistedonspecifies "class III" phage proteins. The pri- T3DNA issuggested bythe abilityof T7RNA
mary transcripts corresponding to "class II" polymerase to
recognize
astrong
promoter
at genes, for either T3 or T7, remain to be charac- 84% genome length on T3 DNA.Presumably
terized. thecommon ancestor of T3 and T7
possessed
aThe similarity of thetranscriptionalmaps for promoter sequence at this site andaRNA po-T3 and T7 phages is in accord with the high lymerasecapableofrecognizing it;in thecourse
degree of DNA homology between the two ofevolution the RNA
polymerase
of T3lost thephages (4) and the colinearity of their genetic ability torecognize thissignal. Itis,
however,
maps (1). However, this resemblance is some- puzzling that T3 would retain a "latent" pro-whatsurprising in light of several striking dif- moter sequence that it is
incapable
ofutilizing.
ferencesbetweenthe two,including: (i) the con- Another difference between the T3 and T7 siderable divergence in gene size between T3 patterns oftranscriptionis the
synthesis
of two and T7 (0. G. Issinger, Ph.D. thesis, Univer- molarequivalents of T3species
Vby
T3 RNA sity of Freiberg, Freiburg, West Germany, polymerase, ascomparedtooneof T7species
V 1973), (ii) the low homology of certain genes byT7RNApolymerase. Themapping informa-(e.g., gene10[4]) and, finally, (iii) the failure of tion given here arguesagainst,
but does not T3 and T7 RNA polymerases to utilize effec- eliminate, thepossibilitythat twoseparate
ge-tively promoter sites read by each other. The neticregionsgiverise todistinct RNAs of this latter point isunderscored by the ability of both size. It ismorelikely,however,that T3species
T7 and T3 RNApolymerases to recognize pro- V stems from a unique chromosomal location moter sites at 98% genome length on their re- andthat thepromoterforthisspeciesisutilized spective DNAs
(Pv1),
although these promoters twice as efficiently as other T3 promoters orarenotmutuallyrecognizable and the resulting exists in tandemduplication.
transcript spansthe region of terminal redun- ACKNOWLEDGMENTS
dancy, which is virtually norhomologous be- Wewould liketothankGeorgeKassavetesfor his assist-tween the two phages. This specificity of the ance in the experiments shown in Table 2 and Hildburg
phagepolymerasesislikely to bemaintained in Beier forhelpful discussions.
vivo since no recombinant phages have been This researchwassupported by Public HealthService
found thatrequire reading of essentialgenesby grant
GM12010
from the National Institute for Generalanonhomologous RNA polymerase (1). Medical
Sciences.
The conservation of the unique transcrip- LITERATURE CITED
tionalpatternofT7andT3, which has survived 1. Beier,H., M. Golomb, and M. Chamberlin. 1976.
Isola-evolutionary changes inpromoter sequence and tion of recombinants between T7 and T3
on November 10, 2019 by guest
http://jvi.asm.org/
752 GOLOMB AND CHAMBERLIN J.
phages and their use in in vitro transcriptional map- Biol. 23:355-363.
ping. J. Virol. 21:753-765. 9. Maitra, U., and H. H.Huang. 1972. Initiation, release, 2. Beier, H., and R. Hausmann. 1973. Genetic map of andreinitiation of RNA chainsby bacteriophage-T3-bacteriophage T3. J. Virol. 12:417-419. inducedpolymerase from T3 DNA Templates. Proc. 3. Chamberlin, M., J. McGrath, and L. Waskell. 1970. Natl.Acad. Sci. U.S.A.69:55-59.
New RNApolymerase from E. coli infected with bac- 10. Niles, E. G., and R. C. Condit. 1975. Translational teriophageT7.Nature (London)228:227-231. mappingofbacteriophage T7 RNAssynthesized in 4. Davis, R. W., and R. W. Hyman. 1971. A study in vitroby purifiedT7 RNApolymerase. J. Mol. Biol.
evolution:the DNA base sequencehomologybetween 98:57-67.
coliphages T7 and T3. J. Mol. Biol. 62:287-301. 11. Niles,E.G., S. W.Conlon,and W. C. Summers.1974. 5. Dunn, J. J., F. A. Bautz, and E. K. F. Bautz. 1971. Purification andphysicalcharacterization of T7 RNA Different template specificities of phage T3 and T7 polymerase fromT7-infected Escherichia coli B+. Bio-RNA polymerases. Nature (London) New Biol. chemistry13:3904-3911.
230:94-96. 12. Pachl, C., and E. T. Young. 1976. Detection of polycis-6. Golomb,M., and M.Chamberlin.1974. Apreliminary tronic and overlapping bacteriophage T7 late tran-mapof themajor transcription unitsread byT7RNA scripts by in vitro translation. Proc. Natl. Acad. Sci. polymeraseontheT7andT3bacteriophage chromo- U.S.A. 73:312-316.
somes.Proc. Natl. Acad.Sci. U.S.A. 71:760-764. 13. Studier, F. W. 1972. Bacteriophage T7. Science 176:367-7. Golomb, M., and M. Chamberlin. 1974. Characteriza- 376.
tion of T7-specific ribonucleic acid polymerase IV. 14. Studier, F. W., and N. R. Movva. 1973. SAMase gene of Resolution of the major in vitro transcripts by gel bacteriophage T3 is responsible for overcoming host electrophoresis.J.Biol. Chem.249:2858-2863. restriction. J. Virol. 19:136-145.
8. MacHattie, L. A., D. A. Ritchie, C. A. Thomas, Jr., and 15. Sutton, W. D. 1972. A crude nuclease preparation suita-C.C. Richardson. 1967.Terminalrepetition in per- ble for use in DNA reassociation experiments. muted T2 bacteriophage DNA molecules. J. Mol. Biochim. Biophys. Acta240:522-531.
on November 10, 2019 by guest
http://jvi.asm.org/