City, University of London Institutional Repository
Citation
:
Lewis, Makayla (2013). Cerebral palsy, online social networks and change.
(Unpublished Doctoral thesis, City University London)
This is the unspecified version of the paper.
This version of the publication may differ from the final published
version.
Permanent repository link:
http://openaccess.city.ac.uk/3011/
Link to published version
:
Copyright and reuse:
City Research Online aims to make research
outputs of City, University of London available to a wider audience.
Copyright and Moral Rights remain with the author(s) and/or copyright
holders. URLs from City Research Online may be freely distributed and
linked to.
City Research Online:
http://openaccess.city.ac.uk/
publications@city.ac.uk
CEREBRAL PALSY, ONLINE SOCIAL
NETWORKS AND CHANGE
VOLUME 2
PHD IN HUMAN-COMPUTER INTERACTION
MAKAYLA MIRANDA LEWIS
NOVEMBER 2013
CENTRE FOR HUMAN-COMPUTER INTERACTION DESIGN
SCHOOL OF INFORMATICS
Table of content
Table of figures
5
Table of tables
7
Thesis Declaration
8
Chapter 7 – Study Five: Questionnaire
9
7.1 Introduction
9
7.2 Study questions
11
7.3 Method
11
7.3.1 Recruitment
12
7.3.2 Questionnaire design
12
7.3.3 Protocol
13
7.3.4 Participants
13
7.3.5 Organisation of data
13
7.3.5.1 Data cleaning
13
7.3.5.2 Creation of categories
14
7.3.5.3 Statistics
19
7.4 Findings
19
7.4.3.1 Knowledge
24
7.4.3.2 Consultation
24
7.4.3.3 Help and support
26
7.4.3.1 Opinions of others
29
7.4.3.5 Other factors
29
7.4.4 Discussion
31
7.4.4.1 Strengths
32
7.4.4.2 Weaknesses
32
Chapter 8 – Five-stage process for online social network change
34
9.1 Introduction
34
9.2.1.1 Timeline breakdown
38
9.2.1.2 Iteration
44
9.3 Five-stage process for OSN change
48
9.3.2 Five Stages
49
9.3.2.1 Before
49
9.3.2.2 Unfreeze
51
9.3.2.3 Persuade
52
9.3.2.5 After
55
9.4. Discussion
55
7.4.1 Strengths
58
7.4.2 Weaknesses
59
Chapter 9 – Conclusion and future work
60
10.1 Introduction
60
10.2 Achievement of the PhD research questions
60
10.2.1 Study one: Exploratory interview study
60
10.2.1.1 Limitations and future work
61
10.2.2 Study two: In-context observational study
62
10.2.2.1 Limitations and future work
62
10.2.3.1 Part one: peaks
64
10.2.3.2 Limitations and future work
67
10.2.4 Study 4: Longitudinal OSN monitoring and analysis study (Facebook)
68
10.2.4.1 Limitations and future work
69
10.2.5 Study 5: Questionnaire study
70
10.2.5.1 Limitations and future work
71
10.2.6 5-stage process for OSN change
72
10.3 Non-representation of cp community
73
10.4 Additional future work
74
10.5 Closing statement
76
References
77
Appendix A - Materials
88
A.1 Study One: Exploratory interviews (chapter 3)
89
A.1.1 Recruitment A4 poster
89
A.1.2 Participant covering letter
90
A.1.3 Pre-interview questionnaire
90
A.1.4 Participant recruitment form
93
A.1.5 Explanatory statement for participants
95
A.1.6 Adult informed consent form
95
A.1.7 Adult informed consent form for support individuals
96
A.1.8 Post-interview notes sheet
98
A.2 Study Two: In-context field observations (chapter 4)
100
A.2.1 Recruitment A4 poster
100
A.2.2 Participant covering letter
101
A.2.3 Pre-observation questionnaire
102
A.2.4 Explanatory statement for participants
106
A.2.5 Adult informed consent form
108
A.2.6 Adult informed consent form for support individual
109
A.2.7 Observation notes sheets
111
A.2.8 Post-observation interview notes sheet
112
A.2.9 Recruitment list
113
A.3 Study Three: Longitudinal Twitter monitoring and analysis (chapter 5)
114
A.3.1 Category consistency check: codebook
114
A.3.2 Category consistency check: coder dataset
114
A.3.3 Statistical charts based on event sampling category-document table
123
A.4 Study Three: Longitudinal Facebook monitoring and analysis (chapter 6)
129
A.5 Study Five: Questionnaire (chapter 7)
130
A.5.1 Offline questionnaire
130
A.5.2 Online questionnaire
131
Appendix B - Sample data
134
B.1 Study One: Exploratory interviews (chapter 3)
135
B.1.1 Primary-documents table
135
B.1.2 Interview
139
B.2 Study Two: In-context field observations (chapter 4)
169
B.2.1 Event log
169
B.2.2 Post observation interview
170
B.3.1 Peaks data sample
173
B.3.2 Fleiss Kappa including non-English tweets
184
B.3.3 Fleiss Kappa not including non-English tweets
186
B.3.4 Event sampling data sample
188
B.4 Study Four: Longitudinal Facebook monitoring and analysis (chapter 6)
200
B.5 Study Three: Questionnaire (chapter 7)
207
B.5.1 Spreadsheet data
207
B.5.2 SPSS data
218
Appendix C - publications and presentations
221
C.1 Publications
221
C.2 Presentations
221
C.3 Training
223
C.4 Events
223
C.5 Other achievements
224
Table of figures
Figure 81. Spreadsheet containing questionnaire data ... 14
Figure 82. Example of primary document table manual analysis ... 16
Figure 83. Questionnaire statistics: overall change experience ... 22
Figure 83. Comparison histogram exploring change acceptance between respondents with and without
disability ... 23
Figure 84. a-c) questionnaire statistics: overall change acceptance; b) Comparison histogram exploring
change non-acceptance between respondents with and without disability ... 24
Figure 85. Questionnaire statistics: knowledge before the change implementation ... 25
Figure 86. Questionnaire statistics: consultation before the change implementation ... 26
Figure 87. Questionnaire statistics: consultation throughout the change implementation ...27
Figure 88. Questionnaire statistics: consultation after the change implementation ... 28
Figure 89. Questionnaire statistics: help and support before the change implementation ... 29
Figure 90. ab) Questionnaire statistics: consultation throughout the change implementation c)
Comparison histogram exploring change non-acceptance between respondents with and without
disability ... 29
Figure 91. ab) Questionnaire statistics: consultation after the change implementation c) Comparison
histogram exploring change non-acceptance between respondents with and without disability ... 29
Figure 92. a-b) Questionnaire statistics: opinions of others during the change implementation c)
Comparison histogram exploring change non-acceptance between respondents with and without
disability ... 30
Figure 93.a) questionnaire statistics: other factors; b) Comparison histogram exploring change
nonacceptance between respondents with and without disability ... 31
Figure 94. Creating a narrative of study findings ... 37
Figure 95. Adapted #NewTwitter user feelings chart ... 38
Figure 96. Adapted user feelings chart highlighting negative user reactions ... 40
Figure 97. Adapted user feelings chart showing the removal of negative users reactions ... 41
Figure 98. Adapted user feelings chart showing alterations to the change map ... 43
Figure 100. Iteration 1: Process for OSN Change ... 45
Figure 101. Iteration 2-3: Process for OSN Change ... 46
Figure 102. Iteration 4-5: Process for OSN Change ... 47
Figure 103. Iteration 6-7: Process for OSN Change ... 48
Table of tables
Table 25 – upper and lower level categories ... 17
Thesis Declaration
The author grants powers of discretion to the University Librarian to allow this thesis to be
copied in whole or in part without further reference to the author. This permission covers
Chapter 7 – Study Five: Questionnaire
7.1 Introduction
The first study, an exploratory interview study (see chapter 3), identified the reasons for OSN use and
non-use and key themes including independence, privacy, trust, and change, together with challenges
such as slow input speed, poor user interface features, lengthy and complicated tasks, lack of user
interface personalization and unavailable or inappropriate within-website help.
As a result of the method a follow-up study, an in-context observational study was carried out (see
chapter 4). The study identified the OSNs and AT devices used, tasks carried out and users feelings
during interaction. It was determined that changing OSNs prevent and or slows these users ability to
communicate online whilst also not being represented adequately within HCI literature (see chapter 2
section 2.4).
To answer research question three and four: how are OSNs deploying change? and how are OSN
users experiencing and accepting change?. A two part longitudinal OSN monitoring and analysis study
was carried out from 14 September 2010 to 28 February 2011 (see chapter 5). The study identified
how OSN changes are introduced, their effect on users, and the factors that encourage OSN change
acceptance and non-acceptance. The study investigated a real world example of OSN change by
observing the actions of Twitter and users reactions to its change to #NewTwitter. The study also
identified five key themes: inappropriate change approach; the inappropriate use of consultation and
feedback and users experience, poor information concerning the change and problem solving; lengthy
roll out of the new user interface; and the positive use of community champions.
However the findings reflected radical restructuring resulting in the following questions being asked:
• Would OSN users react similarly if a different OSN change process was used?
• Would OSN users react similarly to weak restructuring?
• Do OSN users react differently to change in another OSN? To answer these questions a study
The study investigated the change approach and users reactions to a change on Facebook i.e. improved
photo-tagging feature from December 2010 to June 2011 (see chapter 6). The study found that users
disliked the Facebook process to change i.e. an automatic opt-in to the new feature causing users to
ask for help from the community to opt-out of the new feature. This was attributed to poor information
provided by Facebook.
The study also found that users were questioning the need for the change because they felt it would
affect their privacy. However it was determined that this was a result of the new feature not the change
approach. The study found that users reactions to weak restructuring was not significantly different to
the reaction of users that had experienced radical restructuring. However the study did not explicitly
identify how OSN users would like to experience change.
To answer research question four: how are OSN users experiencing and accepting change? A
questionnaire study that investigated the factors that affect OSN users acceptance of change was
carried out in July 2011.
Questionnaires were used because they offer feedback from the point of view of the user. This
feedback could be viewed as a trustworthy sample of what can be gathered from the whole user
population (Kirakowski, 2000).
Unfortunately the cp community was not distinguishable (or the wider disability community) within
the data set. This was attributed to the difficultly in recruitment specifically ‘over’ researching a
limited number of available participants. As a result open recruitment was used reflecting all OSN
users (similarly to study 3 and 4) to obtain overall insight of users experiences and requirements.
The study received ethical clearance from City University London. As a result a study summary was
This chapter discusses the study background, study questions, method, organization of data and the
findings.
7.2 Study questions
The study questions addressed were:
1.
What types of website change are Internet users experiencing?
2.
How do Internet users react to the change approach they have experienced?
3.
What influences Internet users to accept the change approach?
4.
What do Internet users consider the most important factors that influence their acceptance of
change approach?
The study questions were influenced by the previous studies, study one identified that OSN change
was an issue for the cp community, study 2 reiterated this and offered examples, whilst study 3 and 4
provided real-world examples of OSN change alongside users reactions. However none of these
studies explicitly focused on how OSN users would like to experience OSN change. The purpose of
this study was to fill this gap in understanding.
Additionally the study referred to website change rather than OSN change because it aimed to
establish internet change in the hopes that OSN change was experienced by the population. In
reflection this decision was flawed as it meant the study results did not completely link to the Twitter
or Facebook data. Therefore future work would be required to remove this limitation, this is further
discussed in section 10.3.
7.3 Method
This section discusses the population of concern, data sample, method of selection and organisation of
7.3.1 Recruitment
The study used open recruitment; Adults from all City University London programmes, departments
and professions were recruited using posters; recruitment also occurred externally.
7.3.2 Questionnaire design
Participants were asked 13 questions:
• Do you have a disability?
• Do you use any assistive technologies? (For example: screen readers or joystick)
• Have you experienced a website change within the last 6 months? (For example: task structure
or interface design). If you answered yes, briefly describe the change you experienced.
• Did you continue to use the website after the change was implemented? If you answered yes,
briefly describe why you continued to use the website?
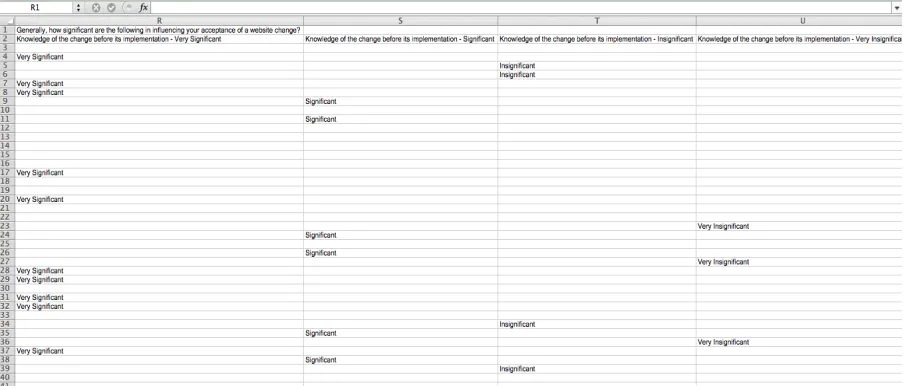
• [Matrix Question] Generally, how significant are the following in influencing your acceptance
of a website change? (Very Significant, Significant, Neutral, Insignificant and Very Significant):
• Knowledge of the change before its implementation
• Consultation with you before the change is implemented
• Consultation with you throughout the change
• Consultation with you after the change is implemented
• Help and support offered before the change is implemented
• Help and support offered throughout the change
• Help and support offered after the change is implemented
• Opinions of others experiencing the change
• Can you highlight any other factors which are important in influencing your acceptance of a
7.3.3 Protocol
The following protocol was followed:
• Researcher made the questionnaire available to the participant,
• Offline version (see appendix a section a.5.1),
• Online version (see appendix a section a.5.2),
• The participant completed the questionnaire,
• Researcher thanked the participant for participating.
7.3.4 Participants
Forty-one responses were collected. Participants were aged over 18 years old and had diverse
backgrounds.
7.3.5 Organisation of data
This section discusses the organisation of the data, it includes data cleaning, creation of categories and
statistics.
7.3.5.1 Data cleaning
The online and offline questionnaires were entered into a spreadsheet (see figure 89) (see appendix b
Figure 81.
Spreadsheet containing questionnaire data: X-axis refers to a particular question and Y-axis refers to
each participant
7.3.5.2 Creation of categories
The closed questions: 1-3, 6 and 9a-9g were exported to statistical analysis software (SPSS version 9)
for further analysis. The open questions: 4, 5, 7, 8 and 10 underwent a manual qualitative analysis
before being exported to SPSS.
Referring to the GIA each open response was read until categories began to emerge (see figure 97).
Initially the lower-level categories were identified followed by the upper-level categories. The latter
categories presented a generalised view of each response (see table 26). However only the upper level
categories were exported to SPSS for further analysis. The lower level categories were used to
enhance the findings.
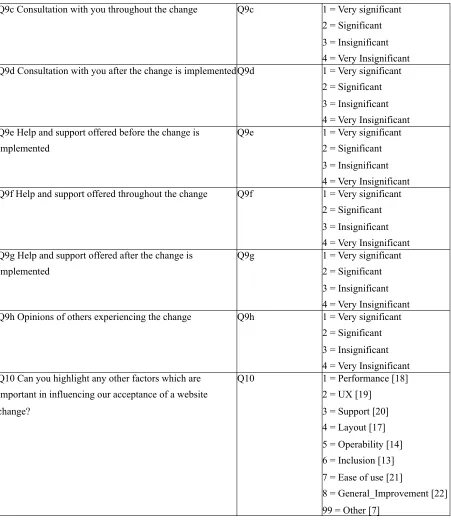
To further assist the statistical analysis a category codebook was developed. The codebook defined the
No.
Category
Description
1
OSN
Text units where reference is made to an online social network that has
undergone change
2
Branding
Text units where reference is made to website change specially rebranding
3
Layout
Text units where reference is made to website layout. This includes
architecture and contrast (positive and or negative) as a result of the website
change process or required for website change process
4
Navigation
Text units where reference is made to website navigation structure and or
navigation ease of use (positive and or negative) as a result of the website
change process or required for website change process
5
a11y_reduced
Text units where reference is made to accessibility tools and or features,
specially reduction (negative) in website accessibility functionality as a
result of the website change process
6
UX_reduced
Text units where reference is made to user experience features, specially
reduction (negative) in website usability as a result of the website change
process
7
Other
Text units that are considered off topic
8
Frustration
Text units where reference is made to frustration, annoyance, dissatisfaction
etc. with the website change process
9
Non_acceptance
Text units where reference is made to change specifically user non
acceptance of the process or the changed website
10
Transitory_Acceptance
Text units where reference is made to change specifically users likes or
dislikes the change but has used the changed website for a temporary time
because they wanted to try it or they felt the change was going to happen
and they felt they should use it. They have since accepted the change.
11
Suggestion
Text units where reference is made to change specifically offering a
suggestion to improve or an alteration regarding the method used.
12
Questioning
Text units where reference is made to change specifically questioning the
method and or purpose.
13
Inclusion
Text units where reference is made to consultation and feedback, user
inclusion in the change process
14
Operability
Text units where reference is made to the user interface or feature problems
specifically operability of the changed website for example allowable
functions are now harder to use or are not working as expected.
15
Acceptance_Problem
Text units where reference is made to change acceptance regardless of new
problems with the changed website
16
Acceptance
Text units where reference is made to change specifically user acceptance
of the changed website
17
Layout
Text units where reference is made to the website layout (aesthetics/
appearance) for example user dislikes visual appeal or has a problem with
the appearance e.g. colour of buttons after the change.
18
Performance
Text units where reference is made to the change agent after the change
specifically response time
19
UX
Text units where reference is neutrally or generally made to user experience
features
20
Support
Text units where reference is made to support provided by the change agent
before, during or after the change
21
Ease of use
Text units where reference is made to positive factors promoting change
acceptance specifically ease of use
[image:17.595.88.541.56.649.2]22
General_Improvement
Text units where reference is made to an unnamed improvement of changed
website that promotes change acceptance
Full variable name
SPSS variable
name
Coding instructions
Identification number
ID
Number assigned to each
questionnaire
Q1 Do you have a disability
Q1
1 = Yes
2 = No
Q2 Do you use any assistive technologies?
Q2
1 = Yes
2 = No
Q3 Have you experienced a website change within the last
6 months
Q3
1 = Yes
2 = No
Q4 Briefly describe the change you experienced
Q4
1 = OSN [1]
2 = Branding [2]
3 = Layout [3]
4 = Navigation [4]
5 = a11y_reduced [5]
6 = UX_reduced [6]
7 = Task
8 = Operability [14]
99 = Other [7]
Q5 How did you feel about the change you experienced
Q5
1 = Frustration [8]
2 = Non_acceptance [9]
3 = Transitory_Acceptance
[10]
4 = Suggestion [11]
5 = Questioning [12]
6 = Acceptance [13]
7 = Inclusion [13]
99 = Other [7]
Q6 Did you continue to use the website after the change
was implemented
Q6
1 = Yes
2 = No
Q7 If you answered yes to Q6 briefly describe why you
continued to use the website
Q7
1 = Operability [14]
2 = Acceptance_Problem [15]
3 = Acceptance [16]
99 = Other [7]
Q8 If you answered no to Q6 briefly describe why you did
not continued to use the website
Q8
1 = Operability [14]
2 = Layout [17]
99 = Other [7]
Q9a Knowledge of the change before its implementation
Q9a
1 = Very significant
2 = Significant
3 = Insignificant
4 = Very Insignificant
Q9b Consultation with you before the change is
implemented
Q9b
1 = Very significant
Q9c Consultation with you throughout the change
Q9c
1 = Very significant
2 = Significant
3 = Insignificant
4 = Very Insignificant
Q9d Consultation with you after the change is implementedQ9d
1 = Very significant
2 = Significant
3 = Insignificant
4 = Very Insignificant
Q9e Help and support offered before the change is
implemented
Q9e
1 = Very significant
2 = Significant
3 = Insignificant
4 = Very Insignificant
Q9f Help and support offered throughout the change
Q9f
1 = Very significant
2 = Significant
3 = Insignificant
4 = Very Insignificant
Q9g Help and support offered after the change is
implemented
Q9g
1 = Very significant
2 = Significant
3 = Insignificant
4 = Very Insignificant
Q9h Opinions of others experiencing the change
Q9h
1 = Very significant
2 = Significant
3 = Insignificant
4 = Very Insignificant
Q10 Can you highlight any other factors which are
important in influencing our acceptance of a website
change?
Q10
1 = Performance [18]
2 = UX [19]
3 = Support [20]
4 = Layout [17]
5 = Operability [14]
6 = Inclusion [13]
7 = Ease of use [21]
[image:19.595.88.539.54.577.2]8 = General_Improvement [22]
99 = Other [7]
7.3.5.3 Statistics
Considering Pallant (2010) approach to statistical analysis of data, the following protocol was used:
1.
Using the codebook (see table 26) the SPSS data file structure was set up,
2.
Using the codebook the text data was reformatted to numerical data and imported to SPSS,
3.
Using the spreadsheet (see figure 96) the data was screened for errors and appropriate
corrections were made,
4.
The data was explored:
• Descriptive statistics were generated, these included frequencies and percentage, means,
95% confidence interval for mean, 5% trimmed mean, median, variance, standard
deviation, minimum and maximum,
• The descriptive statistics were displayed using tables, histograms, box plots and normal
Q-Q plots,
5.
It was determined that the data represented two groups: respondents whom reported having a
disability and those without a disability. Comparison histograms were used to present this.
7.4 Findings
Total responses were 41, 38 online, 3 offline, 30 reported not having a disability whilst 11 reported
having a disability (see appendix b section b.5.1 and b.5.2 for data sample). The following sections
will look at the responses in more detail to answer the study questions.
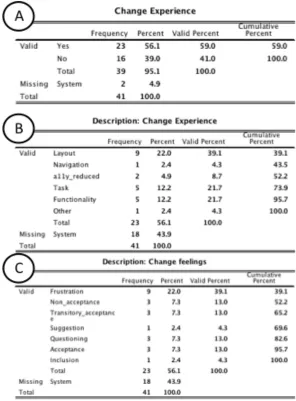
7.4.1 Change experience
The study found that 22 of 39 respondents reported that they had experienced a website change (see
figure 98a). They reported that the website layout was the key form of change they had experienced
(9) followed by the website tasks (5) and functionality (5 (see figure 98b). One respondent described:
Example 1:
“Complete redesign and rebranding. Very confusing. The design was
The study found that 23 of 39 respondents confirmed that they had experienced OSNs change,
specifically within Facebook and Twitter. Two respondents described:
Example 2:
“Change in Facebook and Twitter mean my larger settings don’t work anymore”.
Example 3:
“Twitter and Facebook have both changed their layouts and how certain aspects
of the profiles look and work. Pictures for example, pop up in their own window and
instructions on editing the pictures are in a different place on the page”.
Furthermore the study found that 3 out of the 23 respondents referred to #NewTwitter and Facebook’s
new automated photo-tagging feature. Two respondents described:
Example 4:
“Twitter introduced their new, single page site”
Example 5:
“Facebook added some features to my account that I was not aware of, such as
face recognition software”
The respondents were also asked to define how they felt about the website change (see figure 98c). 5
feeling frustrated. Two respondents described:
Example 6:
“extremely frustrated”.
Example 7:
“Like being slapped – can cope with changes to sites but when it is radical
enough to lock you out and it was a useful resource before it is telling me we don’t
want your kind, you are not our kind of customer”.
The study found that frustration resulted in acceptance (2), transitory acceptance (2), non-acceptance
(2) or questioning (2). Two respondents described:
Example 8:
“It took a while to get used to the new options but the changes made the website
simpler to use”.
Furthermore the study found that respondents that indicated having a disability found changing
websites frustrating resulting in non-acceptance or transitory-acceptance. This was similar to
[image:22.595.162.458.152.553.2]respondents without a disability (see figure 99).
Figure 83.
Comparison histogram exploring change acceptance between respondents with and without disability
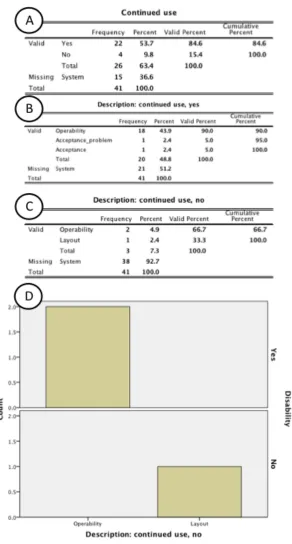
7.4.2 Change acceptance
The study found that 22 of 39 respondents that had experienced a website change reported continued
use of the website after the change (see figure 100a). This was due to the operability and purpose of
the website was not significantly altered after the change (see figure 100b). Two respondents
described:
Example 9:
“the changes did not significantly change the overall idea of the website”
Example 10:
“the core proposition was still interesting to me”
The study also found that respondents that reported a disability who ceased using the website after a
change did so because the operability and purpose had significantly changed (see figure 100bc). One
Example 10:
“the new site was less intuitive and I would have needed to “learn” how to use
[image:24.595.168.460.123.667.2]the new site, which was not acceptable”.
Figure 84.
a-c) questionnaire statistics: overall change acceptance; b) Comparison histogram exploring change
7.4.3 Change influences
Twenty-three responses were collected that focused on how significant knowledge, consultation, help
and support and opinions of others affected change acceptance. The following sections will discuss
this in more detail.
7.4.3.1 Knowledge
The study found that 22 reported that knowledge from the change agent before a website change is
[image:25.595.90.537.294.490.2]very significant (see figure 101ab).
Figure 85.
Questionnaire statistics: knowledge before the change implementation
7.4.3.2 Consultation
The study found that 11 respondents reported that consultation before a website change
implementation is insignificant (see figure 102ab).
However respondents (n= 5) whom reported having a disability expressed prior consultation was
Figure 86.
Questionnaire statistics: consultation before the change implementation
Furthermore the study found that9 respondents reported that consultation throughout a website change
deployment was insignificant. However 8 respondents reported it was significant (see figure 103a).
The statistical data has revealed equivalence between significances.
Cumulatively12 reported either very significant or significant compared to 12 reported either
insignificant or very significant (see figure 103a). This can be seen as inconclusive via mean (2.27)
and trimmed-mean (2.26) who had expressed significant for consultation throughout a website change
deployment (see figure 103ab).
[image:26.595.88.537.527.723.2]Furthermore the study found that few respondents opted for very significant (n= 5), insignificant (n=
4) or very insignificant (n= 0). These respondents were identified as outliners (see figure 104b).
However using a 5% trimmed mean of 1.96 it was determined that users consider consultation after a
[image:27.595.99.537.154.360.2]website change implementation as significant.
Figure 88.
Questionnaire statistics: consultation after the change implementation
7.4.3.3 Help and support
The study found that11 respondents reported that consultation before a website change deployment is
‘significant’ (see figure 105ab).
[image:27.595.95.536.510.708.2]Additionally the study found that10 respondents reported that help and support throughout a website
change deployment was ‘significant’ (see figure 106ab).
The study also found that the majority (n=
4) of respondents whom reported having a disability and
answered this question expressed help and support throughout as being highly significant (see figure
[image:28.595.95.535.195.618.2]106c).
Figure 90.
ab) Questionnaire statistics: consultation throughout the change implementation c) Comparison
histogram exploring change non-acceptance between respondents with and without disability
Furthermore the study found that 9 respondents reported that help and support after a website change
reported having a disability (n= 4) whilst the majority of those whom reported not having a disability
[image:29.595.89.535.102.561.2](n= 7) reported significant (see figure 16c).
Figure 91.
ab) Questionnaire statistics: consultation after the change implementation c) Comparison histogram
7.4.3.1 Opinions of others
The study found that 10 respondents reported that the opinions of others effected by the change
process was insignificant in their acceptance (see figure 107ab). However the study found that
[image:30.595.90.535.157.580.2]respondents that reported having a disability reported it as significant (see figure 107c).
Figure 92.
a-b) Questionnaire statistics: opinions of others during the change implementation c) Comparison
histogram exploring change non-acceptance between respondents with and without disability.
7.4.3.5 Other factors
The respondents were also asked for a list of other factors that influences their acceptance of a change.
The study found that 4.9% of respondents reported that website performance, web user interface
layout, inclusion by change agent and general website improvements were positive factors that
influenced change acceptance. Two respondents described:
Example 11:
“how much it saves time or improves the performance of the service”
Example 12:
“letting me know that there are changes when I launch a website for the first
time (since a change) is always helpful”
Additionally the study found that one respondent reported that the user experience, support offered
and operability and the ease of use during the change were also important. One respondent described:
Example 11:
“as long as they have some sort of tutoring program after the changes are made,
I’m happy. Changes are confusing at times and makes it difficult to manoeuvre the website”.
Finally the study found that respondents whom indicated having a disability found website layout and
[image:31.595.92.533.444.659.2]inclusion by the change agent as the only important factors for website acceptance (see figure 109b).
Figure 93.
a) questionnaire statistics: other factors; b) Comparison histogram exploring change non-acceptance
7.4.4
Discussion
The final questionnaire study investigated the factors that affect OSN users acceptance of change.
The study was influenced by the previous studies: study one identified that OSN change was an issue
for the cp community, study 2 reiterated this and offered examples, whilst study 3 and 4 provided
real-world examples of OSN change alongside users reactions. However none of these studies explicitly
focused on how OSN users would like to experience change. The purpose of this study was to fill this
gap in understanding.
The study used open recruitment; Adults from all City University London programmes, departments
and professions were recruited using posters; recruitment also occurred externally. Forty-one
responses were gathered. Participants were aged over 18 years and had diverse backgrounds. The
following questions were addressed:
1. What website changes are Internet users experiencing?
2. How significant is knowledge of the change before it is implemented?
3. How significant is consultation before, during and after the change is implemented?
4. How significant is help and support offered before, during and after the change is
implemented?
5. Does the opinions of others experiencing the change influence users acceptance of a website
change?
The study found that respondents had experienced website change (n= 23) and 84% of them continued
to use the website after the change was deployed. Additionally the study identified three key factors
that influence change acceptance:
1. Knowledge of the change was reported as ‘very significant’ or ‘significant’,
2. Consultation throughout and after the change was reported as both ‘very significant’ and
‘significant’,
The study also provided further insight into the factors that encourage change acceptance. The study
found that website performance and user interface, inclusion by the change agent and general website
improvements were positive factors that influenced change acceptance.
7.4.4.1 Strengths
Studies three and four investigated how an OSN change is deployed, its effect on users, and the factors
that encourage change acceptance and non-acceptance in both a radical and weak restructuring setting.
However the studies did not explicitly identify how OSN users would like to experience change. The
fifth study, a questionnaire, filled this gap in understanding by identifying the factors that affect OSN
users acceptance of change. Thus the findings from this study has been viewed as highly valuable.
Therefore the results from the study have further filled the gap in previous HCI research. Whilst also
further answering the latter part of research question four: How are online social network users
experiencing and accepting change?
7.4.4.2 Weaknesses
The study presented two key weaknesses:
1. The study referred to website change rather than OSN change because it aimed to establish
internet change in the hopes that OSN change was experienced by the population. In reflection
this decision was flawed as it meant the study results did not completely link to the Twitter or
Facebook studies (see chapter 10 section 10.2 and 10.4 for future work that could overcome
this limitation).
2. The study identify OSN users with cp due to recruitment issues and a concern of over
researching i.e. approaching participants from study one and two. These limitations meant that
the study was very broad and a prime opportunity to gather final insights from the cp
community was missed (see chapter 10 section 10.2 for future work that could overcome this
Though studies one to five have successfully answered research questions one to four (see chapter 1
section 1.4) whilst also putting forward two methodological contributions:
1. A unique way of displaying OSN change and user acceptance via an infographic,
2. An inductive category model to examine OSN change.
The studies have not answered research question five: How can online social networks change
deployment approach be improved to better facilitate users with cerebral palsy? Chapter 9 will answer
Chapter 8 – Five-stage process for online social network change
9.1 Introduction
The first study, an exploratory interview study (see chapter 3), identified the reasons for OSN use and
non-use and key themes including independence, privacy, trust, and change, together with challenges
such as slow input speed, poor user interface features, lengthy and complicated tasks, lack of user
interface personalization and unavailable or inappropriate within-website help.
As a result of the method a follow-up study, an in-context observational study was carried out (see
chapter 4). The study identified the OSNs and AT devices used, tasks carried out and users feelings
during interaction. It was determined that changing OSNs prevent and or slows these users ability to
communicate online whilst also not being represented adequately within HCI literature (see chapter 2
section 2.4).
To answer research question three and four: how are OSNs deploying change? and how are OSN
users experiencing and accepting change?. A two part longitudinal OSN monitoring and analysis study
was carried out from 14 September 2010 to 28 February 2011 (see chapter 5). The study identified
how OSN changes are introduced, their effect on users, and the factors that encourage OSN change
acceptance and non-acceptance. The study investigated a real world example of OSN change by
observing the actions of Twitter and users reactions to its change to #NewTwitter. The study also
identified five key themes: inappropriate change approach; the inappropriate use of consultation and
feedback and users experience, poor information concerning the change and problem solving; lengthy
roll out of the new user interface; and the positive use of community champions.
However the findings reflected radical restructuring resulting in the following questions being asked:
Would OSN users react similarly if a different OSN change process was used? Would OSN users react
similarly to weak restructuring? Do OSN users react differently to change in another OSN? To answer
The study investigated the change approach and users reactions to a change on Facebook i.e. improved
photo-tagging feature from December 2010 to June 2011 (see chapter 6). The study found that users
disliked the Facebook process to change i.e. an automatic opt-in to the new feature causing users to
ask for help from the community to opt-out of the new feature. This was attributed to poor information
provided by Facebook.
The study also found that users were questioning the need for the change because they felt it would
affect their privacy. However it was determined that this was a result of the new feature not the change
approach. The study found that users reactions to weak restructuring was not significantly different to
the reaction of users that had experienced radical restructuring. However the study did not explicitly
identify how OSN users would like to experience change. To fill this gap in understanding a
questionnaire study that investigated the factors that affect OSN users acceptance of change was
carried out in July 2011.
The study found that respondents had experienced website change (n= 23) and 84% of them continued
to use the website after the change was deployed. Additionally the study identified three key factors
that influence change acceptance: Knowledge of the change was reported as ‘very significant’ or
‘significant’, consultation throughout and after the change was reported as ‘very significant’ or
‘significant’, help and support before, throughout and after was reported as ‘significant’. The study
also provided further insight into the factors that encourage change acceptance. The study found that
website performance and the user interface, inclusion by the change agent and general website
improvements were positive factors that influenced change acceptance.
Through distilling the findings from the five studies together with the change theories and approaches
identified in the literature review (see chapter 2 section 2.4), this PhD research puts forward a process
for OSN change for change agents to follow. The process gained publication in
TCUK’12,
DIS’12 and
CSUN’12 (see appendix c section c.1 and c.6). This chapter will introduce the five-stage process and
9.2 Method
9.2.1 Findings narrative
To develop the process for OSN change for change agents to follow a findings narrative was initially
developed. To do this the key findings from each study were laid out (see figure 110) and data
relationships (similarities between the different studies) were identified. For example study one and
two related to cp, OSNs and change were grouped together, followed by study three, four and five.
The narrative provided a high-level glimpse at the overall data set and allowed for positive and
[image:37.595.87.541.290.545.2]negative OSN issues to be viewed across the studies.
Figure 94.
Creating a narrative of study findings.
The key issues from the studies were highlighted, for example study one and two identified that OSNs
prevent and or slows adults with cp ability to communicate online and that unavailable or
inappropriate within-website help is a key issue. Whilst study three, four and five identified that OSN
9.2.2 Timeline
It was identified that a lot of the key findings, specifically issues, within studies three, four and five
were presented expressed within the user feelings chart created in part two of the third study, therefore
this was revisited (see chapter 5 section 5.3.1.3 and figure 89). The chart showed Twitter users
reactions specifically their feelings during the change from the old user interface to the new user
interface (#NewTwitter). The user feelings chart specifically showed a summary of Twitter users
feelings during each interval. However the chart did not illustrate the root cause of these reactions. As
a result the timeline developed during part one of study three was consulted (see chapter 5 section
5.2.1 and figure 59). The timeline showed Twitter’s activities and media responses and provided an
external view of the change process.
Additionally the Twitter change map was also consulted (see chapter 5 section 5.2.4 and figure 60).
The map considered Twitter’s actions before, during and after the change whilst also taking into
account the change theories and approaches discussed in chapter 2 section 2.4. As a result Twitter’s
PREVENTED(
ACCEPTANCE( NON,ACCEPTANCE( INCLUDED(
NON,ACCEPTANCE( FRUSTRATED( FORCED( NON,ACCEPTANCE( FRUSTRATED( SOLVING( EXPERIENCING( ACCEPTANCE( SOLVING( FRUSTRATED( REDISCOVERING( EXPERIENCING( DISCONTENTED( SOLVING( FRUSTRATED( IMPATIENCE( ANTICIPATING( CONFUSED( 22/FEB/ 2011( 14/SEPT/2010( FE BRU ARY ’1 1( JAN U ARY ’1 1( D EC EMB ER’ 10 ( N O VE MB ER’ 10 ( O CT O BE R’ 10 ( SE PT EMB ER’ 10 ( NON,ACCEPTANCE(
LEWIN:( UN
FRE EZE ( LIPPIT:(STEP(1,4( LE W IN :(P ERS U AS IO N ( LIPPIT:(STEP(6( LE W IN :(RE FRE EZE ( LIPPIT:(STEP(7( O H LS SO N :(O VE RL AP (,( PRO MO TI N G (B RI EF( AN D (U N D ERS TAN D IN G ( LIPPIT:(STEP(7( ( OHLSSON:(OVERLAP(–(AVALIBILITY(DECREASES(((( RE FRE EZE (W ARN IN G ( E( S( ( Celebrity(involvement( AdverJsing((TwiOer( and(Media)( Launch( Problem(awareness( Roll(out(completed( AdverJsing( Message(change( Improvements( New(pop(up( QuesJonnaire( ! Confused!to!perplex!or!bewilder!e.g.!users!not!sure!what! #NewTwi7er!is.!! !
[image:39.595.89.530.59.402.2]AnJcipaJng!to!expect;!look!forward!to:!to!an&cipate!a! favorable!ac&on!e.g.!Users!excited!for!rollout!to!reach!their! account.! ! ImpaJence!lack!of!pa>ence;!eager!desire!for!relief!or!change;! restlessness!e.g.!users!wan>ng!roll!out!to!have!now.! ! Frustrated!having!a!feeling!of!or!filled!with!frustra>on;! dissa>sfied!e.g.!difficulty!leC!him!absolutely!frustrated!!e.g.! users!frustrated!with!#NewTwi7er!problems.! ! Discontented!not!content!or!sa>sfied;!dissa>sfied;!restlessly! unhappy!e.g.!users!do!not!want!#NewTwi7er!to!come,!they! dislike!the!approach!used.! ! Solving!to!work!out!the!answer!or!solu>on!e.g.!users!sugges>ng! or!developing!solu>ons!to!Frustra>ons! ! Experiencing!the!observing,!encountering,!or!undergoing!of! things!generally!as!they!occur!in!the!course!of!>me!e.g.!users! trying!#NewTwi7er.! ( Rediscovering!discover!again;!(discover:!to!see,!get!knowledge! of,!learn!of,!find,!or!find!out;!gain!sight!or!knowledge!of! (something!previously!unseen!or!unknown)!e.g.!Twi7er.com! encouraging!users!to!try!#NewTwi7er,!users!taking!up!this!offer.! ! Acceptance(the!act!of!taking!or!receiving!something!offered;! favorable!recep>on;!approval;!favor!e.g.!users!accep>ng!and! ac>vity!using!#NewTwi7er! !! Non,Acceptance!the!not!act!of!taking!or!receiving!something! offered;!unfavorable!recep>on;!disapproval!e.g.!users!not! accep>ng!or!using!#NewTwi7er! ! Forced!to!compel,!constrain,!or!oblige!(oneself!or!someone)!to! do!something!e.g.!due!to!Twi7er.com!approach!users!feel!or!are! being!forced!to!use!#NewTwi7er.! ! Included!to!contain!as!a!part!or!member,!or!among!the!parts! and!members,!of!a!whole!e.g.!Twi7er.com!asking!users!there! opinions.! ! Prevented!to!hinder!or!stop!from!doing!something!e.g.! Twi7er.com!preven>ng!users!using!#OldTwi7er! ! Defini&ons!obtained!from!h6p://dic&onary.reference.com/![Accessed:!9!May!2011]! ! ! !
Figure 95.
Adapted #NewTwitter user feelings chart: brackets on the left show the change process, flow diagram
show the timeline and user feelings, OSN actions are shown next to each month, and user feelings definitions are
shown on the right.
The user feelings chart represented a large quantity of text units (n = 2400 tweets from the event
sampling study), therefore it was deemed appropriate to act as a baseline for the potential change
process.
9.2.1.1 Timeline breakdown
The negative reactions associated with Twitter’s change approach were identified within the adapted
user feelings chart (see figure 112 highlighted in red). These actions were confused, frustrated,
discontented, forced and prevented. For example during the sixteenth interval, 22 February 2010, users
were unable to access #NewTwitter due to user interface problems (see chapter 5 section 5.3.4.2.14
and Twitter example 36). Therefore these negative user reactions were removed from the timeline (see
PREVENTED(
ACCEPTANCE( NON,ACCEPTANCE( INCLUDED(
NON,ACCEPTANCE( FRUSTRATED( FORCED( NON,ACCEPTANCE( FRUSTRATED( SOLVING( EXPERIENCING( ACCEPTANCE( SOLVING( FRUSTRATED( REDISCOVERING( EXPERIENCING( DISCONTENTED( SOLVING( FRUSTRATED( IMPATIENCE( ANTICIPATING( CONFUSED( 22/FEB/2011( 14/SEPT/2010( FE BRU ARY ’1 1( JAN U ARY ’1 1( D EC EMB ER’ 10 ( N O VE MB ER’ 10 ( O CT O BE R’ 10 ( SE PT EMB ER’ 10 ( NON,ACCEPTANCE(
LEWIN:( UN
[image:40.595.89.490.87.651.2]FRE EZE ( LIPPIT:(STEP(1,4( LE W IN :(P ERS U AS IO N ( LIPPIT:(STEP(6( LE W IN :(RE FRE EZE ( LIPPIT:(STEP(7( O H LS SO N :(O VE RL AP (,( PRO MO TI N G (B RI EF( AN D (U N D ERS TAN D IN G ( LIPPIT:(STEP(7( ( OHLSSON:(OVERLAP(–(AVALIBILITY(DECREASES(((( RE FRE EZE (W ARN IN G ( E( S(
ACCEPTANCE( NON,ACCEPTANCE( INCLUDED( EXPERIENCING( ACCEPTANCE( SOLVING( REDISCOVERING( EXPERIENCING( IMPATIENCE( ANTICIPATING( 22/FEB/2011( 14/SEPT/2010( FE BRU ARY ’1 1( JAN U ARY ’1 1( D EC EMB ER’ 10 ( N O VE MB ER’ 10 ( O CT O BE R’ 10 ( SE PT EMB ER’ 10 (
LEWIN:( UN
[image:41.595.88.507.63.645.2]FRE EZE ( LIPPIT:(STEP(1,4( LE W IN :(P ERS U AS IO N ( LIPPIT:(STEP(6( LE W IN :(RE FRE EZE ( LIPPIT:(STEP(7( O H LS SO N :(O VE RL AP (,( PRO MO TI N G (B RI EF( AN D (U N D ERS TAN D IN G ( LIPPIT:(STEP(7( ( OHLSSON:(OVERLAP(–(AVALIBILITY(DECREASES(((( E( S( RE FRE EZE (W ARN IN G (
Figure 97.
Adapted user feelings chart showing the removal of negative users reactions
The removal of the negative user reactions produced a gap within the timeline (see figure 113). This
gap was omitted to depict an existence where negative reactions did not occur. To do this the
about the purpose of #NewTwitter during the first interval, 14 September 2010, (see chapter 5 section
5.3.4.2.1). This was due to the roll out approach: 10% of tweets asked who had it, 6% of tweets asked
when they would get it and 10% of tweets were asking other Twitter users how they could get it.
Through revisiting the full data sample collected using TwapperKeeper.com (see chapter 5 section
5.2.7.1) it was identified that Twitter users confusion (as discussed in the previous example) lasted for
four days, therefore four days were removed from the Twitter timeline.
As a result it was determined that if the negative user reactions did not occur Twitter’s change process
could be reduced from 6 months to under 3 months: 14 September to 1 December 2010 (see figure
114).
Additionally the theories and approaches identified within the change map were adjusted to meet this
FE BRU ARY ’1 1( JAN U ARY ’1 1( D EC EMB ER’ 10 ( N O VE MB ER’ 10 ( O CT O BE R’ 10 ( SE PT EMB ER’ 10 (
LEWIN:( UN
FRE EZE ( LIPPIT:(STEP(1,4( LE W IN :(P ERS U AS IO N ( LIPPIT:(STEP(6( LE W IN :(RE FRE EZE ( LIPPIT:(STEP(7( O H LS SO N :(O VE RL AP (,( PRO MO TI N G (B RI EF( AN D ( U N D ERS TAN D IN G ( LIPPIT:(STEP(7( ( RE FRE EZE (W ARN IN G (
ACCEPTANCE( NON,ACCEPTANCE( INCLUDED(
[image:43.595.104.508.68.630.2]EXPERIENCING( ACCEPTANCE( SOLVING( REDISCOVERING( EXPERIENCING( IMPATIENCE( ANTICIPATING( 22/FEB/ 2011( 14/SEPT/2010( E( S(
Figure 98.
Adapted user feelings chart showing alterations to the change map
As a result a user feeling chart that depicted an ideal situation for Twitter’s change approach was
ACCEPTANCE( NON,ACCEPTANCE( INCLUDED( EXPERIENCING( ACCEPTANCE( SOLVING( REDISCOVERING( EXPERIENCING( IMPATIENCE( ANTICIPATING( 1/DEC/2010( 14/SEPT/2010( FE BRU ARY ’1 1( JAN U ARY ’1 1( D EC EMB ER’ 10 ( N O VE MB ER’ 10 ( O CT O BE R’ 10 ( SE PT EMB ER’ 10 ( E( S( LEWIN:( UN
[image:44.595.82.484.134.611.2]FRE EZE ( LIPPIT:(STEP(1,4( LE W IN :(P ERS U AS IO N ( LIPPIT:(STEP(6( LE W IN :(RE FRE EZE ( LIPPIT:(STEP(7( O H LS SO N :(O VE RL AP (,( PRO MO TI N G (B RI EF( AN D ( U N D ERS TAN D IN G ( LIPPIT:(STEP(7( ( RE FRE EZE (W ARN IN G (