Spatial and Spectral Features Utilization on a
HyperSpectral Imaging System for Rice Seed
Varietal Purity Inspection
Hai Vu
∗, Christos Tachtatzis
†, Paul Murray
†, David Harle
†,
Trung Kien Dao
∗, Robert Atkinson
†, Thi-Lan Le
∗, Ivan Andonovic
†, Stephen Marshall
† ∗International Research Institute MICA, Hanoi University of Science and Technology†Dept. of Electronic and Electrical Engineering, University of Strathclyde
Email: [email protected]
Abstract—A conventional method to inspect the varietal purity
of rice seeds is based on evaluating human visual inspection where a random sample is drawn from a batch. This is a tedious, laborious, time consuming and extremely inefficient task. This paper presents an automatic rice seed inspection method using Hyperspectral imaging and machine learning, to automatically detect unwanted seeds from other varieties which may be contained in a batch. Hyperspectral image data from Near-infrared (NIR) and Visible cameras are acquired for six common rice seed varieties. The results of applying two classifiers are presented, a Support Vector Machine (SVM) and a Random Forest (RF), where each consists of six one-versus-rest binary classifiers. The results show that combining spectral and shape-based features derived from the rice seeds, increase precision of the multi-label classification to 84% compared 74% when only visual features are used.
I. INTRODUCTION
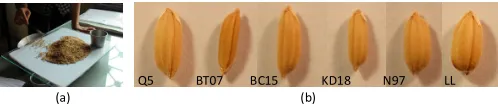
Ensuring rice seed quality is a significant challenge for the large rice export nations such as India, Thailand, US and Vietnam. Rice seed impurities can impact on the yield by introducing weeds and off-types into the crop making it susceptible to disease. The consequences are not limited to a decrease in yield but also to the grade and price of the produce. A responsibility lies with rice seed producers to ensure high quality seed and a critical procedure is the batch screening and inspection. Conventional methods to inspect seeds, as shown in Fig.1(a), rely on extracting a sample from a batch and human visual inspection. The inspection of the sample is performed visually to assess the grain properties, such as shape, length, width and size. This task is tedious, laborious, time consuming and requires trained and experienced personnel.
Recently, the cost and size of Hyperspectral Imaging (HSI) Systems has reduced significantly. This technology has emerged as a useful tool in food sciences and applications. Such systems provide spatial and textural information like other traditional cameras with the added advantage that they offer high resolution spectral signatures for each pixel in the image data acquired. In this paper, we investigate the benefits of analyzing the extracted features taken from a HSI system to solve issues of rice seed varietal purity inspection. We deploy
(a) Q5 BT07 BC15 (b)KD18 N97 LL
Fig. 1. (a) A conventional way (human visual) to inspect purity of rice seed samples. (b) Six common rice seed varieties examined in this study.
an automatic inspection method which combines hyperspectral imaging and tools from machine learning to automatically detect seeds which are erroneously contained within a batch when they actually belong to a completely different species. In this study, the purity of six common rice seed varieties, as shown in Fig.1(b), are examined.
Automatic rice seed inspection systems that employ ma-chine vision addressing this challenge have been shown in pre-vious works [1]–[3]. Commonly, shape descriptors of the seed samples are extracted through image processing and vision-based approaches [1], [3], [4]. The challenge in comparing and quantifying performance between these approaches, is that each one has been evaluated on different rice seed varieties. It is therefore unclear if the differences in performance come from better feature descriptors or if this is due to varying inter-class/intra-class among the examined species. In this study, a HSI system provides both spatial and spectral information about the seed samples. Therefore, the inspection techniques that utilize both types of feature should be investigated. We formulate the purity inspection problem as six one-versus-rest binary classifiers. In this work, the binary classifiers are built using a SVM and a RF, and both approaches are compared. While the spatial features measure physical properties of rice seed, the mean spectrum of all pixels in a seed sample can be used to infer chemical properties of the species. Thanks to discriminant analysis techniques, the combinations of both features show significant benefits and potential in hyperspec-tral imaging, particularly, to develop a machine vision system for rice seed quality assessments.
The remainder of paper is organized as follows. Section II briefly describes related techniques for rice and rice seed
[image:1.612.314.563.241.293.2]quality assessments using vision-based/HSI systems. Section III describes the device setup, data acquisitions and correc-tion procedures. Seccorrec-tion IV presents the feature extraccorrec-tion approach. Section V analyzes inter-and intra-class variations of the examined species. Section VI reports the classification results. Finally, Section VII concludes the work and suggests further research directions.
II. RELATED WORK
There are many machine vision systems for food quality evaluation. A good survey can be found in Da-Wen Sun’s textbook [5]. In Chapter 16 of this textbook, Y. Ogawa com-prehensively surveys rice grain quality evaluation techniques using computer vision technology which analyzes features such as physical property measurements and compound con-tent and distribution. Deploying such vision-based systems has been widely investigated. Lai et al. [6] applied an in-teractive image analysis method for determining the physical dimensions and classifying the variety of grains. In [7], the authors measured physical dimensions such as grain contour, size, color variance and distribution, and damage. Sakai et al. [8] demonstrated the use of two-dimensional image analysis for the determination of the shape of brown and polished rice grains of four varieties. Z.Lui et al. [1] implemented a method of identification based on neural networks to classify rice variety using color and shape features. Guzman et al. [9] investigated grain features extracted from each sample image. They then utilized multilayer artificial neural network models for automatic identification of 52 rice grains. More recent works [1]–[3] focused on rice seed variety classification. Commonly, shape descriptors of the seed samples are ex-tracted, then the classifiers such as Random Forests [3], Neural Networks [1] or Cubic B-Splines shape model [4] are trained. An automatic machine-vision system includes several stages, in which the most important steps are image data collection, feature extraction (such as shape, size, color, and orientation etc.), and feature representations via models using pattern recognition algorithms or multivariate analysis techniques.
Recently, HSI systems have been widely used in food and agriculture engineering. The authors in [10] give a broad range of HSI applications for beef, pork, fruits, and plant products quality evaluations. For the rice grain quality inspection, [11] used a range of VIS/NIR spectral (400-1000 nm) information for discriminating three rice varieties. By using Principle Component Analysis (PCA) and Back Propagation Neural Network (BPNN), they achieved a classification accuracy of 89.18 and 89.91 % for PCA and BPNN model, respectively. The authors in [12] find out that a combination of the Least squares support vector machine (LS-SVM) regression method and Vis/NIR spectroscopy at range 325-1075 nm provides a re-alizable technique to monitor the nitrogen status in rice. More recently, a HSI system has been used in [13] for identifying four rice seed cultivars. By utilizing the full spectral range 1,039-1,612 nm, they achieved very promising results, that is up to 100% accuracy with a Random Forest (RF) classifier. However, four cultivars in [13] were hybridized from other
(a) (b)
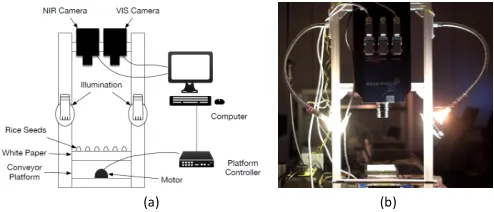
Fig. 2. Experimental setup of the data acquisition. (a) A schematic view . (b) A Photo of the real HSI system
species, therefore, it is unclear how the inter/intra class varies among them. In this paper, we extract and combine both spatial and spectral features from the hyperspectral datacube acquired by a HSI system with range of NIR spectral. We argue that the combination of features increases classification performance.
III. RICESEEDSAMPLEDATACOLLECTIONS USING A
HYPERSPECTRALIMAGINGSYSTEM
A. Hyperspectral Imaging System Setup
The experimental setup of the data acquisition system is shown in Fig.2(a). The NIR HSI system used to capture the data was the Inno-SpecTM Redeye 1.7 model (Inno-Spec
GmbH, Germany) capturing 256 wavelengths from 950.73 -1759.4 nm. The HSI device operates using a line scan where the spectral info from an entire row of pixels is captured at any given time. For this purpose, a conveyor platform (the stage) was positioned underneath the imager to allow HSI scanning. Two halogen bulbs were used to illuminate the scene and the bulbs were positioned to create balanced illumination across the scan line. To ensure repeatable data acquisitions, the halogen bulbs were switched on and allowed to reach stable operating temperature before the data were acquired in a dark room to minimise illumination variability between captures. To properly collect the data, three parameters in the HSI system needed to be adjusted:
• The exposure time of the camera (e.g., 500 ms) versus the
speed of movement of the stage (5 mm/s), which should be calibrated in order to avoid spatial distortions;
• A trade-off between the exposure time and the aperture
of camera (f=1/8) to ensure a suitable light intensity;
• The height between the lens and the stage which is
adjusted so that whole seed samples area are in field-of-view of the camera. A photo of the real HSI system is shown in Fig. 2(b).
B. Rice seed dataset acquisition
[image:2.612.316.563.50.156.2](a) At 1109.3 nm (b) At 1267.78 nm (c) At 1424.61 nm (d) Normalized wavelengths
Fig. 3. Data correction results. (a) - (c) Normalized images at specific wavelengths. (d) Profiles of the normalized wavelengths
population only contained seeds of the corresponding species. The sample population of each variety consisted of 108 seeds with 648 seeds across all varieties. The 108 samples from each species was then divided to 3 batches with 36 samples each. The 36 seeds were positioned on a white sheet of paper constructing a 6×6 matrix (e.g., as shown in Fig.3(a)-(c)), that was placed on a conveyor platform for imaging by the NIR camera. This resulted in 3 hyperspectral datacubes per variety resulting in 36 total number of the datacubes.
C. Data correction
Let y denote a datacube consisting of reflectance valuesλ
as a two-parameter set:
yλ(x), x∈X, λ∈Λ (1)
whereλrepresents a wavelength belonging toΛ, that is a set of the wavelengths at NIR (Near-Infrared) range 950.73-1759.4 nm andxrepresents a pixel inX whereX is 2-D coordinate by row m and column n. For each specific wavelength, the array of reflectance values can be regarded as an image where spatial relationships between the pixel reflectance values have meanings. For example, Fig. 3 represents three images acquired by the device at specific wavelengths of 1109.3 nm, 1267.78 nm, and 1424.61 nm. It is noticed that at each x, the raw reflectance value could vary due to different lighting conditions. To reduce the variation in the acquired reflectance values among acquisition data and scale the data relative to known max reflectance value, we normalize the raw data as below:
yλ(x) :=
yraw,λ(x)−b(n, λ)
w(n, λ)−b(λ, λ) , λ∈Λ (2)
where b(n, λ) and w(n, λ) are the reflectance values of ref-erence dark and white objects. The dark object is setup by covering the lens-cap and the white object is a white spectralon tile which is a highly reflective Lambertian scatter commonly used to calibrate HSI systems. For eachλ,b(n)andw(n)are averaged on reflectance values at column n along the white tile’s height dimension. The images shown in Fig.3(a)-(c) have been normalized. Corresponding wavelength profiles of the rice seeds are shown in Fig. 3(b).
[image:3.612.336.534.224.339.2](a) Difference Image Idiff (b) Segmented seeds
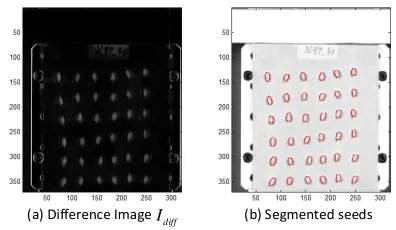
Fig. 4. The procedures separating rice seeds from background
IV. SPATIAL ANDSPECTRALFEATUREEXTRACTIONS
A. Separating seed samples from background
In the proposed system, rice seed samples need to be separated from background regions in order to allow the extraction of the physical properties of the grain as well as spectral features. However, seed segmentation is not a straightforward procedure because of artefacts such as shadow and lighting conditions. This task also suffered due low spatial resolution of the hypercubes data. Thus, we deploy a series of image processing techniques to overcome these difficulties. Firstly, we consider the difference of low-band and high-band images, as shown in Fig.3(a) and Fig.3(c), respectively, to boost contrast. This difference image Idif f differentiates between background regions and foreground ones (e.g., rice seed regions). A morphological opening operator is then applied on the difference image, named background image
Ibg. As inherited from a Top-hat transform, the foreground image If g = |Idif f −Ibg| making by subtraction Idif f and
Ibg. An example ofIf gis shown in Fig. 4(a). Comparing with original image at a specific wavelength (e.g., Fig. 3(a)-(c), the shadow and artifacts inIf g are eliminated. Consequently, a thresholding operator using Otsu’s threshold is applied on
If g. The extracted seeds are marked by the red boundary in Fig.4(b).
B. Spatial Feature extractions
se-Major Axislength Minor
AxisLength
Area Perimeter
Foci
[image:4.612.66.289.53.169.2](a) – 40 x 50 pixels (b) 630 x 900 pixels (c) Sample seed
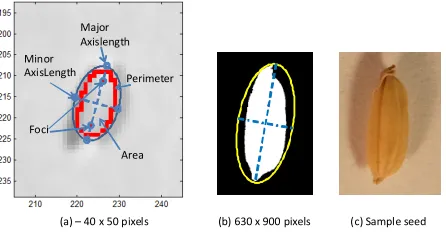
Fig. 5. Spatial feature extraction (a) on hyperspectral datacube; (b) on CCD camera. (c) Photo of a seed sample for reference
lected because of their effectiveness for discriminating among species, as shown in recent works such as [3] and [1]. A morphological feature descriptor f with 6 dimensions is calculated as follows:
• f1: is the number of pixels inside a seed sample
• f2, f3: are MajorAxisLength and MinorAxisLength that
specify the length (in pixels) of the major/minor axis of the ellipse that covers the boundary of the sample seeds.
• f4=M inorAxisLength
M ajorAxisLength and
• f5 = P erimeterArea , where P erimeter is number of pixels
along the seed boundary; andAreaisf1 feature.
• f6 = M ajorAxisLengthF ociDistance is eccentricity specified by
F ociDistance which is the distance between two foci
of the ellipse, and the major axis length.
These features are illustrated in Fig. 5(a). Note that different from [3], the HSI camera gives a low resolution spatial image of each seed (e.g., 40 x 50 pixels) versus seed samples collected from high resolution CCD camera [3] (e.g., 630 x 900 pixels, as shown in Fig. 5(b)-(c)). This difference degrades the discrimination ability between the rice species when using only spatial features.
C. Spectral feature extractions
A hyperspectral datacube consists of spectral information from every pixel of the seed regions. The mean spectrum of all pixels in such regions is used as spectral features. In this paper, for each seed, spectral profiles of one rice seed species are shown in Fig. 3(d). As denoted in (2), a raw spectral feature vector of a rice seed sample is a set of yλ in which λ is one of 256 bands belonging a range
Λ = 950.73−1759.4nm. Fig 7(a)-(b) shows the spectral features of two seed samples. The mean spectrum over seed regions are shown in the corresponding profiles in right panels. Dimensionally reduction is widely applied in spectral data analysis due to the redundancy and co-linearity of spectral data. This also facilitates the construction of simple, stable and practical classification models. To do so, Principal Component Analysis (PCA) has been widely used with large datasets like the collected datacube. PCA helps to transform the original data into a small number of uncorrelated variables. A PCA transformation is applied on the spectrum profile of the whole collected data:
[image:4.612.325.556.55.163.2](a) (b)
Fig. 6. PCA reconstruction using the first ten components. (a) Overlapping the original wavelength and the reconstructed profiles of a seed sample. (b) A closed-up version. Blue line is original data; red line is reconstructed data
s1
s2
.. .
s648
=
fλ1 fλ2 . . . fλ256 fλ1 fλ2 . . . fλ256
· · ·
fλ1 fλ2 . . . fλ256
Results of PCA provide a mean µΘ and eigenvectors νΘ.
Given the normalized datacube yΛ, the projected data in a
PCA space is defined by:
yΛ→fpc1,pc2,..,pc10:νΘT(cλ−µΘ) (3)
The first few principal components (PCs) can be used to explain most of the sample data, which results in the data dimension reduction. In our dataset, the first ten PCs (fpc1, .., fpc10) can reconstruct 99% original data. The
con-sistency of the reconstructed data using first ten PCs versus all of the original data is illustrated in Fig. 6. Therefore, the first ten PCA-based features rather than entire spectral data are utilized as spectral features for each seed sample to build and apply classification models.
V. DISCRIMINANT ANALYSIS AND CLASSIFICATION
A. Species discrimination using spectral features
(a) Q5
Q5 Q5
[image:5.612.55.563.52.162.2]N97 (b)
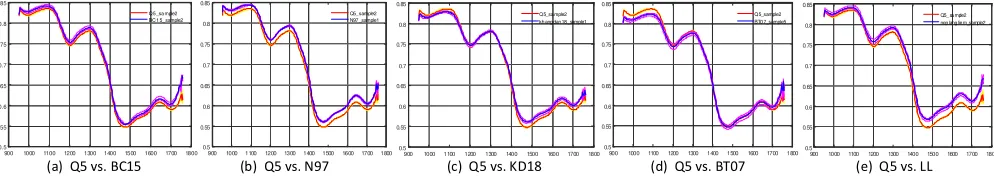
Fig. 7. Discriminant analysis examples. (a) Two seeds of same species. (b). Two seeds from different species. On (a)-(b) Left panel: detailed wavelength profiles; Right panel: Averaged wavelength profiles. Photos of the rice seed samples for references
900 1000 1100 1200 13001400 1500 1600 17001800 0.5
0.55 0.6 0.65 0.7 0.75 0.8 0.85
Q5 _sa mple2 BC 1 5_ sample2
900 10001100 1200 130014001500 1600 17001800 0.5
0.55 0.6 0.65 0.7 0.75 0.8 0.85
Q5_ sample2 N97 _sample1
900 1000 1100 1200 1300 1400 1500 1600 1700 1800 0.5
0.55 0.6 0.65 0.7 0.75 0.8 0.85
Q5_sa mple2 kh ang dan 18 _sample1
900 1000 1100 1200 1300 1400 1500 1600 1700 1800 0.5
0.55 0.6 0.65 0.7 0.75 0.8 0.85
Q5_sample2 BT0 7_sample5
900 1000 1100 1200 1300 1400 1500 1600 1700 1800 0.5
0.55 0.6 0.65 0.7 0.75 0.8 0.85
Q5_ sa mple2 nep lang lie m_sample2
(a) Q5 vs. BC15 (b) Q5 vs. N97 (c) Q5 vs. KD18 (d) Q5 vs. BT07 (e) Q5 vs. LL
Fig. 8. Comparison wavelength profiles of a species (Q5) with others. The analysis utilized the hyperspectral datacubes of six examined rice seed species
B. Building Classifiers
Utilizing the spatial, and spectral features, as well as their combination, we build classifiers that come from two different classification methods.
Random Forestis a machine learning algorithm combining
a ’bagging’ idea and a "random subspace method". A RF classifier contains many decision trees, and each tree is grown from a bootstrap sample of the response variable. The best split is selected from a random subset of variables at each node of the tree, and then the tree grows to the maximum extent without pruning. Prediction can be made from new data by aggregating the outputs of all trees. RF is a fast and effective algorithm for dealing with a large amount of data. RF has shown the advantages that it reduces variance and achieves comparable classification accuracy. In this study, number of the decision trees is equal 500.
Support Vector Machineis a widely used supervised
sta-tistical learning algorithm. SVM shows advantages in dealing with small sample, non-linear and high dimensional data. SVM is based on the structural risk minimum (SRM) and SVM has high generalization capacity and could provide a flexible and easy-to-compute solution. Selection of the kernel function in SVM models has a significant influence in model performance, and in this study, the commonly used Radial Bias Function (RBF) is employed as kernel function.
VI. EXPERIMENTAL RESULTS
We evaluate the performance of each set of features (spatial, spectral individually, and their combination) on the collected dataset, as described in Section III-B . The feature extraction procedures were implemented using Matlab on a PC Core i5 3.10GHz CPU, 4GB RAM. The LibSVM library [14]
and a Random Forest Library [15] were adopted to build classifier models. To validate the proposed method, leave-p -out-cross-validation was utilized. For each classifier, 50 seed samples were collected randomly as positive samples, the negative samples were collected from all other species so that total negative samples are equal 50 (in other words, 10 from each other species). To evaluate the performance, two criteria measures are defined in (4). The performance criteria are calculated by averaging over 10 runs.
P recision(P) = tp
tp+f p, andRecall(R) = tp
tp+f n (4)
wheretpis the number of true positive,f pis the number of the false positive,tnis the number of true negative andf nis the number of false negative.
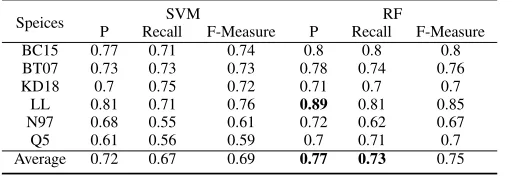
The performance of the classifiers using only the spatial features (f = f1, .., f6) is given in Table I. As shown, the
RF classifier is slightly better than the SVM and the best performance is achieved with the LL species. Utilizing only the raw spectral data, Table II shows higher performances for
BT07, KD18, LL, N97than that using only spatial features.
[image:5.612.55.552.210.299.2]TABLE I
SPATIAL FEATURE PERFORMANCES
Speices P RecallSVMF-Measure P RecallRF F-Measure
BC15 0.77 0.71 0.74 0.8 0.8 0.8
BT07 0.73 0.73 0.73 0.78 0.74 0.76
KD18 0.7 0.75 0.72 0.71 0.7 0.7
LL 0.81 0.71 0.76 0.89 0.81 0.85 N97 0.68 0.55 0.61 0.72 0.62 0.67
Q5 0.61 0.56 0.59 0.7 0.71 0.7
Average 0.72 0.67 0.69 0.77 0.73 0.75
TABLE II
SPECTRAL FEATURE PERFORMANCES
Speices SVM RF
P Recall F-Measure P Recall F-Measure BC15 0.75 0.27 0.39 0.67 0.66 0.66 BT07 0.98 0.53 0.69 0.86 0.83 0.84 KD18 0.91 0.6 0.72 0.82 0.85 0.83 LL 0.69 0.91 0.78 0.82 0.82 0.82 N97 0.78 0.58 0.67 0.8 0.79 0.79 Q5 0.65 0.43 0.52 0.73 0.74 0.74 Average 0.79 0.55 0.63 0.78 0.78 0.78
VII. CONCLUSION ANDDISCUSSION
Conclusion: This paper describes a HSI system supporting rice seed varietal purity inspection. The proposed system combines a hardware camera setup and a tool for extracting features from the collected hyperspectral datacubes. We have confirmed that by taking advantage of a HSI system on both spatial and spectral features, we achieve very promising results on eliminating impurity species from large seed samples.
Discussion: Utilizing similar spatial features, [3] reported 90% precision on using a RF classifier. That results are higher than that shown in Table I. However, the imaging acquisition used in [3] is a high resolution camera. As shown in Fig 5(b), the shape properties of the segmented seeds therefore are described more precisely in [3] than the seed samples collected by our HSI system. This observation suggests us a new imaging modality in the future. Going forward, we will combine data from registered high resolution images from a CCD camera with spectral images from HSI sensor to improve upon work of [3].
A map of the spatial distribution of the chemical con-stituents in a rice seed sample can be generated from spectral data. There are evidences given in [16] in which intuitive chemical components in wheat kernels is observable by a HSI system. Therefore, we believe that utilizing the spectral data at each pixel rather than mean spectrum on all of the pixels of the seed regions can be useful to investigate internal features of a seed. Consequently, visually discriminating two different species will be better.
ACKNOWLEDGEMENTS
The authors are thankful to the Newton Research Collabora-tion Programme (NRCP1516/1/65) for the financial support.
TABLE III
SPATIAL AND FULL BANK SPECTRAL FEATURECOMBINATIONS
Speices P RecallSVMF-Measure P RecallRF F-Measure BC15 0.75 0.47 0.58 0.71 0.72 0.71 BT07 0.81 0.66 0.73 0.87 0.85 0.86 KD18 0.76 0.73 0.74 0.86 0.87 0.86 LL 0.71 0.56 0.63 0.88 0.84 0.86
N97 0.81 0.48 0.6 0.8 0.81 0.8
Q5 0.65 0.51 0.57 0.76 0.79 0.77 Average 0.75 0.57 0.64 0.81 0.81 0.81
TABLE IV
SPATIAL AND10 PCA-BASED FEATURESCOMBINATIONS
Speices SVM RF
P Recall F-Measure P Recall F-Measure BC15 0.73 0.69 0.71 0.78 0.83 0.81 BT07 0.8 0.69 0.74 0.87 0.89 0.88 KD18 0.77 0.72 0.74 0.92 0.89 0.9
LL 0.8 0.73 0.76 0.89 0.87 0.88 N97 0.73 0.53 0.61 0.81 0.82 0.82 Q5 0.62 0.55 0.58 0.74 0.75 0.75 Average 0.74 0.65 0.69 0.84 0.84 0.84
REFERENCES
[1] Z.-y. Liu, F. Cheng, Y.-b. Ying, and X.-q. Rao, “Identification of rice seed varieties using neural network,” Journal of Zhejiang University. Science. B, vol. 6, no. 11, pp. 1095–1100, 11 2005.
[2] A. G. OuYang and R. j. Gao et al., “An automatic method for identifying different variety of rice seeds using machine vision technology,” in2010 Sixth Int. Conf. on Natural Computation, vol. 1, Aug 2010, pp. 84–88. [3] P. T. T. Hong and T. T. T. H. et al., “Comparative study on vision based rice seed varieties identification,” in Knowledge and Systems Engineering (KSE), 2015 Seventh Int. Conf. on, Oct 2015, pp. 377–382. [4] C. Peralta, “Modeling shapes using uniform cubic b-splines for rice seed image analysis,” in2016 Sixth International Conference on Communi-cations and Electronics, July 2016.
[5] D.-W. Sun,Computer Vision Technology for Food Quality Evaluation. Elsevier, 2008.
[6] F. Lai, I.Zayas, and Y.Pomeranz, “Application of pattern recognition techniques in the analysis of cereal grains,”Cereal Chemistry, vol. 63, no. 2, pp. 168–172, 1982.
[7] D. Goodman and R. Rao, “A new, rapid, interactive image analysis method for determining physical dimensions of milled rice kernels,” Journal of Food Science, vol. 49, no. 2, pp. 648–649, 1984.
[8] N.Sakai, S.Yonekawa, A.Matsuzaki, and H.Morishima, “Twodimen-sional image analysis of the shape of rice and its application to separating varieties,”Journal of Food Engineering, vol. 27, pp. 397–407, 1996. [9] D. J. Guzman and P. Engelbert, “Classification of philippine rice grains
using machine vision and artificial neural networks,” inWorld conference on Agricultural information and IT, 2008.
[10] G. Barbosa-Canovas, Hyperspectral Imaging Technology in Food and Agriculture. Springer, 2015.
[11] L.Wang and D.Liu, “Use of HSI imaging to discriminate the variety and quality of rice,”Food Anal. Methods, vol. 8, pp. 515–523, 2015. [12] Y. Shao, C.Zhao, Y.Bao, and Y.He, “Quantification of nitrogen status
in rice by least squares support vector machines and reflectance spec-troscopy,”Food Bioprocess Technol, vol. 5, pp. 100–107, 2012. [13] W. Kong, C. Zhang, F. Liu, P. Nie, and Y. He, “Rice seed cultivar
identification using near-infrared hyperspectral imaging and multivariate data analysis,”Sensors, vol. 13, no. 7, p. 8916, 2013.
[14] C. Chang and C. Lin. (2016, May) Libsvm – a library for support vector machines. [Online]. Available: https://www.csie.ntu.edu.tw/ cjlin/libsvm/ [15] A. Liaw. (2016, May) Classification random forest. [Online]. Available:
http://cran.r-project.org/web/packages/randomForest