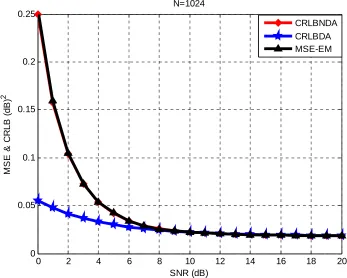
Signal to noise ratio estimation using the Expectation Maximization Algorithm
Full text
Figure

Related documents
This program introduces high school students to complex corporate transactions, takes them on enrichment trips to visit corporations, and hosts monthly meetings to revisit curriculum
Hence, instrumenting the 5-year UK rate by surprises of SS Futures around minutes and inflation reports make sense and provide information around the financial channel of
Provide opportunities for clients to develop and practice relaxation and stress management skills.. Daily Education Group Class- Life, Interpersonal, Addictions Information
This paper examines why fiscal policy is procyclical in developing as well as developed countries. We introduce the concept of fiscal transparency into a model of retrospective
Although the temperature used in the reactive deposition experiments of the bimetallic materials (200ºC) was generally lower than the temperatures employed in the
During the critical Encoding/Maintenance period, activity on trials with the highest level of accuracy (3 or 4 correct) is higher than trials with lower levels of accuracy.
specification covers the requirements for hot-dip zinc coating applied to carbon steel and alloy steel bolts, screws, washers, nuts, and special threaded fasteners applied by
The proposed detection strategy considers the distance between an ob- served pixel and the hyperplane spanned by the endmembers to de- cide whether that pixel satisfies the
