City, University of London Institutional Repository
Citation
:
Pawar, P. S., Rajarajan, M., Nair, S. K. and Zisman, A. (2012). Trust Model for
Optimized Cloud Services. IFIP Advances in Information and Communication Technology,
374, pp. 97-112. doi: 10.1007/978-3-642-29852-3_7
This is the unspecified version of the paper.
This version of the publication may differ from the final published
version.
Permanent repository link: http://openaccess.city.ac.uk/1606/
Link to published version
:
http://dx.doi.org/10.1007/978-3-642-29852-3_7
Copyright and reuse:
City Research Online aims to make research
outputs of City, University of London available to a wider audience.
Copyright and Moral Rights remain with the author(s) and/or copyright
holders. URLs from City Research Online may be freely distributed and
linked to.
City Research Online:
http://openaccess.city.ac.uk/
[email protected]
Trust Model for Optimized Cloud Services
P. S. Pawar1,2, M. Rajarajan1, S. Nair2, T. Dimitriakos2, A. Zisman1
1 City University London, London EC1V 0HB, United Kingdom [email protected], [email protected] 2 British Telecommunications, Security Practice, Adastral Park, Ipswich IP5 3RE, UK
{pramod.s.pawar, srijith.nair, theo.dimitrakos}@bt.com
Abstract – Cloud computing with its inherent advantages draws attention for
business critical applications, but concurrently expects high level of trust in cloud service providers. Reputation-based trust is emerging as a good choice to model trust of cloud service providers based on available evidence. Many exist-ing reputation based systems either ignore or give less importance to uncertain-ty linked with the evidence. In this paper, we propose an uncertainuncertain-ty model and define our approach to compute opinion for cloud service providers. Using sub-jective logic operators along with the computed opinion values, we propose mechanisms to calculate the reputation of cloud service providers. We evaluate and compare our proposed model with existing reputation models.
Keywords. Cloud, Trust, Reputation, SLA, Subjective logic
1
Introduction
Cloud computing has been recognised as an important new paradigm to support small and medium size businesses and general IT applications. The advantages of Cloud computing are multifold including better use and sharing of IT resources, unlimited scalability and flexibility, high level of automation, reduction of computer and software costs, and access to several services. However, despite the advantages and rapid growth of Cloud computing, it brings several security, privacy and trust issues that need immediate action. Trust is an important concept for cloud computing given the need for consumers in the cloud to select cost effective, trustworthy, and less risky services [2]. The issue of trust is also important for service providers to decide on the infrastructure provider that can comply with their needs, and to verify if the infrastructure providers maintain their agreements during service deployment time.
The aim of the Service Provider (SP) is to offer efficient services to its customers using resources of the Infrastructure Provider (IP). The IP aims to maximize its profit by efficient use of its infrastructure resources ensuring that it provides good service to the SP and meeting all its requirements. The trust framework is active during the service deployment and service operation phases. The trustworthiness of the IP and the SP are monitored during these two phases of the service life cycle.
The scope and focus of this paper is mainly to evaluate the trustworthiness of the IP performed by the SP. During the service deployment phase, the objective of the SP is to select the most suitable IP for hosting its service based on the degree of trust expected from an IP. During the service operation phase, the SP monitors the IP’s trust level and takes corrective actions. An example of an action is to select an alter-native IP when the trust level of the IP is unacceptable, based on a negotiated level.
The trust model described in this paper calculates trust values based on three dif-ferent parameters, namely (i) compliance of SLA parameters (e.g., when the IP fulfils the quality aspect specified in the SLA between an SP and the IP), (ii) service and infrastructure providers satisfaction ratings (e.g., when SP supplies a rating for the IP where the SP is being deployed), and (iii) service and infrastructure provider behav-iour (e.g., if the SP continues to choose the same IP independent of the rating that it has supplied for the IP). In the model, the satisfaction values can be either explicitly provided in terms of ranking measurements, or inferred based on relationships between the service and infrastructure providers, and behaviour of the providers in terms of constant use of services, service providers, and infrastructure providers.
For each of the different parameters above, trust values are calculated based on an opinion model [8]. As in the case of [8][17], we have developed an opinion model that considers belief, disbelief, and uncertainty values. Our model is based on an extension of the Josang’s opinion model [8], in which we consider uncertainty when calculating belief and disbelief values. In [8], uncertainty is considered based on the amount of evidence, in which uncertainty increases if the amount of evidence decreases. As in the case of [17], in our model uncertainty is considered based on the amount of evidence and on the dominance that exist between the positive and negative evidences. If the number of positive (belief) evidences is closer to the number of negative (disbelief) evidences, the uncertainty about the proposition increases. For example, if the number of times that an infrastructure provider (IP1) violates a quality property is the same as the number of times that IP1 does not violate the same property, the level of uncertainty of IP1 for that property increases.
In our model, as in the case of [17], but contrary to [8], the belief and disbelief values also consider uncertainty. The difference between our model and the model in [17] is with regards to how uncertainty is being calculated. In [17], certainty is calculated as a Probability Certainty Density Function (PCDF) which is the probability density function of the probability of positive experience. When there is no knowledge the uniform distribution has certainty of zero and as the knowledge increases the probability mass shifts, deviating from the uniform distribution, increasing the certainty towards one.
2
Cloud Computing Example Scenario
In order to illustrate the work described in the paper, we present a Cloud computing education application that is being deployed for Bristish Telecom customers such as Universities and other education institutions. The education application allows Universities and education institutions to have virtual laboratory environments for students, staff, and all other members of the institutions hosted over the cloud, providing access to the institution’s applications, desktops, and servers.
The key features of the application includes: i) flexibility to work from anywhere and anytime allowing the users to access the desktop and corporate applications from any PC, MAC, thin client or smartphone; ii) reduction of desktop management cost and overhead enabling the IT department to add, update, and remove applications in an easy way; iii) provision of good data security, good access control, and scalable storage platforms; iv) provision of scalability and elasticity for compute resources; v) comprehensive monitoring and management solutions to support use and capacity planning and space usage; and vi) backup and recovery functions. The application has several components, namley: web interface, active directory, idesktop delivery controller (DDC), virtual machines, and storage. The web interface passes credentials of the users to the desktop delivery control, which authenticates the users against the active directory. The virtual machine is the virtual desktop and provides access to end users with all the details of the connections.
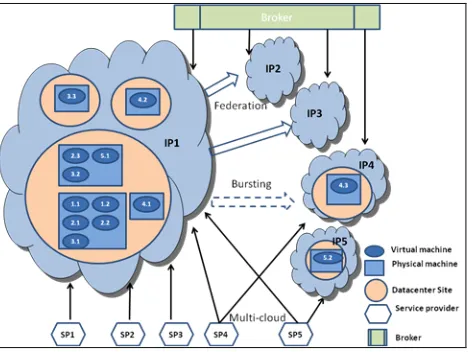
For evaluating our proposed model we consider a scenario in the education application with five Service Providers (SPs) and five Infrastructure Providers (IPs). An SP hosts the application with its multiple components either at one IP or at multiple IPs. The SP may also use a broker for the IP services. This example scenario considers that all the SPs host education applications. Fig. 1 shows the education application deployed by vairous SPs. As shown in the figure, each IP has multiple datacenter sites which may be geographically distributed. Each of these datacenters can have a large number of physical hosts/machines available with capabilities to execute multiple virtual machines.
Option 3: The application is deployed in a single IP’s administration boundary (restrict usage of federation resources). SP1, SP2 and SP3 have all its virtual machines in the administration boundaries of IP1.
[image:5.595.182.418.215.391.2]Option 4: The application is dployed in more than one IP. SP4 and SP5 deploy the application in IP1, IP4 and IP1, and IP5, respectively.
Fig. 1. Cloud computing educational application example
Several other deployment scenarios are possible, but for illustrative purpose we will concentrate on the above situations. Although Fig. 1 shows that SP1, SP2 and SP3 have currently deployed applications on only IP1, it is possible that they may have used other IPs (IP2, IP3, IP4 and IP5) in the past. Similarly, IP4 and IP5 have also used other IPs other than the current ones.
3
Trust Model
As described in Section 1, Trustworthiness of an IP is modelled using opinion ob-tained from three different computations, namely (i) compliance of SLA parameters (SLA monitoring), (ii) service provider satisfaction ratings (SP ratings), and(iii) ser-vice provider behaviour (SP behaviour). The opinion is expressed in terms of belief,
disbelief, uncertainty and relative atomicity extending subjective logic [8]. The opinion of an entity (SP or IP) A for a proposition x is given as WA
x = (b Ax, d A
x, u Ax, a Ax), where b Ax is the belief in the proposition, d Ax is the disbelief in the
prop-osition, u A
x is the uncertainty of the proposition, aAx is relative atomicity that provides
the weight of uncertainty that contributes to the probability expectation. All bx, dx, ux,
ax Є [0.0, 1.0], and bx+dx+ ux=1.
The trustworthiness (T) of an IP is modelled as the expectation of the combined opinion of all the three computations. The opinions are combined using the conjunc-tion operator, consensus operator, and the discounting operator in the subjective logic [8], as defined below:
T = Expectation (W(SPB SPR )Ʌ SLA) (1) W(SPB SPR ) Ʌ SLA = (WSPB WSPR )Ʌ WSLA
where WSLA, WSPR, WSPB are opinions obtained from the SLA monitoring (SLA), SP
ratings (SPR), and SP behaviour (SPB) values, respectively. The symbol Ʌ is the con-junction operator used to combine the opinions, and is the discounting operator
used as the recommendation operator. If Wx = (bx, dx, ux, ax) and Wy = (by, dy, uv, ay),
then WxɅy = (bxɅy, d xɅy, u xɅy,, a xɅy).
Consider A and B two agents, where WAB = (b AB, d AB, u AB, a AB) is A’s opinion
about B’s advice, and let x be the proposition where WB
x = (b Bx, d Bx, u Bx, a Bx) is B’s
opinion about x expressed as an advice to A. In this case, WAB
x is called the
discount-ing ( ) of WBx by WAB and is given as WABx = WAB WBx = (b ABx, d ABx, u ABx, a ABx).
Opinion representation. For aproposition x, the opinion is given by
Wx = (bx, dx, ux, ax) , with
bx = c r / t (2) dx = c s / t (3) ux = t / (r s + f2 + 1) (4) c = 1 - ux (5)
where: r is the amount of positive evidence; s is the amount of negative evidence; t is the total evidence given as t=r+s; c or c(t) is the certainty based on the evidence, that is a function of the total evidence that can also be given as c(r,s); and f is the distance of focus to the centre of an ellipse.
The proposed opinion model considers two aspects of uncertainty due to the evi-dence at hand, namely: i) as the amount of evievi-dence increases the uncertainty reduces; and ii) in a given total evidence, as the positive or negative evidence dominates, the uncertainty decreases, and as the positive and negative evidence equals, the uncertain-ty increases. These two aspects of uncertainuncertain-ty exhibit behaviour similar to the proper-ties of an ellipse, considering its size and shape, controlled by its axis and area.
axis. As the positive and negative evidence is being mapped to the major and minor axis of ellipse, the increase in the major and minor axis results in the increase of the size of ellipse and decrease of the uncertainty. The second aspect of uncertainty is due to dominance between positive and negative evidence, which is captured using the shape of an ellipse. The shape of an ellipse is a function of its two axis. The positive and negative evidence being mapped to the axis of an ellipse, as the major axis con-tinues to dominate, the distance of focus with the centre is a positive value and as the two axis equals, this distance approaches to zero, transforming to a circle.
The change in major and minor axis affects the distance of focus with the centre which is given as f = sqrt ( a2 -‐ b2). The major and minor axis of an ellipse is mapped
to the positive and negative evidence. If the total evidence is fixed to a constant, the variation of the positive and negative evidence affects the shape of the ellipse. If the positive and negative evidence equals, this makes f = 0, transforming the ellipse to a circle. This adds to a highest uncertainty in a given total evidence. As the positive and negative evidence continues to dominate, this leads to a positive value for f and this value is maximum when either positive or negative evidence in the total evidence is zero. This adds to a lowest uncertainty in a given total evidence. Both properties of uncertainty are captured in the uncertainty definition below:
u = t / (r s + f2 + 1) for t≥1 and u = 1 for t < 1 (6)
where r is the amount of positive evidence; s is the amount of negative evidence; t is the total evidence given as t=r+s; and f is the distance of focus to the centre of an ellipse given as f = sqrt (r2 -‐ s2) considering r > s; The certainty in the opinion model and the expectation of the opinion about a proposition x is given as:
c(t) = 1 – u (7) E(x) = bx + axux (8)
where c(t) is the function of total evidence t and can also be represented as a function of positive and negative evidence given as c(r,s). The opinion model uses certainty
c(t) to model the belief, disbelief and uncertainty.
SLA Monitoring. The SLA monitoring determines the opinion about an IP from the SLAs that the IP have established with the SPs for their services. The SP for each of its service has a single SLA that includes several indicators (e.g.; cpu, memory, disk space, number of virtual machines (vms)). For each indicator of an SLA, there is an associated monitor that evaluates the compliance/non-compliance of the indicator.
The SLA monitoring opinion about an IP is a two-step process. In the first step, a
consensus opinion is created for an indicator type (e.g.; cpu) based on in formation from all the monitors verifying the compliance of the indicator. This opinion indi-cates the trust of an IP only based on the indicator used to create the consensus opin-ion. In the second step, a conjunction opinion is created about the IP for either a set of indicators or for all the indicators based on the requirement. The conjunction opin-ion indicates the trust of an IP for the set of indicators based on SLA monitoring.
Consider that there are m indicator types and n monitors associated with each in-dicator type. In this case, the opinion of the SLA monitoring is given as:
where, W1 (M1,1), (M1,2),(M1,3),…,(M1,n) is the consensus opinion for the indicator type ‘1’
given by monitors M1,1 to M1, n belonging to different SLAs. If WA
x = (b Ax, d Ax, u A
x,a Ax) and WBx = (bBx, dBx, uBx,aBx) are the opinions given by agent A and agent B,
respectively for the same proposition x, then the consensus opinion is given as in [8] by:
W
A,Bx= W
AxW
Bx= (b
A,Bx, d
A,Bx, u
A,Bx,a
A,Bx)
Example. In order to illustrate, consider the education application described in Sec-tion 2. Suppose that towards the end of the academic year most Universities require the students to do individual projects. Some of these projects may need a high compu-tational resource such as large numbers of virtual machines, memory space, CPU, and disk space. For each of the Universities the requested resource to the SP is within the agreed SLA. The SP demands resources from the IP. As in the example scenario, since IP1 have all five SPs hosting the education application, the demand to increase the resources occurs almost in the same time frame. Given the constraint that IP1 cannot acquire resources from other IPs for these applications, there is a violation of the SLA after verifying that IP1 has no additional resource of its own to be provided.
In the scenario IP1 has five SLAs, with each of the SPs (SP1 to SP5) for four dif-ferent indicator types (cpu, memory, disk, and virtual machine). Assume SLA1 with SP1, SLA2 with SP2, and so on. Consider the existence of monitors associated with each indicator of the SLAs. Assume four monitors (M1, M2, M3 and M4) to be asso-ciated with SLA1 for cpu, memory, disk space, and virtual machine, respectively. Similarly, monitors M5 to M8, M9 to M12, M13 to M16 and M17 to M20 are associ-ated with SLA2, SLA3, SLA4 and SL5, for the various SLA indicators.
Each of the monitors associated with the indicators provides information about the compliance of the respective indicator for an IP. If we consider that monitors M1, M2, M3 and M4 indicated 150 compliances and 10 non-compliance (150 positive evidence and 10 negative evidence) for IP1. The opinions given by the monitors for SLA1 are calculated using the proposed opinion model as :
WCPUM1=(bM1CPU, d M1CPU, u M1CPU) =(0.93122, 0.062082, 0.006694)
WmemM2= WdiskM3 = WvmM4= (0.93122, 0.062082, 0.006694)
If we consider that all the other monitors M5-M20 associated with SLA2, SLA3, SLA4 and SLA5 also have 150 compliance and 10 non-compliance indicators, the opinion provided by these monitors are the same as the above ones.
The opinion for an IP1 with respect to cpu is given as the consensus opinion of the five monitors M1, M5, M9, M13 and M17 as follows:
WCPUM1,M5,M9,M13,M17= (bM1,M5,M9,M13,M17CPU, d M1,M5,M9,M13,M17CPU, u M1,M5,M9,M13,M17CPU) =
(0.936238, 0.062416, 0.001346)
Similarly, the opinion obtained for IP1 based on memory, disk and virtual machine is: WmemM2,M6,M10,M14,M18 = WdiskM3,M7,M11,M15,M19 = WVMM4,M8,M12,M16,M20
=(0.936238, 0.062416, 0.001346)
The overall opinion for IP1 based on all the indicators of the SLAs is given as the conjunction opinion of all consensus opinions for each of the indicator as follows: WSLA = WCPUM1,M5,M9,M13,M17 Ʌ WmemM2,M6,M10,M14,M18 Ʌ WdiskM3,M7,M11,M15,M19 Ʌ
SP Behavior. The SP behaviour is defined in terms of the number of times the SP has used the infrastructure of an IP against the SPs total usage. An SP using a single IP for the majority of the times indicates the SPs good behaviour towards an IP. The SP may use the infrastructure of an IP for one or more indicators specified in the SLA.
Consider that there are m indicator types that the IP has negotiated from all the ‘q` SPs in the past. Let there be m monitors associated with each of the SPs to monitor how many times the SP used this IP for a given indicator, against its total usage for that indicator. Suppose that SP1 used IP1 five times, IP2 three times, and IP3 four times for cpu usage. This indicates that for cpu total usage of 12 times, SP1 has used IP1 five times. This information is used to model the opinion of SP1’s behaviour to-wards IP1 for cpu usage. Assume monitor M1,1 associated with the indicator of type ‘1’ to monitor SP1’s behaviour towards IP1. In this case, the opinion is represented as WSP1M1,1. A single overall behaviour of an SP towards an IP is given as a consensus
opinion of all its indicators. The behaviour of SP1 towards IP1 is given as:
(WSP1M1,1 WSP1 M2,1 W SP1 M3,1 …. W SP1 Mm,1 )
All ‘q’ behaviour of SP towards an IP is given as the conjunction opinion as:
WSPB = (WSP1M1,1 …. W SP1 Mm,1 ) Ʌ … Ʌ (WSPqM1,q …. W SPqMm,q ) (10)
Example. In order to illustrate consider the education application described in Section 2 with monitors M1, M2, M3 and M4 verifying the compliance of the cpu, memory, disk and virtual machine usage, respectively, for SP1, and monitors M6-M8, M9-M12, M13-M16, and M17-M20 for SP2, SP3, SP4 and SP5. Suppose that monitor M1 associated with SP1, records that SP1 has opted to use IP1 for 200 times against SP1’s 250 times total cpu usage. The opinion for the behaviour of SP1 towards IP1 for cpu usage is calculated as:
WSP1M1=(b M1 SP1, dM1 SP1, uM1 SP1)= (0.79579, 0.198947, 0.005263).
Similarly, assume that M2, M3 and M4 record the same usage as M1 for memory, disk space, and virtual machine, respectively. The opinions are calculated as:
W SP1M2= W SP1M3= W SP1M3= W SP1M4 = (0.79579, 0.198947, 0.005263)
Consider that SP2 and SP3 have the same evidence as in the case of SP1, with the associated monitors for these SPs providing evidences as monitors M1, M2, M3 and M4. Consider SP4 with monitors M13-M6 and SP5 with monitors M17-M20 using other IPs different from IP1 for its resources consumption. Assume the monitors for SP4 and SP5 provide 100 positive evidences and 150 negative evidences for each of its indicators. This evidence is transformed to the opinions below:
WSP4M13=WSP5M17=WSP4M14=WSP5M18=WSP4M15=WSP5M19=WSP4M16= WSP5M20 =(0.39636,
0.594546, 0.009091)
The behaviour of SP1 towards IP1 (and of SP2 and SP3) are calculated as:
The behaviour of SP4 and SP5 towards IP1 based is given as:
WSP4M13M14M15M16 = WSP5M17M18M19M20 = (0.399085, 0.598627, 0.002288)
The total SPs behaviour towards an IP is given as the conjunction opinion of all SPs towards a single IP, given as:
WSPB = WSP1M1…M4ɅWSP2M5…M8ɅWSP3M9…M12ɅWSP4M13…M16ɅWSP5M17…M20 =
(0.081223, 0.917435, 0.001342)
SP ratings. The service provider satisfaction rating is calculated based on the rates of the services given by an SP using an IP. The SP may provide separate ratings for each SLA indicators of the IP’s services. The ratings are used to form an opinion about an IP. Similar to the other cases, the computation of SP ratings to provide an opinion about an IP is based on consensus and conjunction ratings. Consider q SPs available and each of these SPs providing its opinion for one or more of the m indicator types that the IP supports. The service provider satisfaction rating is calculated as:
WSPR = W1SP1,SP2…,SPq Ʌ W2SP1,SP2…,SPq Ʌ … Ʌ WmSP1,SP2…,SPq (11)
where, WiSP1,SP2…,SPq is the consensus opinion for indicator type ‘i’ from SP1 to SPq.
Example. As an example, suppose that SP1 has provided 100 excellent and 5 worst ratings for each of cpu, memory, disk, and virtual machine indicators. These ratings are transformed into 100 positive and 5 negative evidences for each of these indica-tors, as per the mapping described above. Based on the evidence of ratings for IP1, the opinion that SP1 has about IP1 for its indicators is given as:
WCPUSP1=(b SP1CPU, dSP1CPU, uSP1CPU) = (0.94284, 0.047142, 0.010023)
WmemSP1= WdiskSP1= WvmSP1= (0.94284, 0.047142, 0.010023)
Suppose that SP2, SP3, SP4 and SP5 have provided (200 excellent, 5 worst), (200 excellent, 10 worst), (200 excellent, 20 worst), (200 excellent, 30 worst) ratings, re-spectively for IP1 for each of the four different indicators. These evidences provide the following opinions of SP2, SP3, SP4 and SP5 about IP1, calculated as:
WCPUSP2= WmemSP2= WdiskSP2= WvmSP2= (0.97073, 0.024268, 0.005003)
WCPUSP3= WmemSP3= WdiskSP3= WvmSP3= (0.94761, 0.04738, 0.005012)
WCPUSP4= WmemSP4= WdiskSP4= WvmSP4= (0.90450, 0.09045, 0.005046)
WCPUSP5= WmemSP5= WdiskSP5= WvmSP5= (0.86513, 0.12977, 0.0051)
The capability of IP1 for cpu, memory, disk, and virtual machine are given as the consensus of all SP’s opinion by:
WCPUSP1 WCPUSP2 WCPUSP3 WCPUSP4 WCPUSP5 = (0.928743, 0.070133, 0.001124)
Wmem SP1…SP5 = Wdisk SP1…SP5 =WVM SP1…SP5 = (0.928743, 0.070133, 0.001124)
The overall opinion formed for IP1 based on the ratings from the SPs is given as:
SP ratings discounted by SP behavior. The proposed trust model uses the behaviour of the SP for discounting the opinion provided by the SP in SP ratings, for a particular indicator. More specifically, in the SP ratings, if SP1 is evaluating IP1 and is informed about the opinion of IP1 from SP2 regarding cpu indicator, this opinion of SP2 is discounted using SP2’s behaviour about cpu towards IP1.
In the case of SP behaviour, if monitor M1,2 is associated with indicator type ‘1’ to monitor SP2’s behaviour towards IP1, then this opinion is represented as WSP2M1,2.
In the case of SP ratings, SP1 being informed about opinion from SP2 for IP1 based on indicator type ‘1’ is represented as W1SP2. Based on the behaviour of SP2 towards
IP1 for cpu indicator, SP2’s opinion for cpu is discounted. In other words, the opinion
W1SP2 is discounted by WSP2M1,2 value and is given as W(M1,2)SP21 = WM1,2SP2 W1SP2 =
(b (M1,2)SP21, d (M1,2)SP21, u (M1,2)SP21, a (M1,2)SP21)
SP ratings after discounting opinions using the SP behaviour for each of the indi-cator, also follows the two-step process of consensus and conjunction to get the com-bined opinion of SP rating and SP behaviour which are given as follows:
W(SPR SPB)=WSPB WSPR = (WM1,1SP1 W1SP1) (WM1,2SP2 W1SP2) … (WM1,qSPq
W1SPq) Ʌ (WM2,1SP1 W2SP1 ) (WM2,2SP2 W2SP2) … (WM2,qSPq W2SPq )Ʌ …Ʌ
(WMm,1
SP1 WmSP1 ) (WMm,2SP2 WmSP2) … (WMm,qSPq WmSPq)
4
Evaluation
In order to evaluate the proposed trust model, we have developed a prototype tool. We used this tool to evaluate the model in three different experiments. More specifically, in the first set of experiments we provide a comparison of the proposed model with other existing models using data set from Amazon marketplace (www.amazon.co.uk). In the second and third sets of experiments, we use the exam-ple of the cloud computing scenario described in Section 2 to evaluate the use of the various parameters considered in our model. In the second set of experiments we analyse the proposed model for each individual parameter, namely (a) SLA monitor-ing, (b) SP ratings, and (c) SP behaviour. In the third set of experiments, we analyse the model when considering combinations of the parameters in order to see if the use of more than one parameter provides better trust values.
4.1 Comparison of the proposed model
The dataset of Amazon marketplace used in this evaluation includes rating re-ceived by users for four sellers for a same music track CD. This data set contains ratings in the range of 1 to 5, for each seller, provided by the users. The rating is con-verted to the form <r:positive, s:negative> evidence such that r+s=1. More specifical-ly, rating 1 maps to <0,1>, rating 2 maps to <0.25,0.75>, rating 3 maps to <0.5,0.5>, rating 4 maps to <0.75, 0.25>, and rating 5 maps to <1,0>. A user performing the (i+1)th transaction has access to all the previous i ratings.
We compared the proposed model with Josang’s [8] and Wang’s [17] approaches. For all the three models, the experiment takes previous i ratings to predict the (i+1)th
0.5. Fig. 2 shows the experimental results for a single seller. The x-axis represent 25 transactions and the y-axis represents errors that are computed as the average of 25 prediction errors based on the ratings. The results show that our model has lower pre-diction error when compared to Josang’s [8] and Wang’s [17] approaches. Table 1 summarizes the experiment performed for four sellers for the same music track CD.
Fig. 2. Average prediction error for a Seller based on the ratings [1,5]
Table 1. Average prediction error for 4 sellers based on the ratings [1,5]
4.2 Experiments using individual parameters
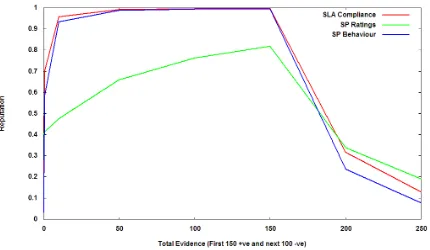
SLA Monitoring. In this experiment, we consider only the SLA monitoring parame-ters with four resources (cpu, memory, disk, VM) associated with IP1 as fixed. We considered that the resource demand requests are sent by all SPs with incremental resources requirements. While IP1 is able to provide the demanded resources, IP1 is considered compliant with the SLA and this increases the positive evidence main-tained by the SPs for IP1. At a certain point the requested resources exceed the capac-ity of the IP1 resulting in SLA violations. The SLA violations add to the negative evidence maintained by the SPs for IP1. Fig. 3 shows that the reputation increases when each of the SPs have positive evidence; a maximum reputation is achieved by IP1 when each of the SPs had positive evidence of 150. After this point, the SLA violations accumulate negative evidences causing a reduction on the reputation
SP Rating. In this experiment we considered that all the SPs used IP1 and rated IP1 for its performance based on cpu, memory, disk and virtual machine indicators. These ratings are preserved by the SPs for evaluating the IPs. The experiment starts with IP1 receiving positive ratings from each of the SPs. Each time the ratings are provided to IP1, SP1 calculates the reputation of IP1 taking into account its own ratings as well as the ratings of the other SP2 to SP5 providers. When a degraded performance is ob-served (i.e.; there are SLA violations), the SPs rate IP1 with negative ratings. In this experiment, the SP1’s positive and negative evidence is fixed as 200 positive and 50
negative evidences. As shown in Fig. 3 the increase in the positive ratings received by SP1 from other SPs, increase the reputation until the positive evidence reaches 150. As SP1 starts receiving negative ratings from other SPs, the reputation reduces.
Fig. 3. Reputation based on SLA monitoring, SP Ratings and SP Behavior only
SP Behavior. In this case, the experiment begins with all SPs using only IP1 for all its resources (cpu, memory, disk space, and virtual machine). The positive behaviour of all SPs increases the positive evidence for all SPs, which increases the reputation of IP1 in terms of SPs behaving towards IP1. A degraded performance observed from IP1 may lead to SPs changing their infrastructure provider. This reduces the SPs posi-tive behaviour towards IP1 and increases the negaposi-tive evidence for all SPs, reducing the reputation of IP1. Fig. 3 shows the results of this experiment.
In summary, the results of the experiments for each of the individual parameters considered in the model show that there is an increase in the reputation with SLA compliance evidence for SLA monitoring, and positive SP ratings and positive SP behaviour towards an IP. The results also show that violations of SLA, negative SP rating values, and negative behaviour of an SP reduce the reputation of an IP.
4.3 Experiments using combination of parameters
Combination of SP rating and SP Behavior. In this experiment, we consider IP1 with positive ratings from all the SPs. SP1 calculates the reputation of IP1 taking into account its own ratings as well as ratings of SP2, SP3, SP4 and SP5. The ratings pro-vided by SP2, SP3, SP4 and SP5 are first discounted using the knowledge of the SPs behaviour towards IP1. When maintaining constant SP ratings by all SPs, the SP be-haviour of SP2, SP3, SP4 and SP5 changes by increasing the positive bebe-haviour of these SPs for initially zero positive behaviour to a very high value of positive behav-iour. Fig. 4 (a) shows that (i) as the SP behaviour becomes more positive as the over-all reputation of IP1 increases; (ii) when SP1 has less evidence, there is a large varia-tion, which causes a bigger impact due to the other SP behaviour - as the SP1’s amount of evidence increases, the reputation has less impact due to SP behaviour.
SLA compliance is varied from zero to a high amount of positive evidence for all SPs (SP1 to SP5). From Fig. 4 (b). it is observed that when the positive evidence from the SLA monitoring increases, the reputation of IP1 also increases.
Fig. 4. Reputation based on (a) SP ratings and SP behavior, (b) SP ratings and SLA monitoring
Combination of SP Rating, Behavior and SLA monitoring. In these experiments we calculated the reputation using all parameters. We considered the values of two of the parameters fixed and varied the third parameter, as explained below.
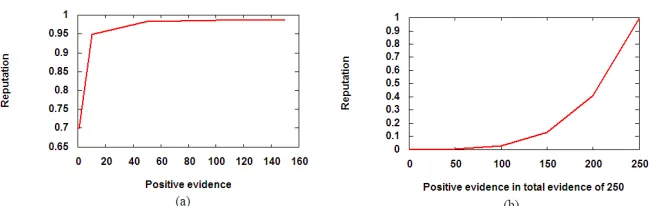
Effect of SP behavior. In this case, the SP ratings for IP1 provided by all SPs and the SLA compliance/non-compliance values of all SPs with IP1 are fixed. The SP rating is fixed at 10 positive evidences by each of the SPs with no negative evidence. The SLA monitoring provides 50 positive evidences as total evidence by each SP towards IP1. The SP behaviour for SP1 to SP5 is varied from zero positive evidence to a posi-tive evidence of 250 within a given total evidence of 250. As shown in the Fig. 5, the SP behaviour gains positive evidence as the reputation of IP1 increases.
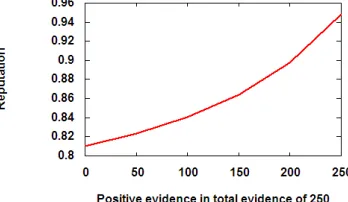
Effect of SLA monitoring. In this case, the SP ratings provided by all SPs for IP1 and the SP behaviour for all SPs are fixed. The total evidence consisting of only positive evidence obtained from SLA monitoring is varied from zero to 250. It can be seen from Fig. 6 (a) that as the positive evidence from SLA monitoring for IP1 increases, the reputation of IP1 also increases.
[image:14.595.221.395.563.664.2]The effect of SLA monitoring information is important to evaluate reputation of an IP during the operational phase. In a cloud environment, when the SPs deploy their services on a particular IP, they may retain the services for significantly longer dura-tion. This can result into less frequent updates about the SP ratings and the SP behav-iour. The provision of updates of compliance/non-compliance SLA monitoring infor-mation at regular intervals may have significant impact on the reputation of an IP, as shown in Fig. 6 (a).
Fig. 6. (a) SP rating and behavior with variable SLA compliance; (b) SP behavior and SLA
monitoring with variable SP rating
Effect of SP ratings. In this case, the SP behaviour of all SPs towards an IP and the SLA violation for an IP provided by all SPs are fixed. The positive evidence from all the SPs for IP1 is varied from zero to 250 in a total evidence of 250. Fig. 6 (b) demonstrates that the positive evidence increases and the negative evidence reduces as the reputation of IP1 increases.
5
Related Work
Trust and reputation have been the focus of research in several open systems such as e-commerce, peer-to-peer, and multi-agent systems [1][7][10][14]. Some trust and reputation approaches have been suggested for web-service systems [3][4] [12][15][16]. In general, the web-services based approaches are limited [16]. For example, the majority of these approaches rely on the use of a centralized repository to store and collect specific QoS feedback from consumers about a service. An excep-tion is found in [15] that uses different QoS registries organized in a P2P way for groups of service providers, but this approach is still limited to specific quality types of feedback and requires overhead of communication due to the use of complex struc-tures. Existing approaches do not consider the fact that services are available as com-position of other services (i.e., service-based applications) and, therefore, consumers may provide feedback to the service composition instead of individual services. Other challenges are concerned with dynamic changes in services causing feedback to be-come obsolete and difficulty to motivate consumers to provide feedback.
[image:15.595.132.457.224.327.2]evi-dence and the amount of negative evievi-dence based on which it estimates the reputation of an entity in a system. Both models [18][9] are based on the belief theory, but in [18] the use of Bayesian estimation expects probabilities for each question of interest. The work in [9] has a mapping between opinion space and evidence space [8] and the opinion model allows operate with uncertain probabilities.
Trust is closely related to the concept of uncertainty. However, many of the exist-ing reputation systems have not considered uncertainty in their work. Exceptions are found in the works described in [8][11][17]. The belief model in [8] uses metric called
opinion to describe belief and disbelief about a proposition as well as the degree of uncertainty regarding probability of an event. The work on [17] proposes opinion
metric as in [8] but giving importance to uncertainty due to the evidence that impacts the belief and disbelief about a proposition. In [8] the uncertainty is modeled only based on the amount of total evidence; i.e. as the total evidence increases the uncer-tainty decreases. In [17] the unceruncer-tainty also takes into account the amount of posi-tive and negaposi-tive evidence contained in the total evidence; i.e. given the total evi-dence the uncertainty is highest when the positive and negative evievi-dence in the total evidence is equal, and the uncertainty reduces as the two evidences dominates.
In Cloud environment, trust based on reputation systems have been discussed in [5][6][2]. In [5], trust is one of the core component used by SP, along with risk, eco-efficiency and cost for evaluating the IP for their service. The work in [6] identifies several vulnerabilities in the existing cloud services provided by Google, IBM, Ama-zon and proposes an architecture to reinforce the security and privacy in the cloud applications. It suggests a hierarchy of P2P reputation system to protect cloud re-sources. However, there is no reputation model proposed [6]. Alhamad et al. [2] pro-poses a trust model for cloud computing based on the usage of SLA information. This work describes the requirements and benefits of using SLA for trust modeling in cloud environment, provides a high level architecture capturing major functionalities required, and provides a protocol for the trust model. As in [2] our model also in-cludes SLA compliance information to model trust. We complement the trust model with SP ratings and SP behavior to assist modeling comprehensive trust aspects of an IP. Contrary to [2], we also provide a trust model to evaluate the trust of an IP.
The approach presented in this paper complements existing approaches for reputa-tion of cloud computing environments. Different from existing works, our approach considers several parameters to calculate trustworthiness of infrastructure providers.
6
Conclusion and Final Remarks
parame-ter when calculating trust values. We are also performing some more experiments to evaluate the work in other scenarios.
References
1. Adler, B.T., Alfaro, L. de.: A Content-driven Reputation System for Wikepedia. Proc. of World Wide Web Conference (2007)
2. Alhamad, M., Dillon, T., Chang, E.: SLA-Based Trust Model for Cloud Computing 13th International Conference on Network-Based Information Systems (2010)
3. Artz, D., Gill, Y.: A Survey of Trust in Computer Science and the Semantic Web. Web Semantics, v. 5, n. 2 (2007)
4. Chang, E., Dillon, T.S., Hussain, F.K.: Trust and reputation for service-oriented environ-ments: technologies for building business intelligence and consumer confidence, Wiley (2006)
5. Ferrer, A.J., Hernández, F., Tordsson, J., Elmroth, E., Ali-Eldin, A., Zsigri, C., Sirvent, R., Guitart, J., Badia, R.M., Djemame, K., Ziegler, W., Dimitrakos, T., Nair, S.K., Kousiouris, G., Konstanteli, K., Varvarigou, T., Hudzia, B., Kipp, A., Wesner, S., Corrales, M., Forgó, N., Sharif, T., Sheridan, C.: OPTIMIS: a Holistic Approach to Cloud Service Provisioning, Future Generation Computer Systems (2011)
6. Hwang, K., Kulkarni, S., Hu, Y.: Cloud Security with Virtualized Defense and Reputation-based Trust Management. Eighth IEEE International Conference on Dependable, Auto-nomic and Secure Computing (2009)
7. Josang, A., Ismail, R., Boyd, C.: A Survey of Trust and Reputation Systems for Online Service Provision. Decision Support Systems, v. 43, n. 2 (2007)
8. Josang, A.: A Logic for Uncertain Probabilities International Journal of Uncertainty, Fuzz-iness and Knowledge-Based Systems, 9(3):279311 (2001)
9. Josang, A., Ismail, R.: The Beta Reputation System. In Proceedings of the 15th Bled Elec-tronic Commerce Conference e-Reality: Constructing the e-Economy (2002)
10. Kokash, N., van den Heuvel, W.J., D’Andrea V.: Leveraging Web Services Discovery with Customizable Hybrid Matching. Int. Conf. on Web Services (2006)
11. Li, F., Wu, J.: Uncertainty Modeling and Reduction in MANETs IEEE Transactions on Mobile Computing, Vol. 9, No. 7 (2010)
12. Maximillen, E.M., Singh, M. P.: Reputation and Endorsement for Web Services. SIGecom Exchanges, v. 3, n.1 (2002)
13. OPTIMIS. Optimized Infrastructure Services. http://www.optimis-project.eu.
14. Pujol, J.M., Sanguesa, R., Delgado, J.: Extracting Reputation in Multi Agent Systems by Means of Social Network Topology. Proc. International Joint Conference Autonomous Agents and Multiagent Systems (2002)
15. Vu, L.H., Hauswirth, M., Aberer, K.: QoS-based Service Selection and Ranking with Trust and Reputation Management. Proc. of OTM’05 (2005)
16. Wang, Y., Vassileva, J.: Towards Trust and Reputation Based Web Service Selection: A Survey. International Transaction Systems Science and Applications, v. 3, n. 2 (2007) 17. Wang, Y., Singh, M. P.: Evidence-Based Trust: A Mathematical Model Geared for
Multi-agent Systems. ACM Transactions on Autonomous and Adaptive Systems, Vol. 5, No. 4, Article 14 (2010)
![Fig. 2. Average prediction error for a Seller based on the ratings [1,5]](https://thumb-us.123doks.com/thumbv2/123dok_us/1578993.110505/12.595.199.398.205.332/fig-average-prediction-error-seller-based-ratings.webp)