USING ARTIFICIAL NEURAL NETWORKS TO IDENTIFY AND OPTIMISE THE KEY
PARAMETERS AFFECTING GEOMETRY OF A GMAW FILLET WELD.
J.W.P.Cairns, N.A.McPherson, A.M.Galloway
Department of Mechanical Engineering, University of Strathclyde, Glasgow
Abstract
Control of Gas Metal Arc Welding (GMAW) parameters is key to maintaining good quality and consistent fillet weld geometry. The external geometry of the fillet weld can be easily measured, however the internal geometry (i.e. penetration), which is critical in determining the structural integrity of the joint, is difficult to measure without destructively testing the workpiece. Consequently the most cost effective way to ensure adequate penetration is to maintain close control of the input parameters. Furthermore if we can demonstrate tight control of the parameters and interactions that affect the joint penetration then we can increase the confidence that sufficient penetration is being achieved.
Previous studies have shown that the variation in set up parameters between welders and the guidance given by industry/suppliers can vary widely and in some cases be contradictory. Also in practice there are several characteristics of the manual/semi-automatic GMAW fillet weld process that are difficult to control (e.g. gun angle, travel angle and gap) but yet have an impact on the resultant geometry.
This paper will document a programme of work which has used an Artificial Neural Network (ANN) to identify the parameters, and specific interactions that have an impact on the resultant fillet weld geometry. The variables that will be assessed in this paper will include current, voltage, travel speed, gun angle, travel angle. Further follow on studies will take place to understand the impact of gap, gas flow & nozzle diameters.
Introduction
In the shipbuilding downhand fillet welding represents a significant proportion of the overall welded length on a vessel and so represents an area where focused process improvement may provide substantial cost savings. Since the internal geometry (i.e. penetration), which is critical in determining the structural integrity of the joint, is difficult to measure without destructively testing the workpiece the most cost effective way to ensure adequate penetration is to maintain close control of the input parameters. Furthermore if we can demonstrate tight control of the parameters and interactions that affect the joint geometry and penetration then we can increase the confidence that sufficient
penetration is being achieved whilst heat input and distortion is minimised.
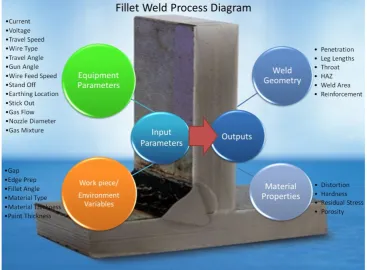
There have been numerous papers written and studies undertaken on the subject of controlling GMAW weld parameters and resultant geometry however as figure 1 shows, the large quantity of input parameters and variables (this list is indicative not exhaustive) make it challenging to understand exactly what impact the variation each of the inputs (and their interactions) has on the resultant fillet weld. However in order to maintain consistent quality fillet welds it is critical that we understand to what extent each of these input parameters (and their interactions) affect the resultant outputs. This paper will deal specifically with understanding the impact and interactions the following parameters: current voltage, travel speed, travel angle and gun angle, have on the resultant fillet weld geometry (leg length and penetration).
Variation in journal/supplier guidance
There are numerous sources of guidance on input parameter selection for GMAW, from both academic and industrial publications. However on closer inspection the wealth of guidance on offer can be confusing and at times contradictory. The following examples, taken from a mixture of
Figure 1: Fillet Weld Inputs and Outputs
Ref 3 and Ref 4 both advise that a ‘pushing’ (+ve) travel angle produces less penetration and a flatter bead (so conversely a ‘pulling’ (-ve) travel angle produces a deeper/narrower bead). Ref 3 also advises using a travel angle of 5°-15° because increasing to greater than 20°-25° creates more spatter, less penetration and is consequently less stable. Ref 4 however advises that a travel angle of 5°-25° should be used. Ref 4 advised that a ‘pulling’ travel angle should be used for heavy gauge metals whereas a ‘pushing’ angle should be used for lighter gauge metals. Ref 5 advises that for metal cored GMAW the travel angle should be 20°-30° (pushing). Ref 6 advises that higher deposition rates can be achieved with a 15° ‘pushing’ travel angle, however Ref 7 advises that in general
‘pushing’ reduces deposition efficiency. Also Ref 22 recommends using a ‘push’ travel angle, if possible, as it improves the coverage of shielding gas around the weld.
The range of gun angles also varies depending on what publication is being referred to. Ref 4 advised a gun angle of between 5°-20°, whereas Ref 9 advised a gun angle range between 40°-45° and Ref 5 a gun angle range of 30°-40°. Investigations in Ref 8 were made using a fixed gun angle of 45°.
Previous ANN Studies
Artificial Neural Networks (ANN’s) are computing systems consisting of a collection of interconnected processing elements which are able to represent complex interactions between process inputs and outputs.
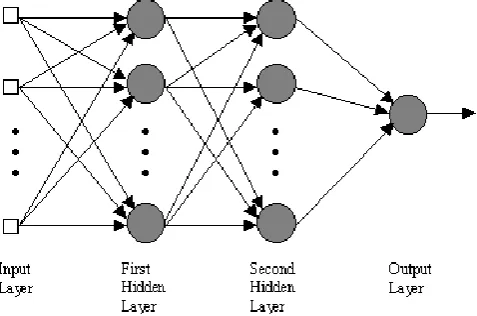
The diagram below (figure 2) details the basic architecture of a typical ANN.
Input Layer – raw data that is fed into the system (e.g. current, voltage, travel speed, gun angle, travel angle)
One of More Hidden Layers – array of interconnected processing elements with different weights between each connection.
Output Layer – The signal (output) of the process is dependent on the outcomes and weights of the processing elements in the hidden layers.
technology available to measure the penetration of a fillet weld, without destructively testing the joint (thus destroying the entire purpose of the joint). ANN’s which could accurately predict the penetration and internal geometry of a fillet joint would provide a great benefit by greatly reducing the cost (material and labour) or trialling and testing new welding procedures and processes.
Figure 2 : Typical Example of ANN Architecture
The main benefits that ANN’s provide are:
They do not require any predefined relationship between the variables to be understood Allow patterns, trends and interactions to be identified that otherwise would be impossible to
detect.
They work well when there are a large number of diverse variables to analyse.
They can be used and applied to a variety of problems (not specific to thermo-mechanical engineering related processes)
They can be used to process symbolic data as well as numeric data
There are however some important limitations in using ANN’s that need to be understood.
They do not explain why patterns and/or interactions exist so it can be difficult to analyse and interpret the results
They may not always find the optimal solution
The model development requires an element of trial and error (trying different network topologies, iterations, number of layers…etc) in order to try and create the most accurate model.
There are numerous examples of ANN’s that have been developed to predict GMAW fillet weld geometries. Ref 11- Ref 21 provide examples of ANN’s that have been successfully developed using a subset of the input and output parameters shown in Fig 1. However there are no publications that investigate the impact of both travel angle and the gun angle (and their interactions) have on the resultant fillet weld geometry (horizontal leg length, vertical leg length and penetration). This paper will use ANN to analyse the relationship/impact that the current, voltage, travel speed, torch travel angle and gun angle have on the resultant fillet weld geometry (leg length and penetration). It will also analyse if the interactions between these input parameters are significant in influencing the resultant weld geometry.
Experimental Procedure
Figure 3 : Image of Welding Rig
Figure 4 : Jig for setting Travel and Gun Angle
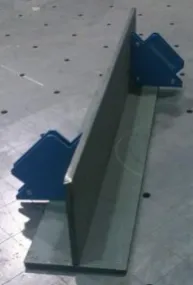
Figure 5: Example of DH36 Mild Steel 'T' test piece
Once set the gun angle was verified using a magnetic inclinometer attached to the jig. The travel speed of the test piece was controlled using the Matlab controlled stepper motors which controlled the speed of the rig table onto which the test piece was secured. The rig speed was checked prior to the start of each experimental run. Each test piece consisted of two (100mm x 500mm x 6mm) DH36 grade steel test plates tack welded together at 90° to form a T-Joint. Magnetic aids were used to set the 90° fillet angle (figure 5).
[image:4.595.249.346.427.570.2]Table 1: Experimental Variable Parameters
Gun Angle (°) Travel
Angle(°)* Travel Speed (mm/min) Voltage (V) Current (A)
35,40,45,50 -30, -15, 0, 15, 30
300,400,
500 21,24,26 170, 220, 270
Controlled using pre-set jig, checked and measured using
magnetic inclinometer
Controlled using pre-set
jig
Set using Matlab software connected to Welding Rig. Calibrated
prior to each test run
Controlled using Miller Power Source and measured on calibrated
PAMS unit
[image:5.595.204.390.341.522.2]*-ve travel angle = pull +ve travel angle = push
Table 2 : Experimental Constant Parameters
Stick Out (mm) Stand Off (mm) Gap (mm) Wire
Type Material Gas Flow (l/min)
Shielding Gas Nozzle Diameter (mm) Plate Thickness (mm)
15 1-2 0
MC-1 (metal cored)
DH36 Mild Steel
18 l/min Measured using calibrated
gas flow meter
BOC Specshield 20% CO2 / 80% Argon
16mm 6mm
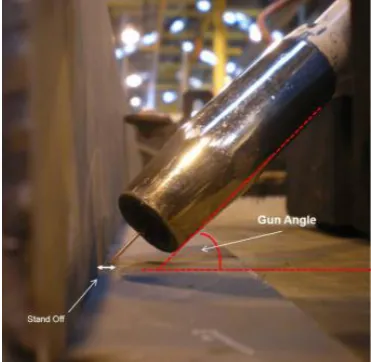
Figure 6 : Image showing gun angle and stand-off measurement
Figure 7 : Image showing travel angle measurement
[image:5.595.178.417.561.740.2]Once welded the test pieces were cut and macrographed so that the internal geometry of the weld could be photographed and then measured. Imaging software (ImageJ) was then used to measure the leg length and penetration, as identified below, from each sample.
Figure 8: Sample Macrographed Fillet Weld
Figure 9: Key Fillet Weld Geometry
ANN Model Development
[image:6.595.202.407.346.547.2]Figure 10 : Visual Representation of selected ANN architecture
Once the model had been trained and tested its ability to predict fillet weld leg length and penetration given input values for current, voltage, travel speed, gun angle and travel angle was further validated with some additional experimental data. Figure 11 shows the results of this validation. Overall it shows good overall agreement between the predicted and the actual outputs.
Figure 11: ANN Model Results (Actual vs Predicted)
Sensitivity Analysis
Once the model had been trained and tested a sensitivity analysis was conducted using
[image:7.595.92.507.419.666.2]closely followed by current and voltage, was the most influential in determining the vertical and horizontal leg lengths. The analysis also shows the travel angle and the gun angle are not insignificant in determining the vertical and horizontal leg lengths.
Figure 12: Results of ANN Sensitivity Analysis
Main Effects and Interactions
Following the results of the ANN model, an ANOVA study was carried out in order to determine the main effects and interactions of the input variables on predicting the penetration and leg length of the fillet weld. The sensitivity of each effect and interaction was calculated using the following equation
Equation 1: Equation for calculating the sensitivity of each input variable and interaction
Where: S = the sensitivity of the input/interaction X = each value within the dataset
x,ˉ
= average of all values within the dataset N = Number of values in the datasetPenetration
Figure 13: Analysis of key parameters and interactions affecting penetration
Leg Length
The analysis (ref 14) highlighted that the 2 way interaction between travel speed and travel angle was the most influential in determining the leg length, followed closely by travel speed. The dominance of travel speed in these results again ‘echo’ the results from the ANN sensitivity analysis that travel speed was the most influential factor. The 3rd most influential factor in determining the leg length was the current. The travel speed is one of the key factors in determining the amount of filler material that is deposited at each position across the length of the weld. So it makes sense that the angle of deposition (travel angle) and the volume of filler material deposited per unit length are the most influential factors in determining the leg length.
[image:9.595.125.471.487.750.2]Travel Angle Impact
The following graphs show some further analysis of the impact that the travel angle has on the penetration and leg length of a fillet weld. The graph has been split into 3 sections, 1 for –ve, neutral and +ve travel angle) and the results within each section have been ordered in increasing heat input (going left to right within each section). The results show that a pushing (+ve) travel angle improves the consistency of the resultant penetration and leg length, regardless of the heat input. The results also show the for pulling (-ve) and neutral travel angles the leg length increases proportionally with the heat input, however for pushing (+ve) travel angles the resultant leg length is less sensitive to increases in heat input. Further analysis of the weld pool dynamics will be required in order to
understand why a pushing (+ve) travel angle improves the consistency of both the penetration and leg length.
[image:10.595.73.549.219.751.2]Figure 15 : Graph showing impact of varying travel angle has on penetration
Figure 16 : Graph showing impact of varying travel angle has on average leg length
Increasing heat input
Increasing heat input
Increasing heat input
Gun Angle Impact
[image:11.595.72.541.202.544.2]The following graphs, figure 17, show some further analysis of the impact that the gun angle has on the penetration and leg length of a fillet weld. The graph has been split into 3 sections, 40°, 45° and 50° gun angles) and the results within each section have been ordered in increasing heat input (going left to right within each section). The results show that the gun angle seems to have no significant impact on the leg length of the resultant weld, however the variation in penetration of the welds conducted with a gun angle of 50 deg appears to be slightly more stable than at 40° and 45°. Further experimentation over a larger sample size will be required in order to quantify the magnitude of this improved stability.
Figure 17: Graph showing impact of varying gun angle has on penetration and average leg length
Conclusions
The results detailed in the paper show that ANN software can be used to create a model which can accurately predict fillet weld geometry given a section of input parameters. The results of the
sensitivity analysis and the assessment of the interactions were also in broad agreement. That current is most influential factor when determining penetration and that travel speed and current are both influential factors in determining leg length. The effect and interaction analysis also identified that there are a number of interactions between the input parameters that are significant in determining both the penetration and leg length of the fillet weld. The analysis also aligns with the majority of guidance, that a ‘pushing’ travel angle is preferred. This is as the resultant leg length is less sensitive to changes in heat input and it produces less variation in the penetration. Further studies will be required to assess the aforementioned interactions in more detail and understand how the constituent input parameters affect the geometry via the interaction. Further experimentation is also planned to review how parameters such as Gap, Gas Flow and Nozzle Diameter impact the results detailed within this paper.
Acknowledgements
The authors wish to thank BAE Systems Naval Ships for permission to publish this paper.
References
1. Beckett, S., MacPherson, M.J., McPherson, N.A. 2011. Improved Welding Control of Automated Fillet Welding for Ship Structures Using Artificial Neural Networks (ANN). Presented at JOM 16 Conference, May 2011, HelsingØr.
2. Lightfoot, M.P., Bruce, G.J., McPherson, N.A., Woods, K. 2005. The Application of Artificial Neural Networks to Weld-Induced Deformation in Ship Plate. Supplement to the Welding Journal, pp23-26.
3. MIG Welding Guidelines [online] Available at: < www.millerwelds.com>
4. Welding Lesson [online] Available at: < www.sweethaven.com>
5. BOC, Fundamentals of flux and Metal Cored Arc Welding, Section 8: Consumables (2007), pp322-325.
6. Harwig, D. 2000. Arc Wise – Optimisation, Productivity and Quality in Arc Welding, Materials Joining Technology Newsletter, Vl 13, No 2.
7. Pal, K., Bhattacharya, S., Pal, S.K. 2010, Multisensor-based monitoring of weld deposition and plate distortion for various torch angles in pulsed MIG welding, Int J Adv Manuf Technol (2010) 50:543-556
8. Tham, G., Yaakub, M.Y., Abas, S.K., Manurung, Y., Jalil, B.A., 2012. Predicting the GMAW 3F T-Fillet Geometry and its Welding Patameter. Procedia Engineering 41 (2012), pp1794-1799
9. MIG (GMAW) Welding Techniques [online] Available at: < www.weldingspark.com>
10. LR058 BOC, Fundamentals of flux and Metal Cored Arc Welding, Section 8: Consumables (2007), pp322-325.
11. Campbell, S.W., Galloway, A.M., McPherson, N.A. 2012. Artificial Neural Network Prediction of Weld Geometry performed using GMAW with Alternating Shielding Gases.
12.Dadgar Asl, Y.,Mostafa, N.B., Panahizadeh, V., Seyedkashi, S.M.H. 2011. Prediction of Weld Penetration in FCAW of HSLA Steel using Artificial Neural Networks.
13.Moon, H., Na, S. 1997. Optimum Design Based on Mathematical Model and Neural Network to Predict Weld Parameters for Fillet Joints.
14. Andersen, K., Cook, G., Karsai, G., Ramaswamy, K. 1990. Artificial Neural Networks Applied to Arc Welding Process Modeling and Control
15. Nagesh, D.S., Datta, G.L.2002. Prediction of Weld Bead Geometry and Penetration in shielded metal-arc welding using artificial neural networks.
16. Nagesh, D.S., Datta, G.L.2008.Modeling of fillet welded joint of GMAW process: integratedapproach using DOE, ANN and GA.
18. Chan, B., Pacey, J., Bibby, M. 1998. Modelling Gas Metal Arc Weld Geometry Using Artificial Neural Network Technology.
19. Nagesh, D.S., Datta, G.L.Genetic Algorithm and Artificial Neural Networks Application for Modeling of Fillet Welded Joint of GMAW Process.
20. Bhadeshia, H.K.D.H. 1999. Neural Networks in Materials Science
21. Kim, I.S., Son, J.S., Park, C.E., Kim, I.J., Kim, H.H.2005. An investigation into an intelligent system for predicting bead geometry in GMA Welding process.
22. Cairns, J., McPherson, N.A., Galloway, A.M., MacPherson, M., McKechnie, C. 2013. Optimised Penetration for Fillet Welding. Presented at JOM 17 Conference, May 2013, HelsingØr.
22. MIG Welding, Tutorial [online] Available at: < www.mig-welding.co.uk >
Keywords
Artificial Neural Networks (ANN) Fillet Welding