Machine Learning Approach for detection of nonTor
Traffic
Elike Hodo
1,Xavier Bellekens
2, Ephraim Iorkyase
1, Andrew Hamilton
1, Christos
Tachtatzis
1, Robert Atkinson
1Department of Electronic&Electrical Engineering University of Strathclyde
Division of Computing and Mathematics University of Abertay Dundee E-mail1: {firstname.surname@strath.ac.uk}
E-mail2: {x.bellekens@abertay.ac.uk}
ABSTRACT
Intrusion detection has attracted a considerable interest from researchers and industries. After many years of research the community still faces the problem of building reliable and efficient intrusion detection systems (IDS) capable of handling large quantities of data with changing patterns in real time situations. The Tor network is popular in providing privacy and security to end user by anonymising the identity of internet users connecting through a series of tunnels and nodes. This work focuses on the classification of Tor traffic and nonTor traffic to expose the activities within Tor traffic that minimizes the protection of users. A study to compare the reliability and efficiency of Artificial Neural Network and Support vector machine in detecting nonTor traffic in UNB-CIC Tor Network Traffic dataset is presented in this paper. The results are analysed based on the overall accuracy, detection rate and false positive rate of the two algorithms. Experimental results show that both algorithms could detect nonTor traffic in the dataset. Artificial neural network proved a better classifier than SVM in detecting nonTor traffic in UNB-CIC Tor Network Traffic dataset.
Keywords
Artificial neural network, support vector machines, intrusion detection systems Tor and nonTor, UNB-CIC Tor Network Traffic dataset.
1.
INTRODUCTION
The computing world has changed over the past decade due to the rapid development of internet and the network systems, network and computer systems traffic are susceptible to intrusion and this has been a great concern to the research community and industries.
Over the last decade, traffic classification has advanced in its applications in systems like quality of service (QoS) tools or Security information and Event management(SIEM) [1]. A considerable interest have been attracted from researchers and the industries to the study of these technologies and developing classification techniques [2][1].
The Tor networks help to provide privacy and anonymity over the internet but have been an obstacle in the classification of internet traffic. It operates by anonymising the identity of users connecting through a series of tunnels and nodes. Tor networks do not detect anomalies in traffic flow and do not have the ability to raise an alarm when an anomaly occurs.
To this effect intrusion detection system (IDS) plays an important role in Tor networks. Intrusion
Detection Systems are placed on the networks and computer systems to monitor and detect anomalies. In general IDS can be categorised into two components, based on the detection technique. Signature based and Outlier based IDS. Most IDs employ a signature based detection approach where the network traffic is monitored and compared against database rules or signature of known anomaly in network traffic [3][4]. An alarm is raised on detection of a mismatch. Signature based is the most common as they do not necessarily have to learn the network traffic’s behaviour. Although it is effective in detecting known anomalies, it cannot detect unknown anomalies unless the signature and rules are updated with new signatures [5][6]. Signature based is known to have a significant time lapse between anomaly detection and activation of its corresponding signature [4]. Signature based techniques are mainly human-dependent in creating, testing and deploying signatures.
feature selection cannot be overlooked, intuitive understanding of the problem is mostly used in the selection of features [10]. A study by A.Lashkari et al.[1] Showed Decision Tree C4.5 classifies Tor and nonTor traffic on UNB-CIC Tor Network Traffic dataset [11] with a high precision and recall. In the study by [1] ,23 time based features were extracted from the traffic and was reduced to 5 for training and testing of the machine learning algorithms.
This paper analyses the performance of Artificial neural network (ANN) and Support vector machines (SVM) in terms of overall accuracy in detecting nonTor traffic in a Tor network traffic dataset data from the University of New Brunswick (UNB), Canadian Institute for cyber security (CIC) using an anomaly based approach with all features in the dataset. As part of the work, the results are compared with the results of [1] being the only study published to the best of our knowledge using the UNB-CIC Tor Network Traffic dataset. In the proposed approach 10 features are selected out of the 28 features of the dataset using Correlation based feature selection (CFS) for training and testing the detection algorithms.
The rest of the paper is organised as follows: section 2 describes intrusion detection systems, section 3 describes the UNB-CIC Tor Network Traffic dataset, section 4 introduces Artificial neural network and Support vector machines algorithms used in the experiment respectively, section 5 analysis experimental results, conclusion and future works are presented in section VI.
[image:2.612.316.565.308.697.2]2.
INTRUSION DETECTION SYSTEMS
Intrusion detection system is a software application or a device placed at strategic places on a network to monitor and detect anomalies in network traffic [12][13] as shown in Figure 1. The main features of IDS are to raise an alarm when an anomaly is detected. A complementary approach is to take corrective measures when anomalies are detected, such an approach is referred to as an intrusion Prevention System (IPS) [14]. Based on the interactivity property of IDS, it can be designed to work either on-line or off-line. On-line IDS operates on a network in real time by analysing traffic packets and applying rules to classify normal and analogous traffic. Off-line IDS operates by storing data and after processing to classify normal and anomaly.Figure 1. Intrusion detection system model
3.
UNB-CIC TOR NETWORK TRAFFIC
DATASET
3.1
UNB-CIC tor network traffic dataset
description
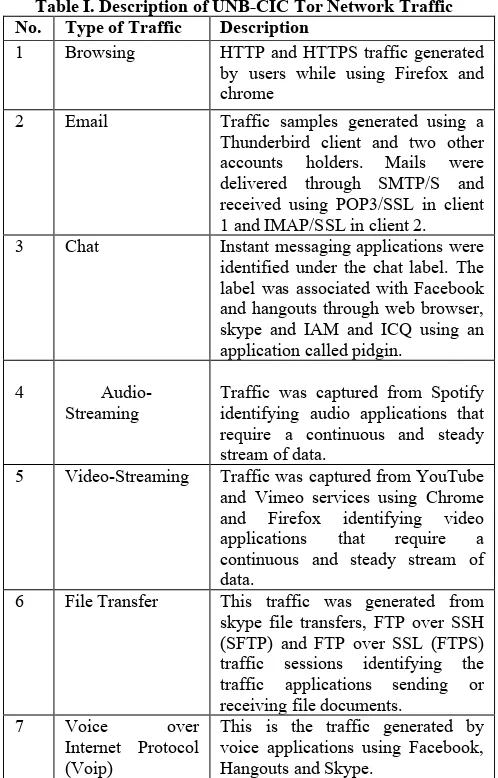
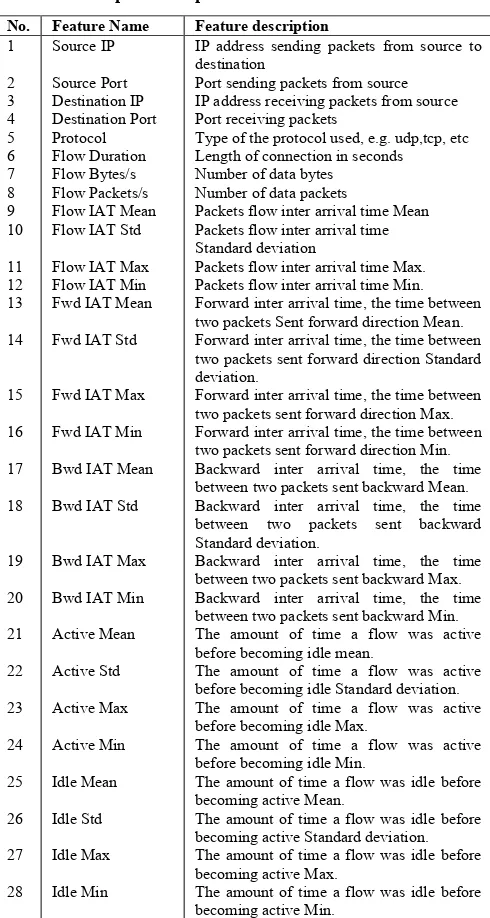
UNB-CIC Tor Network Traffic dataset [8] is a representative dataset of real-world traffic defined as a set of task. Three users were set up for browser traffic collection and two users for the communication parts such as chat, mail, p2p etc. from more than 18 representative applications such as Facebook, skype, Spotify, Gmail etc. The dataset contains 8 types of Tor traffic as shown in table I and non-Tor traffic. The dataset contains 8044 (11.86%) records of Tor traffic and 59790 (88.14%) records of nonTor traffic. The non-Tor traffic captured in the dataset contains unique characteristics differentiating it from the Tor traffic. These characteristics are called features. The UNB-CIC Tor Network Traffic dataset contains a total of 28 features listed in tables II. The features were generated by a sequence of packets having the same values for {source IP, source Port, destination port and protocol (TCP and UDP)}. All Tor traffic was TCP since the flow does not support UDP. The generation of flows was done by a new application, the ISCXFlowMeter which generates bidirectional flows [7].
Table I. Description of UNB-CIC Tor Network Traffic No. Type of Traffic Description
1 Browsing HTTP and HTTPS traffic generated by users while using Firefox and chrome
2 Email Traffic samples generated using a Thunderbird client and two other accounts holders. Mails were delivered through SMTP/S and received using POP3/SSL in client 1 and IMAP/SSL in client 2. 3 Chat Instant messaging applications were
identified under the chat label. The label was associated with Facebook and hangouts through web browser, skype and IAM and ICQ using an application called pidgin.
4
Audio-Streaming Traffic was captured from Spotify identifying audio applications that require a continuous and steady stream of data.
5 Video-Streaming Traffic was captured from YouTube and Vimeo services using Chrome and Firefox identifying video applications that require a continuous and steady stream of data.
6 File Transfer This traffic was generated from skype file transfers, FTP over SSH (SFTP) and FTP over SSL (FTPS) traffic sessions identifying the traffic applications sending or receiving file documents.
7 Voice over Internet Protocol (Voip)
[image:2.612.56.292.500.632.2]8 Peer-peer (p2p) This label identifies file sharing protocols like Bit torrent. The traffic was generated by downloading different torrent files from the Kali Linus distribution and captured traffic using Vuze application on different combinations of upload and download speeds.
Table II. Description of captured features
4.
DETECTION ALGORITHMS
4.1
Artificial Neural Network
Artificial neural network (ANN) consists of information processing elements known to mimic neurons of the brain.
[image:3.612.56.301.164.623.2]In this experiment, the neural network which is a Multilayer perceptron (MLP) is provided with a set labelled training set which learns a mapping from input features listed in table II represented as 𝑥 in Figure 2. to outputs (Tor and NonTor) as 𝑦 in Figure 2. given a labelled set of inputs-output pairs
𝑑 = {(𝑥', 𝑦')}'+,- (4)
Where, 𝑑 is called the training set and 𝑁 is the number of training examples. It is assumed that 𝑦' is a categorical variable from some
infinite set, 𝑦'∈ {1 … 𝐶} [15].The technique used to train the MLP
neural network is the Back Propagation hence the name MLP-BP. The construction of the MLP-BP neural network is by putting layers of non-linear elements to form complex hypotheses. Each node takes an element of a feature vector. The structure of the ANN consists of three layers feed-forward neural network as shown in Figure 2. Nodes labelled 𝑥,… … 𝑥3 have been used to
represent the input feature vectors to the ANN.
Figure 2. ANN model used in experiment
Hidden inner nodes 𝑎,… … 𝑎3 make up the hidden layer with an
output layer of 𝑦, 𝑎𝑛𝑑 𝑦7 nodes denoting different output classes
(Tor and NonTor). The interconnection between the nodes is associated with scalar weights with an initial weight assigned to the connection. During training, the weights are adjusted. Evaluating the hypotheses is done by setting the input modes in a feed-back process and the values are propagated through the network to the output. At this stage the gradient descent is used so as to push the error in the output node back through the network by a back propagation process in order to estimate the error in the hidden nodes. The gradient of the cost – function is then calculated [16].
4.2
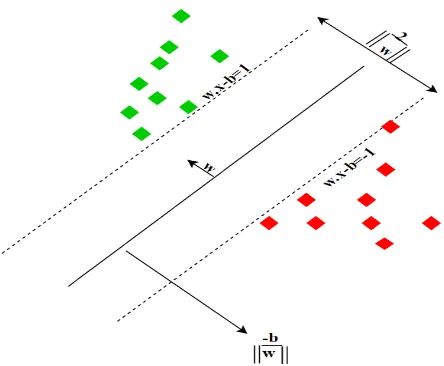
Support Vector Machines
Support Vector Machines (SVM) is a machine learning algorithm that learns to classify data using points labelled training examples falling into one or two classes. The SVM algorithm builds a model that can predict if a new example falls into one category or the other [17]. The model is constructed by constructing 𝑘 Models of SVM, where 𝑘 denotes the number of classes (Tor and NonTor). 𝑥, 𝑎𝑛𝑑 𝑦7 SVM represented as 𝑙th SVM is trained with
all the examples in the 𝑙th class labelled 1 and the other labelled 0. No. Feature Name Feature description
1 2 3 4 5 6 7 8 9 10 11 12 13 14 15 16 17 18 19 20 21 22 23 24 25 26 27 28 Source IP Source Port Destination IP Destination Port Protocol Flow Duration Flow Bytes/s Flow Packets/s Flow IAT Mean Flow IAT Std
Flow IAT Max Flow IAT Min Fwd IAT Mean
Fwd IAT Std
Fwd IAT Max
Fwd IAT Min
Bwd IAT Mean
Bwd IAT Std
Bwd IAT Max
Bwd IAT Min
Active Mean Active Std Active Max Active Min Idle Mean Idle Std Idle Max Idle Min
IP address sending packets from source to destination
Port sending packets from source IP address receiving packets from source Port receiving packets
Type of the protocol used, e.g. udp,tcp, etc Length of connection in seconds Number of data bytes
Number of data packets
Packets flow inter arrival time Mean Packets flow inter arrival time Standard deviation
Packets flow inter arrival time Max. Packets flow inter arrival time Min. Forward inter arrival time, the time between two packets Sent forward direction Mean. Forward inter arrival time, the time between two packets sent forward direction Standard deviation.
Forward inter arrival time, the time between two packets sent forward direction Max. Forward inter arrival time, the time between two packets sent forward direction Min. Backward inter arrival time, the time between two packets sent backward Mean. Backward inter arrival time, the time between two packets sent backward Standard deviation.
Backward inter arrival time, the time between two packets sent backward Max. Backward inter arrival time, the time between two packets sent backward Min. The amount of time a flow was active before becoming idle mean.
The amount of time a flow was active before becoming idle Standard deviation. The amount of time a flow was active before becoming idle Max.
The amount of time a flow was active before becoming idle Min.
The amount of time a flow was idle before becoming active Mean.
The amount of time a flow was idle before becoming active Standard deviation. The amount of time a flow was idle before becoming active Max.
[image:3.612.324.551.254.360.2]Figure 3. Maximum-margin hyper plane and margins for an SVM trained with samples from two classes.
Where,𝑥'∈ 𝑅;, 𝑦'∈ {1,0} ,𝑖 = 1 … . . 𝑁 and 𝑦'∈ {1 … … 𝑘} is a
class of 𝑥'. Introducing a slack of positive variables 𝜉', that
measures the extent of constraint in a non-linear situation. The prima Optimisation problem becomes [18]:
x
ll l
b
w
, ,min
,7 (𝑤A)B𝑤A+ ∁å
= N
i l
i 1
x
(𝑤A)B
f
(𝑥)'+ 𝑏A≥ 1 − 𝜉' A, 𝑖𝑓 𝑦'= 𝑁,
(6) (𝑤A)B
f
(𝑥)'+ 𝑏A≤ −1 + 𝜉'A, 𝑖𝑓 𝑦'= 𝑁,
𝜉'A≥ 0, 𝑖 = 1 … … 𝑁,
Where the training set 𝑥' are mapped into higher dimensional
space by the function
f
and ∁, where ∁ is a parameter which trades off wide margin with small number of margin failures . Minimisation of ,7(𝑤A)B𝑤A implies maximising 7JK , which is
the margin between the two data points. The SVM then searches for a balance between the regularisation term ,7(𝑤A)B𝑤A and the
errors in training the dataset. Solving (6) gives 𝑘 decision functions:
𝑤 ,B
f
𝑥 + 𝑏,⋮ 𝑤 MB
f
𝑥 + 𝑏Mwhere 𝑥 is the class having the largest value of the decision function:
𝑥 ≡ 𝑎𝑟𝑔𝑚𝑎𝑥A≡,…M( 𝑤A B
f
𝑥 + 𝑏A) (7)The dual problem of (6) having the same number of variables as the number of data in (6). Thus 𝑘 𝑁-variable quadratic programming problems are solved.
5.
EXPERIMENTAL RESULTS ANALYSIS
5.1 Results Evaluation Metrics
[image:4.612.314.565.169.315.2]The effectiveness of IDS requires high accuracy, high detection rate (Recall) and high Positive Predictive value (Precision) as well as low false positive rate. The performance of IDS in general is evaluated in terms of overall accuracy, detection rate and false positive rate. The confusion metrics shown in table III is used to evaluate these parameters.
Table III. Confusion Metrics Predicted Class
Tor traffic Nontor traffic
Actual Class Tor traffic TN FP
Nontor traffic FN TP
Accuracy (ACC)=BRSB-STRST-BR
Detection Rate (DR)=BRSTRBR
False Positive rate (FPR)=TRSB-TR
Positive Predictive Value (PPV)= BRSTRBR
Where, True Negative (TN): a measure of the number of normal events rightly classified normal.
True Positive (TP): a measure of attacks classified rightly as attack.
False Positive (FP): a measure of normal events misclassified as attacks.
False Negative (FN): a measure of attacks misclassified as normal.
5.2 Feature Selection
This paper proposes correlation based feature selection (CFS) to select the relevant features out of the 28 features.
[image:4.612.314.558.575.649.2]The CFS is an algorithm that is a heuristic evaluating with an appropriate correlation measure. A good set of features are highly correlated with the target (class) and at the same time uncorrelated to each other. The CFS algorithm reduces the dimensionality of the dataset, reduces overfitting and gives a shorter training time. Table IV shows the 10 selected features based on the appropriate correlation measure and heuristic search strategy.
Table IV. CFS features selection
No. Feature Name No. Feature Name
1 2 3 4 5
Destination Port Bwd IAT Mean Idle Max Fwd IAT Min Source Port
6 7 8 9 10
Idle Min Flow Bytes/s Flow IAT Std Source IP Destination IP
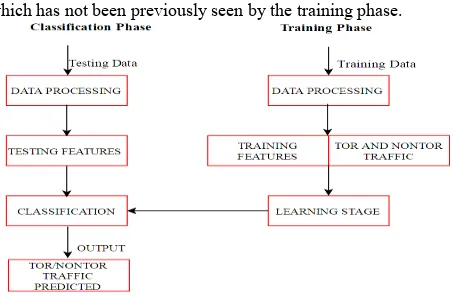
5.3 Experimental Results
distribution of the features with corresponding classes. During the classification phase, the learned model is applied to a test set which has not been previously seen by the training phase.
Figure 4. Experimental Model
In this work, experiment was performed by training ANN and SVM with UNB-CIC Tor Network Traffic dataset to detect nonTor Traffic.
In the first set of experiment, ANN was trained with all 28 features of the dataset with 20-hidden neurons and with 10 features selected using CFS with 6-hidden nodes. The ANN uses Levenberg-Marquardt training function (trainlm) for learning. In the second set of the experiment SVM was trained with all 28 features in the dataset and with 10 features selected using CFS. The performance of ANN and SVM was evaluated on train (70%) dataset, test (15%) dataset and validation 20% dataset.
Figure 5 shows the results after training ANN and SVM with all 28 features and 10 features selected by CFS. A.Lashkari et al.[1] Proposed C 4.5 in classifying Tor Traffic and nonTor Traffic using only the time based features of the dataset.
[image:5.612.60.286.75.223.2]Figure 5 Experimental results of SVM and ANN
Table V. Experimental results compared to A.Lashkari et al.[1]
DETECTION ALGORITHM
PERFORMANCE ANN
CFS-ANN
SVM
CFS-SVM
C4.5 [1]
DR (Tor) % 93.7 98.8 67 98.4 93.4
FPR (Tor) % 0.21 0.03 2.3 1.8 -
PPV (Tor) % 98.3 99.8 79 80 94.8
DR (nonTor) % 99.2 100 98 99 99.2
FPR (nonTor) % 1.6 1.2 32.8 2.6 -
PPV(nonTor) % 99.8 99.8 96 88 99.4
Overall ACC. % 99.1 99.8 94 88.1 -
The experimental results as compared to the results in [1] show CFS-ANN performs with an overall accuracy of 99.8% in the classification of Tor and nonTor using only 10 features in the dataset. On the other hand the DR for Tor and nonTor Traffic in CFS-ANN recorded 98.9% and 100% respectively which performed better than C 4.5. The best values in detection accuracy, detection rate with a low false positive rate in the classification of Tor and nonTor traffic were recorded by CFS-ANN making it a promising detection system for nonTor traffic. A comparison of experimental results with results from [1] are shown in table V.
6.
Conclusions
This paper presents experimental study using two algorithms to detect nonTor traffic in UNB-CIC Tor Network Traffic dataset. The research mainly focuses on detecting nonTor traffic in a representative dataset of real-world traffic to expose the activities within the Tor-traffic that downgrades the privacy of users. The work proposes CFS-ANN hybrid classifier in the detection of nonTor traffic in UNB-CIC Tor Network Traffic dataset. Experimental results show the proposed algorithm detects nonTor with an accuracy of 99.8%, detection rate of 100% and false positive rate of 1.2%. The proposed algorithm performed better than SVM and C4.5 proposed in [1] as shown in table IV. The proposed hybrid classifier reduces the dimensionality of the data size by 65% removing the less effective features thereby lowering computational cost and training time.
In the future, the performance of the proposed algorithm and deep neural networks will be analysed in the classification of the 8 different types of traffic in the UNB-CIC Tor Network Traffic dataset.
7.
ACKNOWLEDGMENTS
The authors would like to thank the Canadian Institute of Cyber Security, University of Brunswick for providing us with the dataset to carry out this work.
8.
REFERENCES
[1] A. H. Lashkari, G. D. Gil, M. S. I. Mamun, and A. A. Ghorbani, “Characterization of Tor Traffic using Time based Features,” pp. 253–262, 2017.
[2] T. Nguyen and G. Armitage, “A survey of techniques for internet traffic classification using machine learning,” IEEE Commun. Surv. Tutorials, vol. 10, no. 4, pp. 56–76, 2008.
[3] Roesch and Martin, “Snort - Lightweight Intrusion Detection for Networks,” in Proceedings of the 13th USENIX conference on System administration, 1999, pp. 229–238.
[4] B. Subba, S. Biswas, and S. Karmakar, “A Neural Network based system for Intrusion Detection and attack classification,” in 2016 Twenty Second National Conference on Communication (NCC), 2016, pp. 1–6. [5] G. A. Haidar and C. Boustany, “High Perception
[image:5.612.58.562.413.723.2]Intelligent, and Software Intensive Systems, 2015, pp. 497–501.
[6] X. J. A. Bellekens, C. Tachtatzis, R. C. Atkinson, C. Renfrew, and T. Kirkham, “A Highly-Efficient Memory-Compression Scheme for GPU-Accelerated Intrusion Detection Systems,” Proc. 7th Int. Conf. Secur. Inf. Networks - SIN ’14, pp. 302–309, 2014.
[7] N. K. Mittal, “A survey on Wireless Sensor Network for Community Intrusion Detection Systems,” in 2016 3rd International Conference on Recent Advances in Information Technology (RAIT), 2016, pp. 107–111. [8] J. Shun and H. a. Malki, “Network Intrusion Detection
System Using Neural Networks,” 2008 Fourth Int. Conf. Nat. Comput., vol. 5, pp. 242–246, 2008.
[9] E. Hodo, X. Bellekens, A. Hamilton, P.-L. Dubouilh, E. Iorkyase, C. Tachtatzis, and R. Atkinson, “Threat analysis of IoT networks Using Artificial Neural Network Intrusion Detection System,” in 2016 3rd International Symposium on Networks, Computers and Communications (ISNCC), 2016, pp. 1–6.
[10] E. Biglar Beigi, H. Hadian Jazi, N. Stakhanova, and A. A. Ghorbani, “Towards effective feature selection in machine learning-based botnet detection approaches,” in 2014 IEEE Conference on Communications and Network Security, 2014, pp. 247–255.
[11] “Canadian Institute for Cybersecurity | Research | Datasets | UNB.” [Online]. Available: http://www.unb.ca/cic/research/datasets/tor.html.
[Accessed: 27-Mar-2017].
[12] D. Rozenblum, “Understanding Intrusion Detection Systems,” SANS Inst., no. 122, pp. 11–15, 2001.
[13] E. Hodo, X. Bellekens, A. Hamilton, and C. Tachtatzis, “Shallow and Deep Networks Intrusion Detection System: A Taxonomy and Survey.” [Online]. Available: https://arxiv.org/ftp/arxiv/papers/1701/1701.02145.pdf. [Accessed: 31-Mar-2017].
[14] “What it is Network intrusion detection system? | COMBOFIX.” [Online]. Available: http://www.combofix.org/what-it-is-network-intrusion-detection-system.php. [Accessed: 10-Dec-2015]. [15] K. Murphy, “Machine learning: a probabilistic
perspective,” Chance encounters: Probability in …,
2012. [Online]. Available:
http://link.springer.com/chapter/10.1007/978-94-011-3532-0_2. [Accessed: 06-Jan-2015].
[16] M. A. Alsheikh, S. Lin, D. Niyato, and H.-P. Tan, “Machine Learning in Wireless Sensor Networks: Algorithms, Strategies, and Applications,” IEEE Commun. Surv. Tutorials, vol. 16, no. 4, pp. 1996–2018, 2014.
[17] C. J. C. Burges, “A Tutorial on Support Vector Machines for Pattern Recognition,” Data Min. Knowl. Discov., vol. 2, no. 2, pp. 121–167.