This is a repository copy of
The deteriorating effect of plasma density fluctuations on
microwave beam quality
.
White Rose Research Online URL for this paper:
http://eprints.whiterose.ac.uk/145691/
Version: Accepted Version
Article:
Köhn, Alf, Austin, Max E., Brookman, Michael W. et al. (13 more authors) (2019) The
deteriorating effect of plasma density fluctuations on microwave beam quality. EPJ Web of
Conferences. ISSN 2100-014X
https://doi.org/10.1051/epjconf/201920301005
[email protected] https://eprints.whiterose.ac.uk/
Reuse
This article is distributed under the terms of the Creative Commons Attribution (CC BY) licence. This licence allows you to distribute, remix, tweak, and build upon the work, even commercially, as long as you credit the authors for the original work. More information and the full terms of the licence here:
https://creativecommons.org/licenses/
Takedown
If you consider content in White Rose Research Online to be in breach of UK law, please notify us by
The deteriorating effect of plasma density fluctuations on microwave beam
quality
AlfKöhn1,2,∗,Max E.Austin3
,Michael W.Brookman3,Kenneth W.Gentle3,LorenzoGuidi2,EberhardHolzhauer1,Rob J.La Haye4,Jarrod B.Leddy5,OmarMaj2,Craig C.Petty4,EmanuelePoli2,Terry L.Rhodes6,AnttiSnicker2,7,Matthew B.Thomas5,Roddy G. L.Vann5, andHannesWeber2
1Institute of Interfacial Process Engineering and Plasma Technology, University of Stuttgart, Stuttgart, Germany 2Max Planck Institute for Plasma Physics, Garching, Germany
3Institute for Fusion Studies, University of Texas at Austin, TX, USA 4General Atomics, PO Box 85608, San Diego, CA, USA
5York Plasma Insitute, Department of Physics, University of York, York, U.K.
6Department of Physics and Astronomy, University of California Los Angeles, Los Angeles, CA, USA 7Department of Applied Physics, Aalto University, Aalto, Finland
Abstract.Turbulent plasma edge density fluctuations can broaden a traversing microwave beam degrading
its quality. This can be a problem for scenarios relying on a high spatial localization of the deposition of injected microwave power, like controlling MHD instabilities. Here we present numerical estimations of the scattering of a microwave beam by density fluctuations over a large parameter range, including extrapolations to ITER. Two codes are used, the full-wave code IPF-FDMC and the wave kinetic equation solver WKBeam. A successful comparison between beam broadening obtained from DIII-D experiments and corresponding full-wave simulations is shown.
1 Introduction
Electromagnetic waves in the microwave frequency range have become an indispensable tool for fusion experiments based on the magnetic confinement concepts of toka-mak and stellarator.Electron cyclotron resonance heating (ECRH) andcurrent drive(ECCD), see e.g. Refs. [1, 2], allow to transfer power in the MW-regime [3] to the plasma. On the other hand, active and passive microwave diagnostics occupying only very little space on the inner wall are routinely used in today’s experiment [4] and will become even more important in future reactors [5].
Heating and diagnostics suffer, however, both from plasma density fluctuations existing at the plasma bound-ary. These fluctuations can reach levels of up to 100 % [6] and potentially spoil heating efficiencies and result in am-biguous diagnostics results. This is in particular a prob-lem for the stabilization of so-calledneo-classical tearing modes(NTMs), a magneto-hydrodynamic instability aris-ing from small perturbations in the plasma current pro-file [7, 8]. If not taken care of, they can result in disrup-tions which are to be avoided at all costs in large-scale tokamaks like ITER. One way to stabilize the NTMs con-sists in localized current drive in order to restore the orig-inal current profile. ECCD has been successfully used to provide this current [9]. Using numerical tools to evaluate the consequences of edge density turbulence on the quality
∗e-mail: [email protected]
of a microwave beam injected for NTM stabilization is the topic of this paper.
The interaction of electromagnetic waves with plasma density fluctuations is an important topic since the very beginning of plasma physics: in the 1930, radio waves emitted from ground were found to be strongly disturbed after reflection at the ionosphere [10]. Likewise, radio waves emitted by distant rotating neutron stars experi-ence phase disturbances when passing the terrestrial iono-sphere which makes detection on Earth complicated. In the 1950s, this problem, which is still an issue for today’s satellite communication [11], was tackled by describing the ionosphere as a layer of thin phase screens [12]. This approach relies on small perturbation levels, and locally strong density irregularities provide still a challenge in modeling wave propagation across the ionosphere [13].
In the 1980s high-power microwave sources became available and the interaction of injected microwaves and plasma edge density fluctuations in fusion-relevant sce-narios was studied with geometrical-optics tools [14, 15]. Due to the potentially negative consequences for NTM sta-bilization in ITER, this topic has gained significant trac-tion since 2009 [16–21].
2 Numerical tools
2.1 The full-wave code IPF-FDMC
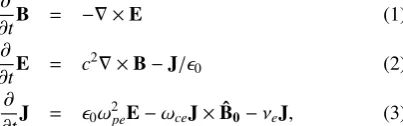
The full-wave code IPF-FDMC is based on the finite-difference time-domain scheme. It solves Maxwell’s
tion and the fluid equation of motion of the electrons on a 2D Cartesian grid. The evolution equations for the wave magnetic fieldB, the wave electric fieldE, and the current densityJof the wave read:
∂
∂tB = −∇ ×E (1)
∂
∂tE = c
2∇ ×
B−J/ǫ0 (2)
∂
∂tJ = ǫ0ω
2
peE−ωceJ×Bˆ0−νeJ, (3)
with c the speed of light, ǫ0 the vacuum permittivity,
ωpe= p
nee2/(ǫ0me) the electron plasma frequency,ωce=
|e|B0/methe electron cyclotron frequency,Bˆ0the unit vec-tor into the direction of the background magnetic field, and νe an electron collision frequency (as a dissipation
mechanism). More details about the code can be found in Refs. [22, 23].
2.2 The WKBeam code
The WKBeam code solves the wave kinetic equation in the presence of random density fluctuations embedded in a slowly varying background plasma density. The fluctua-tions are included by applying a scattering operator whose derivation is based on theBorn approximation[25]. The wave kinetic equation to be solved can be cast into a form such that the scattering operator depends only on the cor-relation functionof the random density field and thus re-mains valid even for short-scale fluctuations [26]. Details about the WKBeam code and the derivation of the under-lying equations can be found in Refs. [20, 23, 27]
Since the derivation of the scattering operator relies on the Born approximation, it is expected to become invalid for large fluctuation levels. More precisely,
h
h δne/ne,02i
i1/2
ω2pe/ω20≪1 (4)
needs to be fulfilled for the Born approximation to hold. Therefore the combination of fluctuation level and back-ground density needs to be taken into account. The valida-tion of the Born approximavalida-tion in WKBeam is investigated in detail in Ref. [23].
2.3 The simulation set-up
To benchmark WKBeam with the full-wave code IPF-FDMC, a 2D computational domain is chosen resembling part of a poloidal cross section in a toroidal magnetic con-finement device. The background plasma density profile is linearly increasing as
ne,0(x)=
ne,max
x1−x2
(x1−x), (5)
withne,max=0.65·ne,cut(wherene,cutis the O-mode cut-off
density of the injected microwave),xthe radial coordinate, x1 =2.45 m the position where the density profile starts to
rise until a position ofx2=2.30 m. A layer of fluctuations
[image:3.595.84.286.140.203.2]is added to the background profile, where the envelope of
Table 1.Simulation parameters for the benchmark together with typical ASDEX-Upgrade values
benchmark AUG
f 50 GHz 140 GHz
|B0| 1 T 2.5−3 T
L⊥ 5 mm 2−10 mm
w0 1 cm 3 cm
the fluctuation amplitudeF(x) is described by a Gaussian. The full electron plasma density profiles then reads
ne(x,z)=ne,0(x) (1+F(x)δne(x,z)), (6)
with z the vertical coordinate and δne(x,z) the random
field which is generated by a truncated sum of Fourier-like modes:
δne(x,z)= Mi X i Mj X j
Ai,jcos h
kx,ix+kz,jz+ϕi,j i
, (7)
withAi,jthe amplitudes of the modes andϕi,jindependent
random phases. There is no dependence on time as the turbulent density fluctuations appear to be frozen in the time frame of the microwave.
Figure 1 shows a contour plot of the resulting plasma density. Note that this is an actual sample used in the full-wave simulations as input. To properly simulate the effect of fluctuations in the full-wave code, an ensemble-average is required with the ensemble consisting of a series of sity profiles each being a sample of the same random den-sity field. We use synthetic turbulence to ensure that the statistics of the random field are the same as those assumed in WKBeam.
A Gaussian beam in O-mode polarization is injected with its focal point located inside of the grid (as can be seen in Fig. 1). The simulation parameters are listed in Table 1. They correspond to ASDEX Upgrade parameters scaled-down by approximately a factor of 3 (the reduction in frequency and hence increase in wavelength allows for coarser numerical grids to be used, strongly reducing the required computational resources).
2.4 Data analysis
The efficiency of the NTM stabilization depends on the good localization of the current driven by the injected mi-crowaves, as explained in the introduction. If the power deposition is too broad, the resulting current filament will be too broad to restore the original plasma current profile. Assuming as a first order approximation that the power deposition width corresponds to the beam width of the mi-crowave at the location of absorption (for a detailed dis-cussion about the correlation between microwave beam width and deposition profile width, see Ref. [31]), the ad-ditional broadening of the beam, as compared to the case without turbulence, is chosen as the quantity of interest to be compared between the two codes.
were considered, i.e. without turbulent density fluctu-ations (again, excellent agreement is found [23]). The resulting beam widths are used as reference positions to which the beam widths obtained from scenarios with fluc-tuations included are compared. In detail, Gaussians are fitted to the ensemble-averaged beam cross sections with the beam width being one fit parameter. The obtained val-ues are then normalized to the cases without fluctuations.
3 Simulation results
3.1 Illustration of beam broadening
Figure 1.Full-wave simulation grid with colored contour levels indicating the electron plasma density and contour lines indicat-ing the absolute wave electric field. Shown is a sample from the ensemble with the average fluctuation parameters given in the plot. The snapshot is taken from a video published at [24].
The effect of a layer of turbulent plasma density fluctu-ations on a microwave beam can be nicely illustrated with full-wave simulations, as shown in Fig. 1. The beam is in-jected from the right hand side and has its focal point ap-proximately where the density profile starts to rise. A split-ting of the injected beam is seen in this example, strongly perturbing the quality of the beam. The interested reader is referred to Ref. [24] where the video belonging to the snapshot shown in Fig. 1 can be seen.
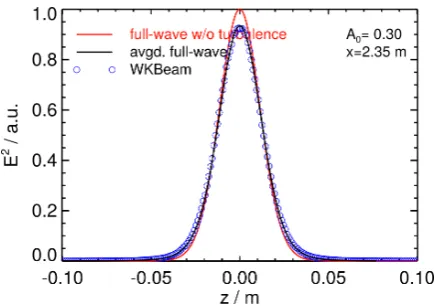
[image:4.595.314.532.76.229.2]For a quantitative data analysis, the average over the full ensemble of the full-wave simulations needs to be taken. This work uses an ensemble size of N = 3000 which is large enough to ensure that the statistical er-ror is small compared to the averages. Figure 2 shows the ensemble-averaged beam cross section from full-wave simulations together with the corresponding result from WKBeam calculations. The turbulence parameters are the same as for the single sample shown in Fig. 1. A first thing to notice is that the average beam does not change its di-rection of propagation. Hardly any difference of WKBeam to the full-wave solution can be seen in this representation. Both signals experience a small broadening (together with a reduction of the peak amplitude) as compared to the case without turbulence.
Figure 2. Beam cross section at a radial position ofx=2.35 m from full-wave simulations (ensemble-averaged) and WKBeam calculations.
3.2 Scanning the fluctuation parameters
In both codes, IPF-FDMC and WKBeam, the parameters defining the turbulent plasma density fluctuations were varied over a wide parameter range. This was done to ex-plore the ability of the codes to analyze current and future devices, as well as to explore the validity of the Born ap-proximation, expressed in Eq. (4), and thus of WKBeam. The fluctuation strength, the background density, and the width of the fluctuation layer were varied in a series of pa-rameter scans. Due to the limited space in this paper for the proceedings, we will only present a selection of the re-sults here and like to refer the interested reader to the full paper [23].
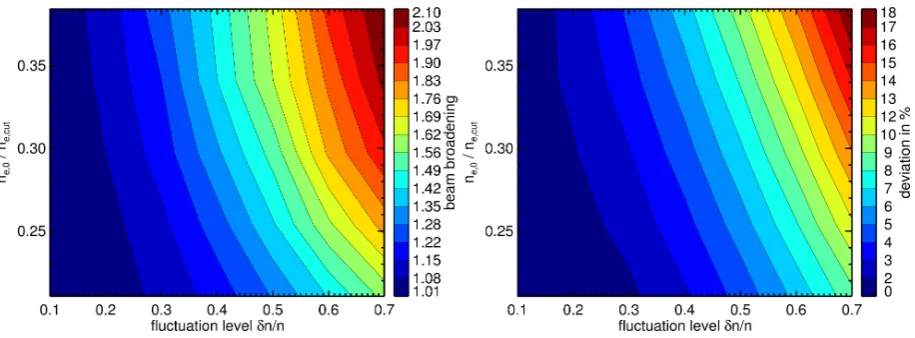
Figure 3 (left) shows the beam broadening deduced from full-wave simulations as a function of fluctuation level and background density at the location of the fluc-tuations. It can be clearly seen that the broadening is a function of both parameters, as expected. The contour plot on the right hand side shows the deviation of the corre-sponding WKBeam calculations with respect to the full-wave simulations. Note that WKBeam consistently over-estimates the broadening. Even for large fluctuation levels of 50 %, the disagreement to the full-wave solution is be-low 10 %. Recalling the criterion to be fulfilled for the Born approximation to hold, Eq. (4), it is possible to draw a rough estimation: with the y-axis corresponding to the first factor and the x-axis to the second factor, the result-ing product of the two quantities should be below 0.15 to keep the overestimation of WKBeam below 10 %.
Note that those results were obtained for a width of the fluctuation layer of approximatelyw0=2 cm≈3.3λ0,
withλ0the vacuum wavelength of the injected microwave.
According to the results discussed in Ref. [28], the beam broadening scales linearly with the width of the fluctuation layer if the fluctuation level is not too large. The observed scaling of the beam broadening may serve as estimations for current experiments or predictions for future experi-ments.
[image:4.595.62.282.255.418.2]Figure 3. (Left) Beam broadening as obtained from full-wave simulations as a function of the background density at the position of the fluctuation layer and as a function of the fluctuation level. (Right) Overestimation of the corresponding WKBeam results to the full-wave solution.
reach at maximum 0.2·ne,cut[29] and maximum fluctuation
levels of 20 % [30]. With the resulting control parameter given by Eq. (4) being below the stated value of 0.15 (and by checking Fig. 3 (right)) WKBeam can be reliably ap-plied for this scenario. Considering ITER parameters [20], the overestimation of WKBeam calculations is on the or-der of 1 % due to the correspondingly low (normalized) density. Note that the deviation of the WKBeam results does not depend on the width of the fluctuation layer [23]. Due to the long propagation length of the injected mi-crowave beam in ITER, this is an important information strengthening the reliability of WKBeam.
3.3 Extrapolations towards ITER
Mitigation and suppression of NTMs is of vital importance for future tokamak experiments as explained in the intro-duction. In ITER, the EC upper launcher system is de-signed for this purpose [32]. Recently, the importance of quantifying the influence of plasma density fluctuations on the efficiency of NTM stabilization in ITER has been high-lighted [31]. Due to the short spatial scales of the density fluctuations, their effect cannot be accounted for by tools based on the geometrical-optics approximations (which are otherwise commonly used to design and describe mi-crowave heating scenarios in fusion experiments). The WKBeam code was deliberately developed to handle this. Estimating the beam broadening due to plasma density fluctuations in ITER using WKBeam is the topic of a pa-per published earlier this year [20]. The main result of that paper will only be briefly discussed here.
As shown in Section 3.2, the strength of the scattering of the microwave beam, precisely the beam broadening, depends on a number of parameters of the turbulent den-sity fluctuations. Choosing a ”correct” set of parameters is therefore important to get reliable results. The term ”cor-rect” refers to parameters describing the flat top phase of the ITER baseline scenario [33]. The spatial profile of the fluctuations’ amplitude and the perpendicular correlation length of the density structures used in the modeling are
based on experimental surveys [34]. The fluctuations am-plitude profile we are using has a constant strength of 2 % in the core and 20 % in the scrape-offlayer, corresponding to an H-mode discharge.
Comparing first the power deposition profiles deduced from WKBeam and from the beam tracing code TOR-BEAM for the case without fluctuations, they reveal ex-cellent agreement. Including fluctuations, which cannot be done with codes like TORBEAM [35], a significant broad-ening of the deposition profile is found. Taking the effect of ballooning into account, i.e. a poloidal variation of the density fluctuation amplitude, an overall broadening of ap-proximately a factor of 2 is obtained. Considering the in-stalled microwave power in ITER, it can be concluded that the most dangerous NTMs expected to occur in the 15 MA Q = 10 standard H-mode scenario can still be stabilized based on the current model of the density fluctuations. As mentioned in the beginning of this section, a detailed dis-cussion of the results is found in Ref. [20].
Besides the EC upper-launcher system, ITER is also equipped with an equatorial EC launcher [36] aiming to influence the sawtooth cycle which is thought to affect the onset of NTMs. It is thus of interest to estimate the de-teriorating effect of density fluctuations on this scenario as well. The WKBeam code predicts a less severe beam broadening (referring to the upper-launcher calculations) of a factor of 1.2−2.5, as discussed in detail in Ref. [37]. Note that the broadening is also of less importance here as the requirement on the localization of the power deposition is reduced for influencing the sawtooth cycle.
3.4 Cross-polarization scattering
original polarization but the other polarization can itself deposit power at non-optimal positions or locally dam-age wall components if being reflected at a cut-off. Thus, the scattering operator in WKBeam has been extended to also included the possibility of mode scattering [37, 38]. As the underlying assumptions for deriving the scatter-ing operator are, however, only marginally fulfilled for the parameters where mode scattering can actually be rel-evant, a benchmark against full-wave simulations is re-quired. Here, we present preliminary results of cross-polarization scattering obtained from full-wave simula-tions in the course of this (ongoing) benchmark study.
The configuration of the simulations differs from the geometry described in Section 3.1: it is optimized to re-sult in a recognizable amount of mode-scattering. The wave frequency is increased to 110 GHz and the back-ground magnetic field has a component pointing into the 2D simulation domain, Btor = −1 T, and a vertical
com-ponent ofBz =1 T. The correlation length of the density
structures is L⊥ = 5 mm and the layer of fluctuations is
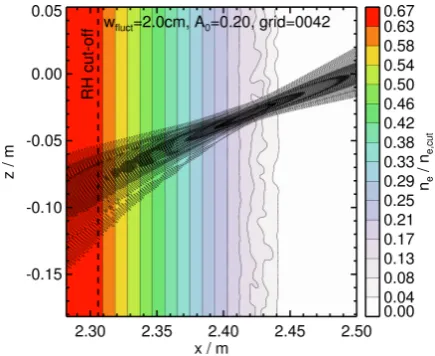
[image:6.595.63.281.459.637.2]shifted towards lower densities as shown in Fig. 4. Due to the oblique orientation of the background magnetic field, the injected O-mode is now elliptically polarized. As also shown in Fig. 4, the simulation domain includes the right-hand cut-off, which is a cut-offfor the X-mode, in order to serve as a filter for that part of the microwave beam which is scattered from the injected O-mode to the X-mode: the X-mode is reflected at the cut-offand can thus be easily de-tected. To visually separate the reflected X-mode from the injected O-mode, an appropriate injection angle is chosen such that the two modes do not overlap.
Figure 4.Contour plot of the electron plasma density (colored) and of the absolute value of the wave electric field as obtained from full-wave simulations intending to study cross-polarization scattering due to density fluctuations at low plasma densities.
Although no reflection at the right-hand cut-off is seen in Fig. 4 at first glance, a small amount of cross-polarization scattering does actually occur in this case. It is approximately 0.40 % which is too small to be visible in this representation. As expected, even for the case without density fluctuations, there is a small amount of coupling to the other mode. From the full-wave simulations, a value of
approximately 0.36 % is deduced for this geometry (which can be reduced by injecting wider beams with a narrower angular spectrum). The fluctuations thus result only in a small absolute increase of the wrong mode content.
WKBeam calculations yield an X-mode content larger by approximately a factor 2−3. Due to the assumptions be-ing applied when derivbe-ing the scatterbe-ing operator, this de-viation is expected to change with the background density (into the direction that lower densities, when the modes are ”more” degenerated, result in less reliable results). A systematic comparison between full-wave simulations and WKBeam is currently underway and will be published in a separate paper.
As stated in Refs. [37, 38], the cross-polarization scat-tering values obtained from WKBeam thus serve as an up-per bound. Together with the preliminary results from full-wave simulations, cross-polarization due to density fluctu-ations seems to be on the same order in ITER as the polar-ization uncertainty due to the launcher. It is therefore not expected to result in severe problems.
4 Simulation-experiment comparison
The microwave power deposition profiles can be exper-imentally determined using an electron cyclotron emis-sion diagnostic in power-modulated discharges. An ac-companying transport analysis separates the effect of pro-file broadening due to diffusion and due to other effects like a turbulent edge layer. Broadening of the injected EC beam of up to a factor of 2.5 could be determined in DIII-D this way, as presented on the last EC-conference [39]. In-spired by these experiments, we elaborated the possibility of performing simulations resembling the experiment as closely as possible. An ensemble of plasma density pro-files including turbulence was created with the BOUT++ code [40] using the Hermes model [41]. Equilibrium pro-files obtained from DIII-D discharges were used as in-put parameters. The fluctuation levels obtained from the BOUT++ simulations were confirmed to correspond to those found in the experiment.
5 Summary
We have shown that turbulent edge density fluctuations can lead to significant broadening of an injected mi-crowave beam. The stabilization of NTMs requires good spatial localization of the beam and the presented parame-ter scans of the fluctuation parameparame-ters may serve to quan-titatively estimate the reduction in efficiency. Full-wave simulations have been used to benchmark WKBeam cal-culations, where very good agreement was found of a large parameter range. In particular for the expected density fluctuations in ITER, the deviations of the WKBeam are negligible. This supports the results from the correspond-ing calculations for ITER, performed with WKBeam, pre-dicting that NTM stabilization is still possible in ITER taking into account the effect of fluctuations. A first es-timation of the effect of cross-polarization scattering has been performed, which seems to not be an issue in ITER. Finally, a comparison between beam broadening obtained from a series of DIII-D experiments and from full-wave simulations of these experiments was presented yielding excellent agreement.
Acknowledgments
This work has been carried out within the framework of the EUROfusion Consortium and has received funding from the Euratom research and training programme 2014−2018 under grant agreement No. 633053. The views and opin-ions expressed herein do not necessarily reflect those of the European Commission.
The authors are indebted to the efforts of the open-source software community.
References
[1] M. Bornaticiet al., Nucl. Fusion23, 1153 (1983). [2] V. Erckmannet al., Plasma Phys. Control. Fusion36,
1869 (1994).
[3] M. Thumm, Plasma Phys. Control. Fusion45, A143 (2003).
[4] H.-J. Hartfuss,Fusion Plasma Diagnostics with mm-Waves(Wiley-VCH, Weinheim, 2013)
[5] F. A. Volpe, JINST12C01094 (2017).
[6] S J Zwebenet al., Plasma Phys. Control. Fusion49 S1 (2007).
[7] R. J. La Haye, Phys. Plasmas13, 055501 (2006). [8] H. Zohmet al., Nucl. Fusion47, 228 (2007). [9] W. Kaspareket al., Nucl. Fusion56, 126001 (2016). [10] H. G. Bookeret al., Phil. Trans. Royal Society A242
579 (1950).
[11] L. C. Andrewset al., Applied Optics347742 (1995). [12] A. Hewish, Proc. Royal Society A20981 (1951).
[13] H. J. Strangeways et al., Radio Science 49 899 (2015).
[14] E. Ottet al., Phys. Fluids231031 (1980). [15] F. R. Hansenet al., Nucl. Fusion28, 769 (1988). [16] C. Tsironis, Phys. Plasmas16, 112510 (2009). [17] Y. Peyssonet al., Plasma Phys. Control. Fusion53
124028 (2011).
[18] A. Ramet al., Phys. Plasmas23, 022504 (2016). [19] Z. C. Ioannidis et al., Phys. Plasmas 24, 102115
(2017).
[20] A. Snickeret al., Nucl. Fusion58016002 (2018). [21] O. Chellaïet al., Phys. Rev. Lett.120105001 (2018). [22] A. Köhn, Investigation of microwave heating sce-narios in the magnetically confined low-temperature plasma of the stellarator TJ-K(Ph.D. thesis). [23] A. Köhn et al., Plasma Phys. Control. Fusion in
press.
[24] A. Köhn et al., TIB AV-Portal (2018). doi:10.5446/36093
[25] M. Born and E. Wolf, Principles of Optics: Elec-tromagnetic Theory of Propagation, Interference and Diffraction of Light (7th ed.)(Cambridge University Press, Cambridge, 1999) p. 695
[26] S. W. McDonald, Phys. Rev. A43, 4484 (1991). [27] H. Weberet al., EPJ Web of Conf.8701002 (2015). [28] A. Köhn et al., Plasma Phys. Control. Fusion 58
105008 (2016).
[29] M. Willensdorfer et al., Plasma Phys. Control. Fu-sion52114026 (2012).
[30] A. Medvedevaet al., Plasma Phys. Control. Fusion 59125014 (2017).
[31] E. Poliet al., Nucl. Fusion55013023 (2015). [32] M. Hendersonet al., Nucl. Fusion48054013 (2008). [33] V. Parailet al., Nucl. Fusion53113002 (2013). [34] G. Conway, Plasma Phys. Control. Fusion50124026
(2008).
[35] E. Poliet al., Comp. Phys. Comm.13690 (2001). [36] M. Henderson et al., Phys. Plasmas 22 021808
(2015).
[37] A. Snickeret al., Plasma Phys. Control. Fusion60 014020 (2018).
[38] L. Guidi et al., J. Phys.: Conf. Series775 012005 (2016).
[39] M. Brookmanet al., EPJ Web of Conf.147 03001 (2017).
[40] B. Dudson et al., Comp. Phys. Comm. 180 1467 (2009).
[41] B. Dudson et al., Plasma Phys. Control. Fusion59 054010 (2017).
[42] T. R. N. Williams, Plasma Phys. Control. Fusion56 075010 (2014)