SPATIOTEMPORAL PATTERNS OF
AVOIDANCE IN KINGS CROSS
AN EXPLORATION OF THE
ENVIRONMENTAL CUES THAT TRIGGER
FEAR OF CRIME
By
MELISSA BURGESS
A thesis submitted for the degree of Doctor of Philosophy
of the
Australian National University
Statement of Originality
Except where otherwise acknowledged, this thesis is my own original work. I declare that this thesis has not been submitted for a higher degree to any other
university or tertiary institution.
Regardless of whether crime is present, people avoid areas where they feel afraid of becoming a victim of crime. This behavioural response has caused fear of crime to emerge as a distinct phenomenon that can create numerous problems for both the individual and community. Research into fear of crime has the potential to provide valuable information that could be used to reduce the public’s fear of crime and curb the negative consequences that result from this phenomenon.
While fear of crime has been a topic of interest for a long period of time, only relatively recently have researchers begun to implement fear mapping as a tool for providing new information not available through traditional statistical means. This research uses avoidance mapping to provide a spatiotemporal investigation into people’s fear of being robbed, beaten or attacked. It also explores the environmental cues that trigger people’s fear and their consequent avoidance reaction. By doing this, the research tests the hypothesis that the spatial visualisation of avoidance can provide new information concerning public fear of crime.
This research was conducted in Kings Cross, New South Wales, an area historically associated with crime and fear of crime. A Geographic Information System was used to map areas that the respondents avoided because they were afraid of crime. Sixteen series of two-dimensional (2D) avoidance maps were produced, with each series of maps showing the patterns of avoidance triggered by a different environmental cue. Eight of these environmental cues related to the social environment. They included the presence of drug users, spruikers, homeless people, intoxicated persons, sex workers, gangs, loitering people and the absence of pedestrians. The remaining eight environmental cues related to the physical environment. They included the occurrence of poor street lighting and vandalism, the presence of rubbish or syringes, rundown or abandoned buildings, offensive or degraded shops, areas to hide, blocked escape and laneways.
avoidance. The perceived presence of drug users, intoxicated persons and gangs triggered the highest levels of avoidance. The perceived presence of sex workers triggered the lowest levels of avoidance. The avoidance maps further revealed that the environmental cues triggered distinct patterns of avoidance, showing obvious fear hotspots, as well as streets perceived to be safe thoroughfares through those fear hotspots. Likewise, many of the avoidance maps displayed streets that act as cognitive barriers separating seemingly safe and unsafe areas. This information provides some new spatially sensitive insights into how people react to fear of crime through avoidance. It additionally provides an evidence base that can be used by police and governments when allocating resources to specific environmental cues in those critical fear hotspots.
I would like to acknowledge the following people for their contributions to this study:
Professor Brian Lees, University of New South Wales at the Australian Defence Force Academy, for supervising my PhD research. Brian was exceptional in mentoring and offering both academic and general advice, while providing me with a great deal of independence. Brian’s consistent support, candour and availability is appreciated. Associate Professor Julie Stubbs, University of Sydney, is also recognised for co-supervising my PhD research. Julie provided thorough and constructive feedback on my chapter drafts. Julie gave particularly useful advice on the interviewing procedure and also liaised with her 2004 Masters of Criminology Students to conduct the interviewing. Dr Bruce Doran, Australian National University, for early assistance with the survey design and for reading and commenting on my final thesis draft. Professor Peter Kanowski, Australian National University, for supporting my application for an ANU PhD Scholarship. Peter also granted me permission to become an externally based PhD student, of which I am very grateful. Likewise, Peter approved SRES financial assistance enabling me to attend various Australian and international conferences during my PhD research.
in Policing (VIP) are appreciated for their time, professionalism and assistance conducting interviews. In particular, I would like to thank the VIPs Warwick and Jim for their outstanding participation. Their assistance was central to the acquisition of the large dataset used in the research. Helen Steptoe, VIP, also provided me with immense support during the data entry phase of the project.
Emeritus Professor Diana Howlett, for funding the Howlett Honours Prize for Geography. I was awarded this prize in 2004 and used the financial gift to purchase numerous fear of crime books that I could not find in Australian libraries. Douglas Grand, General Manager of the Kings Cross Licensing Accord, for his donation in 2004 to help with costs associated with the interviewing stage of the project. Associate Professor Mary Crock, The University of Sydney, for awarding me the Best Presentation at the 2005 Postgraduate Law Conference, which payment assisted me in becoming a member of various academic organisations.
Dr Don Weatherburn, Director of the NSW Bureau of Crime Statistics and Research, for granting me study leave from work during the final stages of my thesis writing. Jackie Fitzgerald, Deputy Director of the NSW Bureau of Crime Statistics and Research, for allowing me to use this study leave at times that I requested.
Barbara Burgess, my mum, for her encouragement throughout my studies. Mum also provided invaluable editing of my chapter drafts. Ron Kershaw, my ‘dad in-law’, for constantly accommodating and feeding me on university related trips to Canberra. SRES staff and students are thanked for creating the sense of community that extended to students based off-campus. My other friends and family are also acknowledged, for listening to the highs and lows of my PhD research.
PREFIXES ... i
Abstract ...i
Acknowledgements ...iii
Table of Contents ...v
List of Tables ... x
List of Figures ... x
List of Plates...xix
Glossary of Terms and Phrases ... xx
List of Acronyms ...xxiv
1. INTRODUCTION...1
1.1. Project motivation ...1
1.2. A contentious field of research ...3
1.2.1. Defining fear of crime ...4
1.2.2. Measuring fear of crime ...5
1.2.3. Analysing fear of crime ...6
1.3. Thesis outline ... 7
2. LITERATURE REVIEW ... 9
2.1. Difficulties defining fear of crime...9
2.1.1. Conceptual confusion in defining fear of crime ...9
2.1.2. Fear is an emotion, not a cognition ...10
2.1.3. Fear is distinct from other emotional reactions ...11
2.1.4. Fear triggered by the threat of crime ...12
2.1.5. Crime involves a violation of criminal law ...13
2.1.6. Types of fear of crime ... 14
2.1.7. Section synopsis: Fear of crime can be defined ...15
2.2. Factors associated with fear of crime...16
2.2.1. Criminal opportunity and risk of victimisation theories ...16
2.2.2. Demographic theories explaining fear of crime ...17
2.2.3. Social theories explaining fear of crime...22
2.2.4. Environmental theories explaining fear of crime ...30
2.2.5. Section synopsis: An opening for pertinent environmental studies ... 38
2.3. Fear of crime as a social problem ...39
2.3.1. Negative consequences at the individual level...39
2.3.2. Negative consequences at the community level...41
2.3.3. Combating fear of crime...46
2.3.4. Section synopsis: Research should provide useful information for fear of crime prevention through policy, planning and practice ...53
2.4. Contrasting methodologies for investigating fear of crime... 54
2.4.3. Section synopsis: A new direction with avoidance mapping ... 73
2.5. Summary of Literature Review... 74
3. RESEARCH DESIGN ... 75
3.1. Research aims ... 75
3.1.1. Theoretical approach ... 75
3.1.2. Conceptual approach ... 76
3.1.3. Measurement approach ... 76
3.1.4. Research setting... 77
3.1.5. Survey design ... 77
3.1.6. Interviewing approach... 78
3.1.7. Data visualisation and analysis approach... 78
3.2. Summary of the research design ... 79
4. METHODS: RESEARCH SETTING... 80
4.1. Site justification ... 80
4.2. Geographic location ... 81
4.3. Historical background ... 86
4.4. Demographic characteristics ... 88
4.5. Crime... 96
4.6. Fear of crime ... 102
4.7. Summary of the research setting... 103
5. METHODS: SURVEY DESIGN AND IMPLEMENTATION ... 104
5.1. The survey... 104
5.1.1. Survey design and layout ... 104
5.1.2. Survey questions ... 106
5.1.3. Section synopsis: An innovative fear of crime survey ... 118
5.2. The interviewing procedure ... 118
5.2.1. Standardised interviewing ... 119
5.2.2. Interviewer training ... 119
5.2.3. Recruitment of respondents... 122
5.2.4. Informed consent... 123
5.3. Summary of the survey and interviewing methods... 124
6. METHODS: AVOIDANCE MAPPING ... 125
6.1. Spatial data visualisation using GIS... 125
6.2. Production of the two-dimensional maps... 126
6.2.1. Printing the original survey maps... 128
6.2.2. The scanning process ... 128
6.2.3. The geometric transformation process ... 129
6.2.4. The raster cleanup process ... 130
6.2.5. The vectorisation process ... 131
6.2.8. The projecting process... 132
6.2.9. Adding the individual survey maps to produce avoidance density maps...133
6.3. Selecting environmental cues for 3D mapping ...135
6.4. Production of three-dimensional fear maps ...137
6.5. Production of the crime maps ...139
6.6. Summary of the fear mapping methods ... 139
7. RESULTS: SAMPLE CHARACTERISTICS ... 141
7.1. Questionnaire section: Socio-demographic questions ... 141
7.1.1. Question One: Sex... 141
7.1.2. Question Two: Age ... 142
7.1.3. Question Three: Housing tenure type...143
7.1.4. Question Four: Residential status...144
7.1.5. Question Five: Experience of victimisation ...146
7.1.6. Question Six: Reporting crime ...147
7.1.7. Question Seven: Social integration ...147
7.1.8. Question Eight: Confidence in the police...148
7.1.9. Question Nine: Fearfulness using a global measurement approach...149
7.1.10. Question Ten: Income ... 150
7.2. Mapping section: Crime-specific avoidance-based questions ... 151
7.2.1. Question 11 (Part A): Occurrence of avoidance ...152
7.2.2. Question 11 (Part B): Degree of avoidance hardness...154
7.2.3. Question 11 (Part C): Environmental cues triggering fear of crime ...155
7.3. Summary of sample characteristics...171
8. RESULTS: THE 2D AVOIDANCE MAPS ... 172
8.1. The data processing procedures ...172
8.2. The 2D avoidance density and avoidance hardness maps ...172
8.2.1. Avoidance density maps showing percentage of avoiding respondents ...173
8.2.2. Avoidance density maps used to rank the environmental cues ...176
8.2.3. Avoidance density maps used to highlight temporal changes in avoidance 179 8.2.4. Avoidance density maps used to identify areal differences in avoidance ....182
8.2.5. Avoidance hardness maps ...185
8.3. Summary of the 2D fear maps results ...188
9. EXAMINING THE 2D AVOIDANCE MAPS ... 189
9.1. The 2D avoidance density maps ...189
9.1.1. Ranking the environmental cues by proportion of avoiding respondents ....189
9.1.2. Highlighting temporal variation in avoidance patterns ...192
9.1.3. Highlighting areal variation in avoidance patterns... 192
9.1.4. The 2D avoidance hardness maps ... 194
10. RESULTS: THE 3D AVOIDANCE MAPS... 197
10.1. Interpreting the 3D avoidance maps ... 197
10.2. Fear of crime due to the perceived presence of drug users... 197
10.2.1. Avoidance during the day for all respondents... 198
10.2.2. Avoidance during the night for all respondents ... 199
10.2.3. Avoidance during the day and night for the male and female respondents201 10.2.4. Avoidance during the day and night for the residents and visitors ... 205
10.3. Fear of crime due to the perceived presence of gangs ... 209
10.3.1. Avoidance during the day for all respondents... 209
10.3.2. Avoidance during the night for all respondents ... 210
10.4. Fear of crime due to the perception of areas to hide... 213
10.4.1. Avoidance during the day for all respondents... 213
10.4.2. Avoidance during the night for all respondents ... 214
10.5. Fear of crime due to the perceived presence of sex workers ... 216
10.5.1. Avoidance during the day for all respondents... 216
10.5.2. Avoidance during the night for all respondents ... 216
10.5.3. Avoidance during the day and night for the male and female respondents219 10.5.4. Avoidance during the day and night for the residents and visitors ... 223
10.6. Summary of the 3D avoidance maps results ... 227
11. DISCUSSION AND IMPLICATIONS ... 228
11.1. People are afraid of crime ... 229
11.2. Who is afraid of crime?... 231
11.3. When are people afraid of crime? ... 232
11.4. Where are people afraid of crime?... 234
11.4.1. Three fear of crime hotspots... 235
11.4.2. Fear of crime in the Kings Cross neighbourhoods ... 236
11.4.3. Section synopsis: Implications for policy, planning and practice ... 242
11.5. Why are people afraid of crime?... 243
11.5.1. The environmental cues that triggered the most fear of crime... 244
11.5.2. The environmental cues that triggered an intermediate level of fear of crime ... 258
11.5.3. The environmental cues that triggered the least fear of crime ... 262
11.5.4. Sensitively addressing environmental cues... 270
11.5.5. Section synopsis: Implications for policy, planning and practice ... 271
11.6. An assessment of the research approach... 272
11.6.1. Advantages of the methods ... 272
11.6.2. Limitations relating to the methods... 278
11.6.3. Section synopsis: Implications for policy, planning and practice ... 284
12. CONCLUSIONS AND RECOMMENDATIONS ... 286
12.1. Addressing the research aims...286
12.1.1. People are afraid of crime ...287
12.1.2. People are afraid of crime during the day and night ...287
12.1.3. People are afraid of crime in specific fear hotspots ... 287
12.1.4. People’s fear of crime is triggered by different environmental cues ... 289
12.1.5. Socio-demographic groups have different fear of crime levels and avoidance patterns ... 290
12.2. The future of fear mapping ... 291
12.3. Final thesis statement ... 294
13. REFERENCES... 295
14. APPENDIX A: SUPPLEMENTARY METHODS ... 313
14.1. The interviewing procedure ... 313
14.2. The survey...313
14.3. Fear mapping methods ...324
14.3.1. The rasterisation process ... 324
14.3.2. The projecting process...325
14.3.3. Adding the individual grids to produce accumulative maps ...325
14.3.4. View, scene and layer settings on the 3D fear maps ...327
15. APPENDIX B: SUPPLEMENTARY RESULTS...328
15.1. Avoidance density maps showing percentage of avoiding respondents ...328
15.2. Avoidance density maps used to rank the environmental cues...343
15.3. Avoidance density maps used to highlight temporal changes ...358
15.4. Avoidance density maps used to identify areal differences in avoidance...373
15.5. Avoidance Hardness maps ... 388
15.6. A multi-angular view of the three-dimensional avoidance maps...403
Table 1. Number and rate per 100,000 population of selected offences recorded by NSW police in the
Kings Cross Local Area Command: 1999 to 2004 ... 97
Table 2. Number and rate per 100,000 population of selected offences recorded by NSW police in NSW: 2001 to 2004 ... 97
Table 3. Trends in selected offences for the Kings Cross Local Area Command: 2003 to 2004 & 2000 to 2004 ... 98
Table 4. Number, rate per 100,000 population and ranking of selected criminal incidents recorded by NSW police: 2002 to 2004 ... 99
Table 5. Top ten responses accounting for triggering respondents to feel unsafe... 103
Table 6. Definitions of the social factors used in the community safety survey... 116
Table 7. Definitions of the physical factors used in the community safety survey. ... 117
Table 8. The vectorisation settings used in the raster to vector conversion. ... 131
Table 9. The population contour intervals between the population percentile bands on the three-dimensional maps ... 137
Table 10. Chi-square analysis of socio-demographic variables and fear of crime. ... 153
Table 11. Environmental cues by ‘avoidance density rank’ and ‘avoidance percentage rank’ (1 is highest, 16 is lowest). ... 191
Table 12. A generalised overview of the avoidance hardness weightings on the avoidance hardness maps for each environmental cue during the day. The ‘North’ and ‘South’ refers to the study site north and south of William Street. ... 195
Table 13. Temporal changes in avoidance levels for the 16 environmental cues, by percentage of all respondents... 233
Table 14. Reflections on the survey questions. ... 280
List of Figures
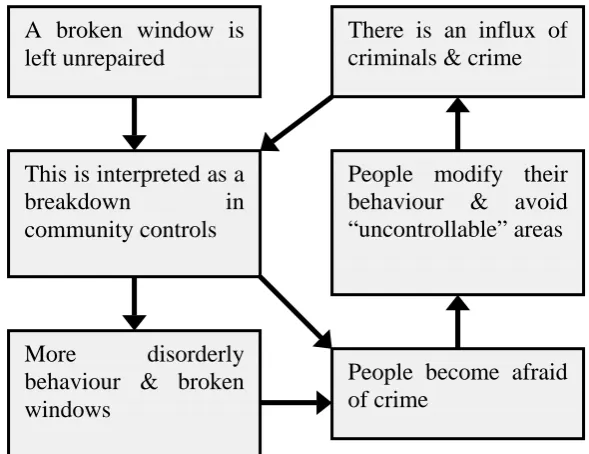
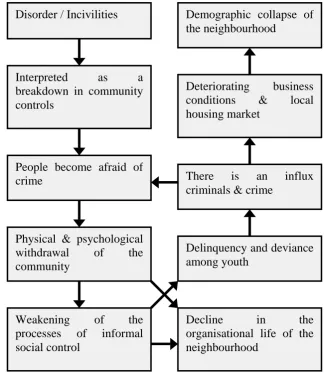
Figure 1. Flow chart illustrating the broken windows hypothesis... 42Figure 2. Flow chart illustrating the disorder and decline hypothesis...45
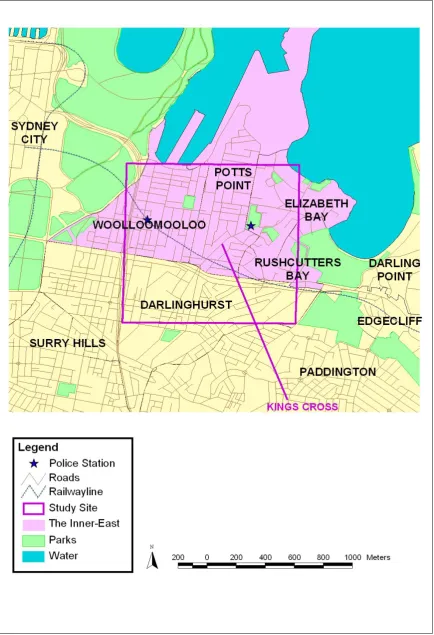
Figure 3. Map of Sydney, depicting Sydney’s inner-east... 83
Figure 4. Map of Sydney’s inner-east, depicting the Kings Cross study area. ... 84
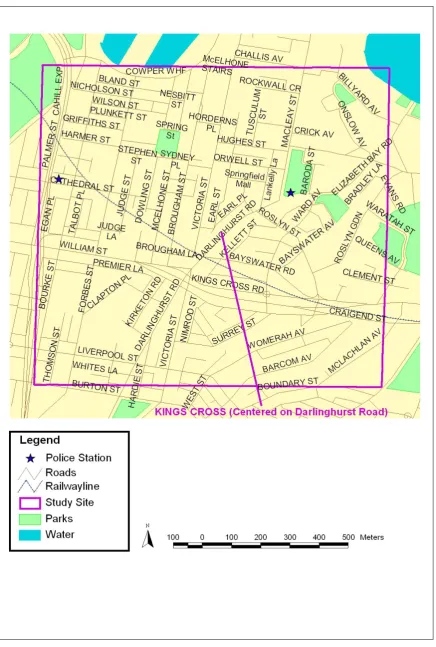
Figure 5. Street map of the Kings Cross study site. ... 85
Figure 6. The inner-east demographic by sex... 88
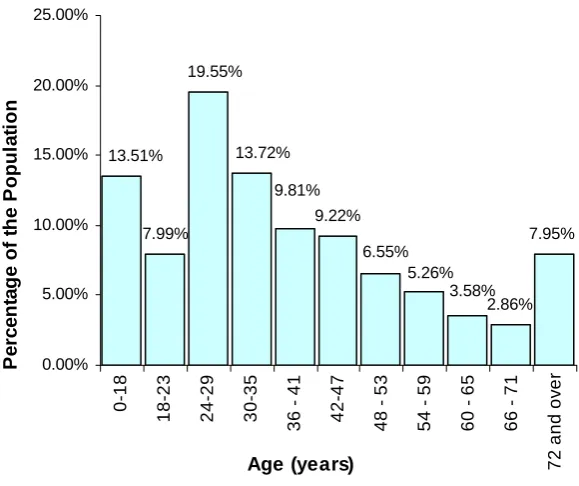
Figure 7. The inner-east demographic by age : Original census groupings ... 89
Figure 8. The inner-east demographic by: Re-grouped into age categories reflected in this survey ...89
Figure 9. The inner-east demographic by housing tenure type ... 90
Figure 10. Residential status of people in the inner-east in census night...91
Figure 11. Place of birth of people visiting the inner-east of census night ...91
Figure 12. The inner-east demographic by birthplace, by continental region ...91
Figure 13. The inner-east (left) and Sydney (right) demographics by annual individual income ...92
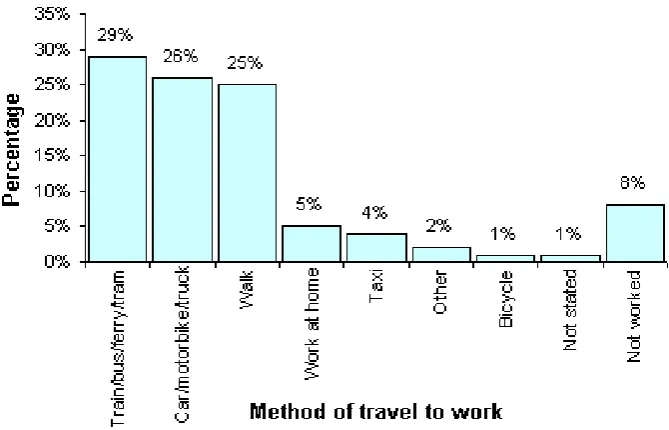
Figure 16. The inner-east demographic by method of travel to work ... 94
Figure 17. Sites of robbery and assault in the six-month period prior to interviewing ... 101
Figure 18. The UBD map used in the survey for Question 11, Parts A and B ... 113
Figure 19. Interviewing show card A... 114
Figure 20. Interviewing show card B (front and back) ... 115
Figure 21. The eight steps used to produce the 2D avoidance maps ... 127
Figure 22. A visual representation of the ‘grid adding’ process in ArcInfo. ... 134
Figure 23. A visual representation of how the 2D maps were combined for 3D display. ... 138
Figure 24. Respondent distribution according to sex (numbers and percentages). ... 141
Figure 25. Respondent distribution according to age (numbers and percentages) – original categories. ... 142
Figure 26. Respondent distribution according to age (numbers and percentages) – new categories.... 142
Figure 27. Respondent distribution according to housing tenure type (numbers and percentages). ... 143
Figure 28. Respondent distribution according to residential status (numbers and percentages). ... 144
Figure 29. Visitor distribution according to residential status (numbers and percentages)... 144
Figure 30. Resident distribution according to residential status (numbers and percentages)... 145
Figure 31. Respondent distribution according to experience of victimisation (numbers and percentages). ... 146
Figure 32. Respondent distribution according to experience of victimisation of crime in Kings Cross and reporting that crime to the police (numbers and percentages). ... 147
Figure 33. Respondent distribution according to whether they or their neighbours would call the police if they witnessed an assault (numbers and percentages)... 147
Figure 34. Respondent distribution according to their confidence in obtaining Police assistance in a crime-related emergency (numbers and percentages). ... 148
Figure 35. Respondent distribution according to global fear (numbers and percentages)... 149
Figure 36. Respondent distribution according to annual income (numbers and percentages)... 150
Figure 37. Number and percentage of respondents avoiding areas in the DAY. ... 152
Figure 38. Number and percentage of respondents avoiding areas in the NIGHT... 152
Figure 39. Number and percentage of respondents by degree of avoidance hardness for the DAY. ... 154
Figure 40. Number and percentage of respondents by degree of ‘avoidance hardness for the NIGHT. 154 Figure 41. Number and percentage of respondents who stated the presence of drug users was a factor in triggering their fear of being robbed, beaten or attacked in the DAY. ... 156
Figure 42. Number and percentage of respondents who stated the presence of drug users was a factor in triggering their fear of being robbed, beaten or attacked in the NIGHT. ... 156
Figure 43. Number and percentage of respondents who stated the presence of spruikers was a factor in triggering their fear of being robbed, beaten or attacked in the DAY. ... 157
Figure 44. Number and percentage of respondents who stated the presence of spruikers was a factor in triggering their fear of being robbed, beaten or attacked in the NIGHT. ... 157
Figure 45. Number and percentage of respondents who stated the presence of homeless people was a factor in triggering their fear of being robbed, beaten or attacked in the DAY... 158
Figure 46. Number and percentage of respondents who stated the presence of homeless people was a factor in triggering their fear of being robbed, beaten or attacked in the NIGHT. ... 158
factor in triggering their fear of being robbed, beaten or attacked in the NIGHT. ... 159
Figure 49. Number and percentage of respondents who stated the presence of sex workers was a factor in triggering their fear of being robbed, beaten or attacked in the DAY... 160
Figure 50. Number and percentage of respondents who stated the presence of sex workers was a factor in triggering their fear of being robbed, beaten or attacked in the NIGHT. ... 160
Figure 51. Number and percentage of respondents who stated the presence of gangs was a factor in triggering their fear of being robbed, beaten or attacked in the DAY. ... 161
Figure 52. Number and percentage of respondents who stated the presence of gangs was a factor in triggering their fear of being robbed, beaten or attacked in the NIGHT. ... 161
Figure 53. Number and percentage of respondents who stated the presence of loitering persons was a factor in triggering their fear of being robbed, beaten or attacked in the DAY. ... 162
Figure 54. Number and percentage of respondents who stated the presence of loitering persons was a factor in triggering their fear of being robbed, beaten or attacked in the NIGHT. ... 162
Figure 55. Number and percentage of respondents who stated pedestrian absence was a factor in triggering their fear of being robbed, beaten or attacked in the DAY. ... 163
Figure 56. Number and percentage of respondents who stated pedestrian absence was a factor in triggering their fear of being robbed, beaten or attacked in the NIGHT. ... 163
Figure 57. Number and percentage of respondents who stated poor street lighting was a factor in triggering their fear of being robbed, beaten or attacked in the DAY. ... 164
Figure 58. Number and percentage of respondents who stated poor street lighting was a factor in triggering their fear of being robbed, beaten or attacked in the NIGHT. ... 164
Figure 59. Number and percentage of respondents who stated the presence of vandalism was a factor in triggering their fear of being robbed, beaten or attacked in the DAY. ... 165
Figure 60. Number and percentage of respondents who stated the presence of vandalism was a factor in triggering their fear of being robbed, beaten or attacked in the NIGHT. ... 165
Figure 61. Number and percentage of respondents who stated the presence of rubbish / syringes was a factor in triggering their fear of being robbed, beaten or attacked in the DAY. ... 166
Figure 62. Number and percentage of respondents who stated the presence of rubbish / syringes was a factor in triggering their fear of being robbed, beaten or attacked in the NIGHT. ... 166
Figure 63. Number and percentage of respondents who stated the presence of rundown / abandoned buildings was a factor in triggering their fear of being robbed, beaten or attacked in the DAY.
... 167
Figure 64. Number and percentage of respondents who stated the presence of rundown / abandoned buildings was a factor in triggering their fear of being robbed, beaten or attacked in the NIGHT. ... 167
Figure 65. Number and percentage of respondents who stated the presence of offensive / degraded shops was a factor in triggering their fear of being robbed, beaten or attacked in the DAY. ... 168
Figure 66. Number and percentage of respondents who stated the presence of offensive / degraded shops was a factor in triggering their fear of being robbed, beaten or attacked in the NIGHT...168
Figure 67. Number and percentage of respondents who stated the presence of areas to hide was a factor in triggering their fear of being robbed, beaten or attacked in the DAY... 169
Figure 68. Number and percentage of respondents who stated the presence of areas to hide was a factor in triggering their fear of being robbed, beaten or attacked in the NIGHT. ... 169
Figure 69. Number and percentage of respondents who stated the presence of blocked escape was a factor in triggering their fear of being robbed, beaten or attacked in the DAY. ... 170
Figure 70. Number and percentage of respondents who stated the presence of blocked escape was a factor in triggering their fear of being robbed, beaten or attacked in the NIGHT. ... 170
triggering their fear of being robbed, beaten or attacked in the NIGHT. ... 171
Figure 73. Areas where the survey respondents stated the presence of DRUG USERS triggered their fear of being robbed, beaten or attacked – during the day and night. The aggregate avoidance data is displayed using classes representing 5% of avoiding respondents. ... 174
Figure 74. Areas where the survey respondents stated the presence of SEX WORKERS triggered their fear of being robbed, beaten or attacked – during the day and night. The aggregate
avoidance data is displayed using classes representing 5% of avoiding respondents. ... 175
Figure 75. Areas where the survey respondents stated the presence of DRUG USERS triggered their fear of being robbed, beaten or attacked – during the day and night. The aggregate avoidance data is displayed using a colour ramp with a minimum of zero and maximum of 40 for the day and 80 for the night. ... 177
Figure 76. Areas where the survey respondents stated the presence of SEX WORKERS triggered their fear of being robbed, beaten or attacked – during the day and night. The aggregate
avoidance data is displayed using a colour ramp with a minimum of zero and maximum of 40 for the day and 80 for the night... 178
Figure 77. Areas where the survey respondents stated the presence of DRUG USERS triggered their fear of being robbed, beaten or attacked – during the day and night. Aggregate avoidance data for each area is categorised into classes of two... 180
Figure 78. Areas where the survey respondents stated the presence of SEX WORKERS triggered their fear of being robbed, beaten or attacked – during the day and night. Aggregate avoidance data for each area is categorised into classes of two... 181
Figure 79. Areas where the survey respondents stated the presence of DRUG USERS triggered their fear of being robbed, beaten or attacked – during the day and night. The aggregate avoidance data is displayed using a colour ramp with a minimum of zero and a maximum equaling the true maximum value in the data. ... 183
Figure 80. Areas where the survey respondents stated the presence of SEX WORKERS triggered their fear of being robbed, beaten or attacked – during the day and night. The aggregate avoidance data is displayed using a colour ramp with a minimum of zero and a maximum equaling the true maximum value in the data. ... 184
Figure 81. Average degree of avoidance hardness for areas where the survey respondents stated the presence of DRUG USERS triggered their fear of being robbed, beaten or attacked – during the day and night... 186
Figure 82. Average degree of avoidance hardness for areas where the survey respondents stated the presence of SEX WORKERS triggered their fear of being robbed, beaten or attacked – during the day and night... 187
Figure 83. The Kings Cross study site depicting Blocks A, B and C, which make up the three common fear of crime hotspots... 193
Figure 84. Areas where the respondents stated the presence of DRUG USERS triggered their fear of being robbed, beaten or attacked – during the day and night... 200
Figure 85. Areas the MALES and FEMALES stated the presence of DRUG USERS triggered their fear of being robbed, beaten or attacked during the DAY. ... 203
Figure 86. Areas the MALES and FEMALES stated the presence of DRUG USERS triggered their fear of being robbed, beaten or attacked during the NIGHT... 204
Figure 87. Areas the RESIDENTS and VISITORS stated the presence of DRUG USERS triggered their fear of being robbed, beaten or attacked during the DAY. ... 207
Figure 88. Areas the RESIDENTS and VISITORS stated the presence of DRUG USERS triggered their fear of being robbed, beaten or attacked during the NIGHT. ... 208
Figure 89. Areas where the respondents stated the presence of GANGS triggered their fear of being robbed, beaten or attacked – during the day and night. ... 212
being robbed, beaten or attacked – during the day and night. ... 218
Figure 92. Areas the MALES and FEMALES stated the presence of SEX WORKERS triggered their fear of being robbed, beaten or attacked during the DAY. ... 221
Figure 93. Areas the MALES and FEMALES stated the presence of SEX WORKERS triggered their fear of being robbed, beaten or attacked during the NIGHT. ... 222
Figure 94. Areas the RESIDENTS and VISITORS stated the presence of SEX WORKERS triggered their fear of being robbed, beaten or attacked during the DAY. ... 225
Figure 95. Areas the RESIDENTS and VISITORS stated the presence of SEX WORKERS triggered their fear of being robbed, beaten or attacked during the NIGHT... 226
Figure 96. The interviewer ‘consent form’. ... 314
Figure 97. Map of the Kings Cross study site, highlighting the main areas where interviewing took place. ... 315
Figure 98. The information flyer. ... 316
Figure 99. Map of the Kings Cross Police Command, where the information flyers were distributed. .317
Figure 100. The information handout... 318
Figure 101a. Page 1 of the survey. ... 319
Figure 102. Areas where the survey respondents stated that the presence of SPRUIKERS triggered their fear of being robbed, beaten or attacked – during the day and night. The aggregate
avoidance data is displayed using classes representing 5% of avoiding respondents. ... 329
Figure 103. Areas where the survey respondents stated that the presence of HOMELESS people triggered their fear of being robbed, beaten or attacked – during the day and night. The aggregate avoidance data is displayed using classes representing 5% of avoiding
respondents... 330
Figure 104. Areas where the survey respondents stated that the presence of INTOXICATED PERSONS triggered their fear of being robbed, beaten or attacked – during the day and night. The aggregate avoidance data is displayed using classes representing 5% of avoiding
respondents... 331
Figure 105. Areas where the survey respondents stated that the presence of GANGS triggered their fear of being robbed, beaten or attacked – during the day and night. The aggregate avoidance data is displayed using classes representing 5% of avoiding respondents... 332
Figure 106. Areas where the survey respondents stated that the presence of LOITERING PEOPLE triggered their fear of being robbed, beaten or attacked – during the day and night. The aggregate avoidance data is displayed using classes representing 5% of avoiding
respondents... 333
Figure 107. Areas where the survey respondents stated PEDESTRIAN ABSENCE triggered their fear of being robbed, beaten or attacked – during the day and night. The aggregate avoidance data is displayed using classes representing 5% of avoiding respondents... 334
Figure 108. Areas where the survey respondents stated POOR STREET LIGHTING triggered their fear of being robbed, beaten or attacked – during the day and night. The aggregate avoidance data is displayed using classes representing 5% of avoiding respondents... 335
Figure 109. Areas where the survey respondents stated that the presence of VANDALISM triggered their fear of being robbed, beaten or attacked – during the day and night. The aggregate
avoidance data is displayed using classes representing 5% of avoiding respondents. ... 336
Figure 110. Areas where the survey respondents stated that the presence of RUBBISH / SYRINGES triggered their fear of being robbed, beaten or attacked – during the day and night. The aggregate avoidance data is displayed using classes representing 5% of avoiding
respondents... 337
SHOPS triggered their fear of being robbed, beaten or attacked – during the day and night. The aggregate avoidance data is displayed using classes representing 5% of avoiding respondents. ... 339
Figure 113. Areas where the survey respondents stated that the presence of AREAS TO HIDE triggered their fear of being robbed, beaten or attacked – during the day and night. The aggregate avoidance data is displayed using classes representing 5% of avoiding respondents. ... 340
Figure 114. Areas where the survey respondents stated that the presence of BLOCKED ESCAPE triggered their fear of being robbed, beaten or attacked – during the day and night. The aggregate avoidance data is displayed using classes representing 5% of avoiding
respondents. ... 341
Figure 115. Areas where the survey respondents stated that the presence of LANEWAYS triggered their fear of being robbed, beaten or attacked – during the day and night. The aggregate
avoidance data is displayed using classes representing 5% of avoiding respondents. ... 342
Figure 116. Areas where the survey respondents stated that the presence of SPRUIKERS triggered their fear of being robbed, beaten or attacked – during the day and night. The aggregate
avoidance data is displayed using a colour ramp with a minimum of zero and maximum of 40 for the day and 80 for the night... 344
Figure 117. Areas where the survey respondents stated that the presence of HOMELESS people triggered their fear of being robbed, beaten or attacked – during the day and night. The aggregate avoidance data is displayed using a colour ramp with a minimum of zero and maximum of 40 for the day and 80 for the night. ... 345
Figure 118. Areas where the survey respondents stated that the presence of INTOXICATED PERSONS triggered their fear of being robbed, beaten or attacked – during the day and night. The aggregate avoidance data is displayed using a colour ramp with a minimum of zero and maximum of 40 for the day and 80 for the night. ... 346
Figure 119. Areas where the survey respondents stated that the presence of GANGS triggered their fear of being robbed, beaten or attacked – during the day and night. The aggregate avoidance data is displayed using a colour ramp with a minimum of zero and maximum of 40 for the day and 80 for the night. ... 347
Figure 120. Areas where the survey respondents stated that the presence of LOITERING PEOPLE triggered their fear of being robbed, beaten or attacked – during the day and night. The aggregate avoidance data is displayed using a colour ramp with a minimum of zero and maximum of 40 for the day and 80 for the night. ... 348
Figure 121. Areas where the survey respondents stated PEDESTRIAN ABSENCE triggered their fear of being robbed, beaten or attacked – during the day and night. The aggregate avoidance data is displayed using a colour ramp with a minimum of zero and maximum of 40 for the day and 80 for the night... 349
Figure 122. Areas where the survey respondents stated POOR STREET LIGHTING triggered their fear of being robbed, beaten or attacked – during the day and night. The aggregate avoidance data is displayed using a colour ramp with a minimum of zero and maximum of 40 for the day and 80 for the night. ... 350
Figure 123. Areas where the survey respondents stated that the presence of VANDALISM triggered their fear of being robbed, beaten or attacked – during the day and night. The aggregate
avoidance data is displayed using a colour ramp with a minimum of zero and maximum of 40 for the day and 80 for the night... 351
Figure 124. Areas where the survey respondents stated that the presence of RUBBISH / SYRINGES triggered their fear of being robbed, beaten or attacked – during the day and night. The aggregate avoidance data is displayed using a colour ramp with a minimum of zero and maximum of 40 for the day and 80 for the night. ... 352
Figure 125. Areas where the survey respondents stated that the presence of RUNDOWN / ABANDONED BUILDINGS triggered their fear of being robbed, beaten or attacked – during the day night. The aggregate avoidance data is displayed using a colour ramp with a minimum of zero and maximum of 40 for the day and 80 for the night. ... 353
maximum of 40 for the day and 80 for the night... 354
Figure 127. Areas where the survey respondents stated that the presence of AREAS TO HIDE triggered their fear of being robbed, beaten or attacked – during the day and night. The aggregate avoidance data is displayed using a colour ramp with a minimum of zero and maximum of 40 for the day and 80 for the night. ... 355
Figure 128. Areas where the survey respondents stated that the presence of BLOCKED ESCAPE triggered their fear of being robbed, beaten or attacked – during the day and night. The aggregate avoidance data is displayed using a colour ramp with a minimum of zero and maximum of 40 for the day and 80 for the night... 356
Figure 129. Areas where the survey respondents stated that the presence of LANEWAYS triggered their fear of being robbed, beaten or attacked – during the day and night. The aggregate
avoidance data is displayed using a colour ramp with a minimum of zero and maximum of 40 for the day and 80 for the night. ... 357
Figure 130. Areas where the survey respondents stated that the presence of SPRUIKERS triggered their fear of being robbed, beaten or attacked – during the day and night. Aggregate population data for each area is categorised into classes of two. ... 359
Figure 131. Areas where the survey respondents stated that the presence of HOMELESS people triggered their fear of being robbed, beaten or attacked – during the day and night.
Aggregate population data for each area is categorised into classes of two. ... 360
Figure 132. Areas where the survey respondents stated that the presence of INTOXICATED PERSONS triggered their fear of being robbed, beaten or attacked – during the day and night.
Aggregate population data for each area is categorised into classes of two. ... 361
Figure 133. Areas where the survey respondents stated that the presence of GANGS triggered their fear of being robbed, beaten or attacked – during the day and night. Aggregate population data for each area is categorised into classes of two. ... 362
Figure 134. Areas where the survey respondents stated that the presence of LOITERING PEOPLE triggered their fear of being robbed, beaten or attacked – during the day and night.
Aggregate population data for each area is categorised into classes of two. ... 363
Figure 135. Areas where the survey respondents stated PEDESTRIAN ABSENCE triggered their fear of being robbed, beaten or attacked – during the day and night. Aggregate population data for each area is categorised into classes of two... 364
Figure 136. Areas where the survey respondents stated POOR STREET LIGHTING triggered their fear of being robbed, beaten or attacked – during the day and night. Aggregate population data for each area is categorised into classes of two. ... 365
Figure 137. Areas where the survey respondents stated that the presence of VANDALISM triggered their fear of being robbed, beaten or attacked – during the day and night. Aggregate population data for each area is categorised into classes of two. ... 366
Figure 138. Areas where the survey respondents stated that the presence of RUBBISH / SYRINGES triggered their fear of being robbed, beaten or attacked – during the day and night.
Aggregate population data for each area is categorised into classes of two. ... 367
Figure 139. Areas where the survey respondents stated that the presence of RUNDOWN / ABANDONED BUILDINGS triggered their fear of being robbed, beaten or attacked – during the day night. Aggregate population data for each area is categorised into classes of two. ... 368
Figure 140. Areas where the survey respondents stated that the presence of OFFESIVE / DEGRADED SHOPS triggered their fear of being robbed, beaten or attacked – during the day and night. Aggregate population data for each area is categorised into classes of two. ... 369
Figure 141. Areas where the survey respondents stated that the presence of AREAS TO HIDE triggered their fear of being robbed, beaten or attacked – during the day and night. Aggregate
population data for each area is categorised into classes of two. ... 370
Figure 142. Areas where the survey respondents stated that the presence of BLOCKED ESCAPE triggered their fear of being robbed, beaten or attacked – during the day and night.
fear of being robbed, beaten or attacked – during the day and night. Aggregate population data for each area is categorised into classes of two... 372
Figure 144. Areas where the survey respondents stated that the presence of SPRUIKERS triggered their fear of being robbed, beaten or attacked – during the day and night. The aggregate
avoidance data is displayed using a colour ramp with a minimum of zero and a maximum equaling the true maximum value in the data. ... 374
Figure 145. Areas where the survey respondents stated that the presence of HOMELESS people triggered their fear of being robbed, beaten or attacked – during the day and night. The aggregate avoidance data is displayed using a colour ramp with a minimum of zero and a maximum equaling the true maximum value in the data. ... 375
Figure 146. Areas where the survey respondents stated that the presence of INTOXICATED PERSONS triggered their fear of being robbed, beaten or attacked – during the day and night. The aggregate avoidance data is displayed using a colour ramp with a minimum of zero and a maximum equaling the true maximum value in the data. ... 376
Figure 147. Areas where the survey respondents stated that the presence of GANGS triggered their fear of being robbed, beaten or attacked – during the day and night. The aggregate avoidance data is displayed using a colour ramp with a minimum of zero and a maximum equaling the true maximum value in the data. ... 377
Figure 148. Areas where the survey respondents stated that the presence of LOITERING PEOPLE triggered their fear of being robbed, beaten or attacked – during the day and night. The aggregate avoidance data is displayed using a colour ramp with a minimum of zero and a maximum equaling the true maximum value in the data. ... 378
Figure 149. Areas where the survey respondents stated PEDESTRIAN ABSENCE triggered their fear of being robbed, beaten or attacked – during the day and night. The aggregate avoidance data is displayed using a colour ramp with a minimum of zero and a maximum equaling the true maximum value in the data. ... 379
Figure 150. Areas where the survey respondents stated POOR STREET LIGHTING triggered their fear of being robbed, beaten or attacked – during the day and night. The aggregate avoidance data is displayed using a colour ramp with a minimum of zero and a maximum equaling the true maximum value in the data. ... 380
Figure 151. Areas where the survey respondents stated that the presence of VANDALISM triggered their fear of being robbed, beaten or attacked – during the day and night. The aggregate
avoidance data is displayed using a colour ramp with a minimum of zero and a maximum equaling the true maximum value in the data. ... 381
Figure 152. Areas where the survey respondents stated that the presence of RUBBISH / SYRINGES triggered their fear of being robbed, beaten or attacked – during the day and night. The aggregate avoidance data is displayed using a colour ramp with a minimum of zero and a maximum equaling the true maximum value in the data. ... 382
Figure 153. Areas where the survey respondents stated that the presence of RUNDOWN / ABANDONED BUILDINGS triggered their fear of being robbed, beaten or attacked – during the day night. The aggregate avoidance data is displayed using a colour ramp with a minimum of zero and a maximum equaling the true maximum value in the data. ... 383
Figure 154. Areas where the survey respondents stated that the presence of OFFESIVE / DEGRADED SHOPS triggered their fear of being robbed, beaten or attacked – during the day and night. The aggregate avoidance data is displayed using a colour ramp with a minimum of zero and a maximum equaling the true maximum value in the data. ... 384
Figure 155. Areas where the survey respondents stated that the presence of AREAS TO HIDE triggered their fear of being robbed, beaten or attacked – during the day and night. The aggregate avoidance data is displayed using a colour ramp with a minimum of zero and a maximum equaling the true maximum value in the data. ... 385
fear of being robbed, beaten or attacked – during the day and night. The aggregate avoidance data is displayed using a colour ramp with a minimum of zero and a maximum equaling the true maximum value in the data... 387
Figure 158. Average degree of avoidance hardness for areas where the survey respondents stated that the presence of SPRUIKERS triggered their fear of being robbed, beaten or attacked – during the day and night. ... 389
Figure 159. Average degree of avoidance hardness for areas where the survey respondents stated that the presence of HOMELESS people triggered their fear of being robbed, beaten or attacked – during the day and night... 390
Figure 160. Average degree of avoidance hardness for areas where the survey respondents stated that the presence of INTOXICATED PERSONS triggered their fear of being robbed, beaten or attacked – during the day and night. ... 391
Figure 161. Average degree of avoidance hardness for areas where the survey respondents stated that the presence of GANGS triggered their fear of being robbed, beaten or attacked – during the day and night. ... 392
Figure 162. Average degree of avoidance hardness for areas where the survey respondents stated that the presence of LOITERING PEOPLE triggered their fear of being robbed, beaten or attacked – during the day and night. ... 393
Figure 163. Average degree of avoidance hardness for areas where the survey respondents stated PEDESTRIAN ABSENCE triggered their fear of being robbed, beaten or attacked – during the day and night. ... 394
Figure 164. Average degree of avoidance hardness for areas where the survey respondents stated that the presence of POOR STREET LIGHTING triggered their fear of being robbed, beaten or attacked – during the day and night. ... 395
Figure 165. Average degree of avoidance hardness for areas where the survey respondents stated that the presence of VANDALISM triggered their fear of being robbed, beaten or attacked – during the day and night... 396
Figure 166. Average degree of avoidance hardness for areas where the survey respondents stated that the presence of RUBBISH / SYRINGES triggered their fear of being robbed, beaten or attacked – during the day and night. ... 397
Figure 167. Average degree of avoidance hardness for areas where the survey respondents stated that the presence of RUNDOWN / ABANDONED BUILDINGS triggered their fear of being robbed, beaten or attacked – during the day and night. ... 398
Figure 168. Average degree of avoidance hardness for areas where the survey respondents stated that the presence of OFFENSIVE / DEGRADED SHOPS triggered their fear of being robbed, beaten or attacked – during the day and night. ... 399
Figure 169. Average degree of avoidance hardness for areas where the survey respondents stated that the presence of AREAS TO HIDE triggered their fear of being robbed, beaten or attacked – during the day and night... 400
Figure 170. Average degree of avoidance hardness for areas where the survey respondents stated that the presence of BLOCKED ESCAPE triggered their fear of being robbed, beaten or attacked – during the day and night... 401
Plate 1. Darlinghurst Road, Kings Cross. Looking north from Bayswater Road junction. Notice the building architecture and road works reflects the history of Kings Cross and the current
development interest in the region. ... 405
Plate 2. Darlinghurst Road, Kings Cross, looking east. Notice the adult entertainment premises and their resident spruikers. ... 405
Plate 3. Darlinghurst Road, Kings Cross. Restaurants and Cafes are encouraging alfresco dining. ... 406
Plate 4. The fountain and Fitzroy Gardens. A popular tourist attraction. ... 406
Plate 5. Springfield Avenue, off Darlinghurst Road. One of the more developed laneways in the area.407 Plate 6. New paving on Macleay Street. Reflects some of the regions history. ... 407
Plate 7. Sydney Place, Woolloomooloo. Featuring public amenities including the tennis courts, play ground, community garden, graffiti art and laneways. ... 408
Plate 8. Council signs to control disorder around Sydney Place, Woolloomooloo. ... 409
Plate 9. Public and private CCTV around Sydney Place, Woolloomooloo... 409
Plate 10. William Street, looking east. ... 410
Plate 11. A laneway in Woolloomooloo. ... 410
Attribute / attribute data Information describing the characteristics of map features in a Geographic Information System
(McDonnell & Kemp, 1995). For example, attributes of an area avoided by a respondent include the
respondent’s gender, age and income and the
environmental cues that triggered the respondent to feel afraid of crime in that area.
Attribute assigning The process of assigning attributes to map features.
Avoidance behaviour Defined by Du bow et al. (1979) as “actions to decrease exposure to crime by removing oneself from, or increasing the distance from, situations in which the risk of criminal victimization is believed to be high” (Garofalo, 1981).
Avoidance hardness How hard a respondent tried to avoid an area because they were afraid of crime.
Avoidance hardness
weights
The numeric values that represent how hard, on average, the respondents tried to avoid each area because they were afraid of crime.
Class Map features or raster pixels that are grouped into a category based on their attribute values representing a commonly defined condition. For example, two and ten respondents may respectively avoid two areas. The two areas may be grouped and displayed on the map in same way, both falling into the class of ‘0-5%’ of respondents avoiding an area of the study site.
Classification The process of arranging map features or raster pixels into groups or categories based on their attribute values and the process of representing those map features or raster pixels by the same symbol (McDonnell & Kemp, 1995).
Cognitive map A mental copy of ones environment, featuring information about the relative spatial location, arrangements and properties of phenomena (Levine, 1982 in Sholl, 1996; Downs, 1981; Block, 1998; Downs & Stea, 1973). Such phenomena include landmarks like buildings, parks or street junctions.
Coordinate system A fixed reference framework superimposed onto the surface of the earth to designate the position of points located on it, and a set of rules used to define the positions of points in space (McDonnell & Kemp, 1995).
because they depict an area lacking social control.
Environmental cues Physical or social factors which trigger fear of crime (includes disorders, incivilities and threatening environments).
Fiducial points A visually identifiable point in space that can be used to georeference a non-georeferenced image. The same point in space is identified on another image with a coordinate system. The coordinates for the point are obtained from this image and then assigned to the same point on the non-georeferenced image.
Geographic Information
System/s (GIS)
An arrangement of computer hardware and software that people interact with to integrate, analyse, and visualise spatial data; identify relationships, patterns, and trends; and find solutions to problems. The system is designed to capture, store, update, manipulate, analyse and display geographic information. A GIS is typically used to represent maps that can be studied and used to perform spatial analyses (McDonnell & Kemp, 1995).
Georeferencing
(also known as geometric transformation, polynomial transformation or
rectification)
Assigning coordinates from a known reference system to the page coordinates of a raster (image) or a planar map (McDonnell & Kemp, 1995). For example, assigning a latitude and longitude to the survey maps so that the avoided areas could be mapped in the GIS.
Geostatistics A class of statistics used to analyse and predict the values associated with spatial or spatiotemporal phenomena (McDonnell & Kemp, 1995). See also
spatial statistics.
Grid A network of parallel and perpendicular lines superimposed on a map and used for reference (McDonnell & Kemp, 1995). A more general term for a raster, see below.
Incivilities Another term for disorder. See above.
Mismatch The spatial dissonance between sites of crime and areas of fear of crime.
Natural surveillance The presence of other people on the street who can watch for criminals.
Polynomial transformation See Georeferencing.
Population percentile bands Contour lines on the 3D fear maps that show what percentage of the respondents avoided each area.
Projection / Projecting process
equally sized cells arranged in rows and columns. Each cell contains an attribute value and coordinates. Groups of cells sharing the same value represent geographic features or feature classes (McDonnell & Kemp, 1995).
Rasterisation The conversion of vector data (spatial data held as a series of points, lines, and polygons) to raster data (an array of cell values) (McDonnell & Kemp, 1995).
Raster cleanup The process of drawing, filling, and erasing raster cells using ArcScan Raster Cleanup and Raster Painting tools (McDonnell & Kemp, 1995).
Rectification See Georeferencing.
Scanning The process of capturing data from hard copy maps or images in raster format using a device called a scanner. The scanner records the information in raster format (McDonnell & Kemp, 1995).
Shapefile A vector data storage format for storing the location, shape and attributes of geographic features (McDonnell & Kemp, 1995).
Spatial analysis The process of examining the locations, attributes, and relationships of features in spatial data through overlay and other analytical techniques in order to address a question or gain useful knowledge. Spatial analysis extracts or creates new information from spatial data (McDonnell & Kemp, 1995).
Spatial behaviour Any form of human behaviour that involves or exhibits an interaction between the individual and one or more points in space (Louvierre, 1976). It is the result of a complex decision process that is dependent on one’s cognitive map of the spatial environment (Burnett, 1976; Downs & Stea, 1973; Freundschuh, 1998).
Spatial cognition Defined by Hart and Moore as “the internalised reflection and reconstruction of space in thought” (Golledge et al., 1976).
Spatial modelling The methodology or set of analytical procedures used to derive information about spatial relationships between geographic phenomena (McDonnell & Kemp, 1995).
Spatial statistics Statistical methods that use space and spatial relationships (such as distance, area, volume, length, height, orientation, centrality and/or other spatial characteristics of data) directly in their mathematical computations (McDonnell & Kemp, 1995).
contrast between cells of similar value when applied to raster datasets (McDonnell & Kemp, 1995). See also
geostatisitcs.
Symbology The set of conventions, rules, or encoding systems that define how geographic features (or classes) are represented with symbols (or colours) on a map (McDonnell & Kemp, 1995).
Threatening environments Areas that generate fear of crime for reasons other than the presence of disorder or incivilities.
Vector A coordinate-based data model that represents geographic features as points, lines, and polygons. Attributes are associated with each feature, as opposed to a raster data model, which associates attributes with grid cells (McDonnell & Kemp, 1995).
Vectorisation The conversion of raster data (an array of cell values) to vector data (spatial data held as a series of points, lines, and polygons) (McDonnell & Kemp, 1995).
z-factor A conversion factor used to adjust vertical and horizontal measurements into the same unit of measure. Specifically, the number of vertical units (z-units) in each horizontal unit (McDonnell & Kemp, 1995).
ABS AML(s) BOCSAR CPTED ESNA GDA GCS GIS LAC LGA MSIC NSW PCYCs TIFF UK USA
Australian Bureau of Statistics Arc Macro Language (Scripts)
NSW Bureau of Crime Statistics and Research Crime Prevention Through Environmental Design East Sydney Neighbourhood Association Inc Geocentric Datum of Australia
Geographic Coordinate System Geographic Information System(s) Local Area Command
Local Government Area
Medically Supervised Injecting Centre New South Wales
Police Citizens Youth Clubs Tag Image File Format United Kingdom
1. Introduction
This thesis is an exploratory study into the environmental cues that trigger people to feel afraid of being robbed, beaten or attacked. It investigates the hypothesis that spatial visualisation of avoidance can provide useful information not available using other techniques. It is hoped that the results from applying the avoidance mapping techniques developed in this study will increase both researchers’ and practitioners’ understanding of public fear of crime and have positive implications for policy, planning and practice.
1.1. Project motivation
Fear of crime is regarded as a distinct phenomenon separate from, yet related to, crime (Pain, 1991). While fear of crime is not always negative, provoking people to protect themselves when they are threatened, it becomes problematic when out of proportion with the objective risks of victimisation (Clark, 2003; Warr, 2000). Fear of crime is often found to exceed the real risk of crime, even when considering unreported incidents (Liska et al., 1988; Painter, 1996; Taylor & Hale, 1986). The mismatch between the fear of and the incidence of crime is evident from numerous broad level fear of crime studies. These have generally been macro-level analyses set in cities in the United Kingdom, Switzerland, New Zealand and Australia (Borooah, 1997; Box, 1988; Doeksen, 1997; Killias, 2000). However, more recently fear of crime is being examined in developing world contexts and it is likely that the mismatch occurs throughout the world (Chadee & Ditton, 2003). With consequences that negatively affect individuals and the community at large, fear of crime has become a social problem in some areas (Perkins & Taylor, 1996).
1997; Doran & Lees, 2003; Nasar, 1993; Painter, 1996). The disorder and decline hypothesis proposes that people physically and psychologically withdraw from such areas, which reduces informal social cohesion, control and surveillance (Skogan & Maxfield, 1981; Skogan, 1986; Skogan, 1990). This supposedly increases the attractiveness of affected areas for criminal opportunities. The broken windows hypothesis also contends that both opportunistic and professional offenders can then infiltrate the area and behave in a disorderly or criminal manner without being impeded (Wilson & Kelling, 1982). The presence of unimpeded disorder and crime encourages more disorder, crime and fear of crime (Wilson & Kelling, 1982). Thereby a positive feedback loop occurs that can ultimately lead to the physical, social, political and economic decay of feared neighbourhoods.
With the potential for public fear of crime to lead to such problems, even to a small degree, fear of crime has become a concern for a number of parties. First, individuals and communities themselves are concerned, as their lifestyles and neighbourhoods are impacted. Business managers and owners, who are affected by lost clientele and poor economic returns, may be interested in what they can do to curb fear of crime. The government, especially in the form of local councils, and agencies such as the police, are interested in maintaining their reputation and promoting a more positive opinion of fear affected neighbourhoods. Reducing fear of crime has become paramount to a variety of policing models employed by police in Australia and overseas (CPOP, 2003; Harcourt, 1998; Sims et al., 2002). For example, fear of crime now features in the primary mission statement of the New South Wales (NSW) Police Force, which is to provide “a safe NSW with a respected police force working with the community to reduce violence, crime and fear” (NSW Police, 2004). The Kings Cross Local Area Command (LAC), which has high levels of crime and disorder, has shown particular interest in the latter (Darcy, 2003; Jochelson, 1997; NSW Police, 2004).
countries suggest that fear reduction strategies are often unsuccessful. This is largely because of a number of problems and inconsistencies within the field of research that have limited the availability, usefulness and application of research findings to fear reduction strategies. It is hoped that the research methods used in this study produce results that are readily available, useful and applicable to future fear reduction plans in Kings Cross.
1.2. A contentious field of research
The potential for fear of crime to become a significant social problem was recognised in the 1960s and it has since been a topic of interest for researchers from a variety of academic disciplines (Farrall, et al., 2000; Van der Wuff, et al., 1989; Warr, 2000). Criminologists, sociologists, geographers and psychologists all study fear of crime, albeit from slightly alternative perspectives. These perspectives can be categorised into four main groups according to the type of factors that are hypothesised to explain fear of crime. The four groups are identified in this thesis as the ‘criminal opportunity and risk of victimisation’, ‘demographic’, ‘social’ and ‘environmental’ theories.
The criminal opportunity and risk of victimisation hypotheses propose that fear of crime is directly related to actual risk of crime. The demographic theories look to socio-demographic characteristics when explaining fear of crime and include the victimisation, indirect-victimisation and vulnerabilities hypotheses. The social theories look to qualities of the social neighbourhood, other than crime, when explaining fear of crime. These include the risk society, social disorganisation, sub-cultural diversity, social integration, community concern, and social change hypotheses. While the majority of fear of crime studies have examined fear of crime through the demographic or social theories, these hypotheses remain contested. They also provide results that can be difficult to incorporate into fear reduction strategies.
hypothesis proposes that people feel afraid of crime when they encounter signs of disorder or incivility in their environment. Incivilities generate fear because they signify a lack of order, the presence of crime or threat of victimisation (Mirrlees-Black & Allen, 1998 in Pantazis, 2000; Tulloch, 2000; Ross & Mirowsky, 1999). The signal crimes perspective extends the disorder/incivilities hypothesis. It concentrates on how and why different incivilities have a disproportionate impact on how people interpret them, and the extent that they connote criminogenic risk (Innes & Fielding, 2002; Innes, 2004). The threatening environments hypothesis expands further to acknowledge that fear of crime can still be triggered in environments where there is no crime or disorder. The hypothesis argues that environments can generate fear of crime simply because they are considered to be attractive sites for criminal activity.
This research is largely conducted from a geographer’s perspective and draws on the environmental theories to examine fear of crime. This study explores how disorder, incivility, signal crimes and threatening environments, categorised under the heading of ‘environmental cues’, trigger fear of crime. Because environmental cues can be managed and targeted by police and council through CPTED, the findings from studies examining fear of crime through these environmental theories can have real implications for the design of fear reduction strategies.
1.2.1. Defining fear of crime
of findings emphasises that, regardless of point of view, researchers need to explicitly state how they conceptualise and define fear of crime. Fear of crime must also be unequivocally defined so that the research approach can be tailored towards that particular conceptualisation, thereby curbing the possibility of any vagueness in the interpretation of research results.
This study employs Ferraro’s (1995) definition of fear of crime as an “emotional response of dread or anxiety to crime or symbols that a person associates with crime”. This study defines crime as a violation of criminal law, and the symbols associated with crime as those signs that feature in the environmental fear of crime theories.
1.2.2. Measuring fear of crime
One of the most important aspects of the research design for fear of crime studies is in the approach used to measure fear of crime. There is much debate in the literature regarding the most appropriate method to do this, a problem that is exacerbated by the conceptual uncertainties and conflicts in defining fear of crime. Traditionally fear of crime is measured using cognitive and affective approaches. Cognitive approaches measure what people think about risk and safety in general, rather than their genuine feelings of fear of crime (Ferraro & LaGrange, 1988; Pantazis, 2000). However, perceptions of risk differ from feelings of fear (Ferraro & LaGrange, 2000b). Perceptions of risk and feelings of fear also vary according to the type of crime under consideration, and consequently the general findings from cognitive approaches are critised as being useful for only broad level analyses. Affective approaches do measure people’s fear of a specific crime, yet result in vague and subjective responses that are difficult to compare (Ferraro & LaGrange, 2000b). Depending on the conceptual definition of fear of crime and objectives of the study, the research utility of these approaches is also limited to certain contexts.