Int. J. Electrochem. Sci., 9 (2014) 5549 - 5559
International Journal of
ELECTROCHEMICAL
SCIENCE
www.electrochemsci.orgInfluence of Electrode Radius on Apparent Lability of Complex
of Amalgam Forming Ions
Milivoj Lovrić* and Šebojka Komorsky-Lovrić
Department of Marine and Environmental Research, “Rudjer Bošković” Institute, 10000 Zagreb, Hrvatska (Croatia)
*
E-mail: [email protected]
Received: 22 May 2014 / Accepted: 18 June 2014 / Published: 16 July 2014
A theory of reversible electrode reaction preceded by the reversible chemical reaction is developed for square-wave voltammetry of amalgam forming ions on spherical electrode. It is shown that the lability parameter is diminished as the radius of electrode is decreased. This is in agreement with the previous calculations and shows that the diffusion of amalgam within the spherical electrode has no influence on the apparent lability of metal complex.
Keywords: Amalgam, metal ions, complex, spherical electrode, voltammetry
1. INTRODUCTION
this phenomenon is extended to electrode reactions of amalgam forming ions and the results are reported in this communication. In these reactions the diffusion of amalgam within the mercury drop must be taken in consideration [15 - 17]. Theoretical dependence of peak current and potential on the frequency and electrode radius is investigated in square-wave voltammetry. The chosen technique utilizes a combination of a staircase potential modulation and periodic square-shaped potential function [18]. It unifies the enhanced sensitivity of pulse techniques, the insight into the electrode mechanism of cyclic voltammetry and the information on kinetics of fast charge transfers [19, 20].
2. THE MODEL
It is assumed that in the bulk of solution there are an amalgam forming metal ion Mn+, a ligand Ln- and their complex ML and that the ion and the complex are connected by the first order dissociation and the second order complex formation kinetics. Finally, a reversible electrode reaction of free metal ions on mercury drop electrode is considered:
ML Mn+ + Ln- (1)
Mn+ + ne- M(Hg) (2)
(3) (4) (5) (6) (7) (8) (9) (10) (11) (12) (13)
The meanings of symbols are the following: and are concentrations of the complex ML and ions Mn+ and Ln- in the electrolyte and atoms M in the mercury, respectively, and are the bulk concentrations of the complex and the ions, is the stability constant of the complex, is electrode potential, is standard potential of electrode reaction (2), is a common diffusion coefficient, is a current, is a number of electrons, is Faraday constant, is the electrode surface area and is the radius of mercury electrode.
The mass transport is calculated by the Feldberg approximation [21]:
(16) (17)
Here: , , , , , is the rate
constant of dissociation of the complex and . The simulation procedure is described in the Appendix. The results are reported as dimensionless current . In square wave voltammetry the current is sampled at the end of each pulse and the difference between two subsequent samples is called the net response: . The forward, reductive ( ) and the backward, oxidative ( ) components of the net response are also reported as a function of the potential of staircase ramp.
The responses depend on the pulse amplitude , the potential step , the kinetics of chemical reaction and the inverse value of dimensionless electrode radius . In the simulation each pulse is divided into 25 time increments and the dimensionless diffusion coefficient d = 0.4 was used (see eq. A11). So, the parameter depends on the number of space increments into which the electrode radius is divided: .
3. RESULTS AND DISCUSSION
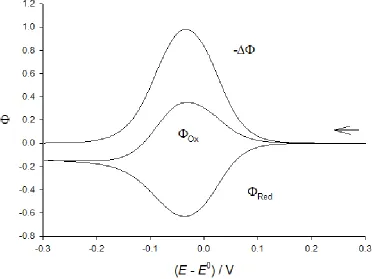
Figure 1. A theoretical dimensionless square wave voltammogram of electrode reaction (2). A negative net response ( ) and its forward ( ) and backward ( ) components are shown. = 0.3 V vs. , = 50 mV, = -2 mV, = 0.1, = 5, = 103 L/mol,
[image:3.596.109.482.411.690.2]
Figure 1 shows an example of square wave voltammogram of electrode reaction (2). The dimensionless net peak current is 0.98 and the peak potential is -0.034 V vs. . The minimum and maximum of the reductive and oxidative components of the response appear at -0.036 V and -0.030 V, respectively. The limiting currents of both components tend to if . However, the extremes of components do not vanish with the diminishing of electrode radius, as they do in the case of solution soluble product [22], because of the diffusion of amalgam that is restricted to the finite space within the drop [23].
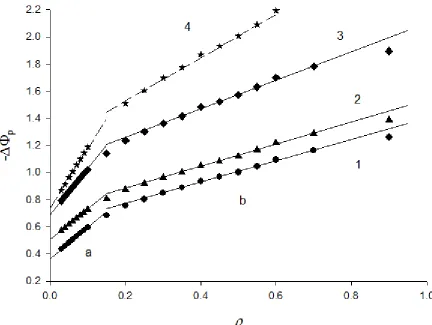
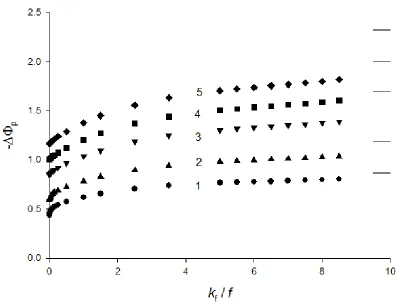
Figure 2. Dependence of dimensionless net peak current on the dimensionless inverse electrode radius; = 0 (1), 0.5 (2), 7.5 (3) and (4). All other parameters are as in Fig. 1.
The relationships between net peak currents and the parameter are shown in Fig. 2. They are curves with two asymptotes that are marked as (a) and (b). The curves (1) and (4) correspond to totally inert complex and to ideally labile complex, respectively. These two curves show dependence of pure diffusion flux density on electrode radius. In the case of inert complex, the current depends solely on the diffusion of free metal ions. Their bulk concentration is related to the total metal concentration by
the following equation: . For the product , the ratio is equal
to 0.5. For this reason the slopes and intercepts of straight lines (a) and (b) in curve (4) are twice as big as the corresponding slopes and intercepts in curve (1). These values are as follows:
[image:4.596.79.511.217.542.2]
(1b). They are in agreement with the results of calculations of simple electrode reaction [23]. Under the influence of dissociation of complex, the peak currents increase but their dependence on does not change essentially. The asymptotes (a) and (b) in the curves (2) and (3) are
given by the following equations: (2a), (3a),
(2b) and (3b). Considering the definitions of and the surface area of hemispherical microelectrodes, these straight lines indicate the dependence of the real net peak current on electrode radius and frequency. For instance, the line (3b) can be transformed into the following equation:
(18)
However, the number 1.05 in the brackets of eq. (18) is the function of the ratio , which is the dimensionless rate constant of dissociation of complex. This shows that the relationship between
and the square-root of frequency is a curve that does not pass through the origin.
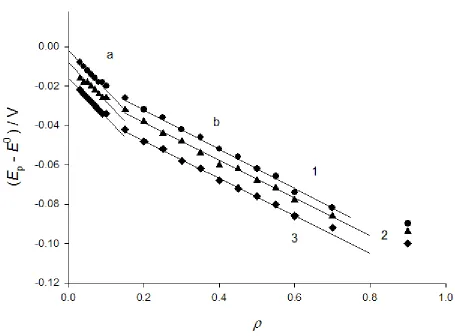
Figure 3. Dependence of net peak potentials on the dimensionless inverse electrode radius; = 0 (1), 0.5 (2) and 7.5 (3). All other parameters are as in Fig. 1.
[image:5.596.63.518.297.633.2]
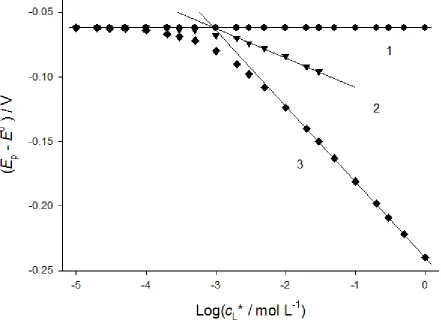
0.012 (1b), 0.019 (2b) and 0.029 (3b). These shifts of peak potentials are caused by the energy that is needed for the partial dissociation of the complex. This phenomenon can be used for the determination of stability constant of the complex by the method of DeFord and Hume [24]. The relationship between peak potentials and the logarithm of concentration of ligand is shown in Fig. 4 for three types of complexes and two values of sphericity parameter. If the complex is totally inert, the peak potential is independent of the ligand concentration. The dependence of on log of ideally labile complex is a curve that tends to the asymptote:
- 0.059 log - 0.059 log (19)
The cross section of this asymptote and the straight line determines the logarithm of stability constant: log = -(log )cross. This cross section is independent of the parameter . In the general case the peak potential is a function of the kinetics of dissociation of complex as well as of the ligand concentration and dimensionless electrode radius. This is shown by the curve (2) in Fig. 4. If = 0.03 this curve tends to the straight line:
Figure 4. Dependence of peak potential on the logarithm of ligand concentration; = 0.03 (A) and 0.5 (B); = 0 (1), 0.5 (2) and (3). All other parameters are as in Fig. 1.
The slope of this line indicates that the number of ligands in the complex is 0.58. The physical meaning of this number is that 58% of the complex is dissociated during the voltammetric measurement. If = 0.5 the slope of the straight line (2) is -0.023 V, which indicates that the number of ligands is 0.39. This means that the complex appears less dissociated if the parameter is bigger. However, the stability constants that are determined from the cross sections of straight lines (1) and (2) do not depend on significantly: log = 2.94 if = 0.03 and log = 3 if = 0.5.
Figure 5 shows the dependence of net peak currents on the dimensionless rate constant of dissociation of complex. Within the interval 0.01 < < 6 these relationships satisfy a general equation:
(21)
[image:8.596.97.496.85.387.2]
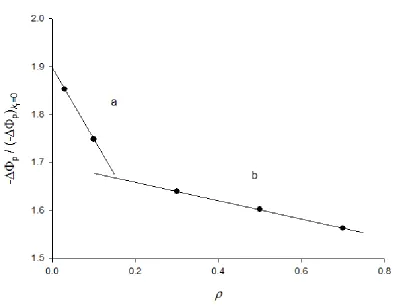
Figure 6. An influence of dimensionless inverse electrode radius on the ratio of net peak current and the limiting net peak current for ideally labile (A) and totally inert complex (B); = 8.5 and all other parameters as in Fig. 1.
This relationship consists of two straight lines, one for < 0.2 and the other for > 0.2: = -0.74 + 0.95 (22)
= -0.10 + 0.85 (23)
Fig. 6B shows that the dependence of the ratio on the parameter can be also described by two straight lines:
= -1.48 + 1.90 (24) = -0.19 + 1.70 (25)
The limiting currents and depend solely on the diffusion, while is caused by both diffusion and dissociation. Fig. 6 demonstrates that for the same dimensionless rate constant and the same concentrations of metal and ligand, the contribution of the dissociation to the mixed flux is smaller if is bigger. This means that the complex appears more inert if the electrode radius is smaller.
4. CONCLUSIONS
[image:9.596.102.495.63.369.2]
indicates higher number of ligands in the complex if the radius of electrode is bigger. Also, the degree of dissociation of complex apparently decreases with the increasing sphericity parameter. So, the complex may appear less labile at microelectrode than at macroelectrode.
APPENDIX:
Dimensionless concentrations are defined as follows: ,
, and where
. Dimensionless current is calculated by the following formulae:
(A1)
(A2)
(A3)
(A4)
(A5)
(A6)
(A7)
(A8)
(A9)
(A11) (A12) (A13) (A14) ACKNOWLEDGEMENT
The financial support by the Croatian Science Foundation in the frame of the project number IP-11-2013-7379 is gratefully acknowledged.
References
1. H. P. van Leeuwen, R. M. Town, J. Buffle, R. F. M. J. Cleven, W. Davison, J. Puy, W. H. van Reimsdijk and L. Sigg, Environ. Sci. Technol. 39 (2005) 8545.
2. J. Feldmann, P. Salaun and E. Lombi, Environ. Chem. 6 (2009) 275.
3. J. P. Pinheiro and H. P. van Leeuwen, J. Electroanal. Chem. 570 (2004) 69.
4. D. Omanović, C. Garnier, Y. Louis, V. Lenoble, S. Mounier and I. Pižeta, Anal. Chim. Acta 664 (2010) 136.
5. Y. Louis, P. Cmuk, D. Omanović, C. Garnier, V. Lenoble, S. Mounier and I. Pižeta, Anal. Chim. Acta 606 (2008) 37.
6. H. P. van Leeuwen, J. Puy, J. Galceran and J. Cecilia, J. Electroanal. Chem. 526 (2002) 10. 7. Y. Louis, C. Garnier, V. Lenoble, S. Mounier, N. Cukrov, D. Omanović and I. Pižeta, Mar. Chem.
114 (2009) 110.
8. D. Omanović, Croat. Chem. Acta 79 (2006) 67.
9. R. Nicolau, Y. Louis, D. Omanović, C. Garnier, S. Mounier and I. Pižeta, Anal. Chim. Acta 618 (2008) 35.
10.H. P. van Leeuwen and J. P. Pinheiro, J. Electroanal. Chem. 471 (1999) 55.
11.J. Galceran, J. Puy, J. Salvador, J. Cecilia and H. P. van Leeuwen, J. Electroanal. Chem. 505 (2001) 85.
12.M. Lovrić and Y. I. Turyan, Croat. Chem. Acta 76 (2003) 189.
13.A. Molina, I. Morales and M. Lopez-Tenes, Electrochem. Commun. 8 (2006) 1062. 14.N. Fatouros, D. Krulic and N. Larabi, J. Electroanal. Chem. 549 (2003) 81.
15.A. Molina, C. Serna, F. Martinez-Ortiz and E. Laborda, Electrochem. Commun. 10 (2008) 376. 16.M. Rudolph, J. Electroanal. Chem. 503 (2001) 15.
17.M. A. Baldo, S. Daniele and G. A. Mazzocchin, Electrochim. Acta 41 (1996) 811.
18.V. Mirčeski, R. Gulaboski, M. Lovrić, I. Bogeski, R. Kappl and M. Hoth, Electroanalysis 25 (2013) 2411.
19.J. J. O'Dea, J. Osteryoung and R. A. Osteryoung, Anal. Chem. 53 (1981) 695.
20.K. Aoki, K. Tokuda, H. Matsuda and J. Osteryoung, J. Electroanal. Chem. 207 (1986) 25.
21.S. W. Feldberg, in A. J. Bard (Ed.), Electroanalytical Chemistry, Vol. 3, Marcel Dekker, New York, 1969, p. 199.
22.Š. Komorsky-Lovrić, M. Lovrić and A.M. Bond, Electroanalysis 5 (1993) 29. 23.Š. Komorsky-Lovrić, D. Jadreško and M. Lovrić, Electrochim. Acta 130 (2014) 286. 24.D. D. DeFord and D. N. Hume, J. Am. Chem. Soc. 73 (1951) 5321.