Int. J. Electrochem. Sci., 11 (2016) 2326 - 2334
International Journal of
ELECTROCHEMICAL
SCIENCE
www.electrochemsci.orgShort Communication
The Electrochemical and Morphological Characteristics of
Single Metastable pit for 304 Stainless Steel under Potentiostatic
Polarization
L. Guan, Y. Zhou, B. Zhang*, J.Q. Wang, E.-H. Han, W. Ke
Key Laboratory of Nuclear Materials and Safety Assessment, Institute of Metal Research, Chinese Academy of Sciences, Shenyang 110016, China
*
E-mail: bxz011@imr.ac.cn
Received: 18 November 2015 / Accepted: 12 December 2015 / Published: 1 February 2016
One to one correspondence of single current transient and its 2D and 3D metastable pit geometry for 304 stainless steel microelectrode (50 μm in diameter) in 6% FeCl3 solution have been investigated under potentiostatic polarization. Atomic Force Microscope (AFM) has been proved useful to measure the irregular-shaped pit volume without inclusions in it. The pit volume measured by AFM is consistent with that calculated from the charge passed from the corresponding current transient during pit growth. This result demonstrates that the effects of H2 evolution inside the pit under relatively high potential can be neglected. The growth kinetics of the detected metastable pit obeys a power law, but the exponent n varies with time during the growth stage, which may be associated with the change of the hole diameter in the cover. This result indicates that the metastable pitting growth process is quite complicated and the assumed constant exponent n is unreasonable.
Keywords: 304 stainless steel; metastable pitting; Current transient; AFM
1. INTRODUCTION
pit. The current density inside a pit during pit growth stage can be calculated as the ratio of current to the equivalent pitting area [7, 8] assuming that the pit shape is hemispherical and the cathodic current inside pit is neglected. However, larger errors can be introduced if the cathodic reaction current inside the pit is significant [15]. In order to examine this issue, one way is to compare the charge passed during pit growth with the actually pit volume. For regular pit, there is no significant errors with an assumption of hemispherical pit [8] and the volume can be obtained by calculation with pit width and depth. It is now recognized that the pit shapes are often irregular [16-20], which depends on many factors, such as applied potential, temperature and microstructures. Thus, it would be expected that much larger error can be introduced if the irregular-shaped pit volume is calculated by pit width and depth only. Recently, it has been demonstrated that atomic force microscopy (AFM) can measure the actual pit volume with high resolution by using a bearing analysis [21] and the height variations of the sample surface less than 100 nm can be measured accurately [22]. However, one to one correspondence between a single current transient and a single metastable pit has not been reported using AFM measurements. Herein, measurements of single metastable pitting current transient and the corresponding pit volume by AFM have been performed for a 304 stainless steel. The quantitative relationship between the calculated equivalent pit volume through the current transient measurement and that measured by AFM has been examined. The growth kinetics of metastable pitting has been evaluated.
2. EXPERIMENTAL
The material is 304 stainless steel wire (50 μm in diameter) with the main chemical composition (in wt.%): Cr 17, Ni 10, Mn 1.2, C 0.08, and Fe balance. The wire surfaces were cleaned with alcohol and deionized water then dried with cold air prior to mounting. The wire was electrically connected to a copper wire with conductive silver adhesive and mounted in Struers epoxy resin (EpoFix Kit). The ends were abraded and finally polished to 1 μm with diamond polishing paste.
The electrochemical experiments were carried out using a standard three-electrode cell in aerated 6% FeCl3 solution and using a PARSTAT 4000 potentiostat equipped with low current option (VersaSTAT LC). Detail setup can be found elsewhere [9]. The current transient measurements were conducted at applied potentials in the passive range. The current was recorded at a frequency of 200 Hz. Potentiostatic polarization tests started immediately after immersion. All experiments were carried out at 25 ± 2 o
C.
3. RESULTS AND DISCUSSION
A typical potentiodynamic polarization curve is shown in Fig. 1. It demonstrates that 304 stainless steel is passive at the OCP (0.26 V (SCE)) and the breakdown potential is approximately 0.85 V (SCE) in the aerated 6% FeCl3 solution. Meanwhile, a typical current fluctuation representing metastable pitting events can also be detected above 0.52 V (SCE) in Fig. 1. A larger number of experiments were carried out below 0.85 V (SCE) to detect the metastable pitting events and it was found that metastable pitting can occur at potentials above 0.40 V (SCE) with incubation time less than 3 min.
10-7 10-6 10-5 10-4
0.2 0.4 0.6 0.8 1.0
Pot
ential
/
V
(S
CE)
[image:3.596.149.452.236.478.2]Current density / A·cm-2
Figure 1. A typical potentiodynamic polarization curve of 304 SS microelectrode in 6% FeCl3 solution at a scan rate of 1 mV/s.
A typical current transient recorded at 0.45 V (SCE) is shown in Fig. 2. After the incubation process, the current increases relatively slowly for about 1.20 s with the peak current of 8.21 μA, and then it declines abruptly to the original passive current (about 5 nA). The equivalent volume of the current transient (V) can be calculated by integrating the anodic current transient using Origin 9.0 as
QM V
z F
, (1)
where Q is the charge, M is the molar mass, z is the number of moles of electrons transferred in the anodic dissolution reaction. For 304 stainless steel, ρ is 7.92 g/cm3
, n is 2.19 and M is about 56.2 [8]. For the single current transient shown in Fig. 1, the calculated charge is 4.8 μC. The calculated volume is 173.5 μm3
.
0 1 2 3 4 5
0 2 4 6 8 10
Curre
nt /
A
[image:4.596.159.448.89.310.2]Time / s
Figure 2. Single current transient recorded during potentiostatic polarization hold at 0.45 V (SCE) on 304 SS microelectrode in 6% FeCl3 solution.
(b)
[image:5.596.113.525.75.305.2]
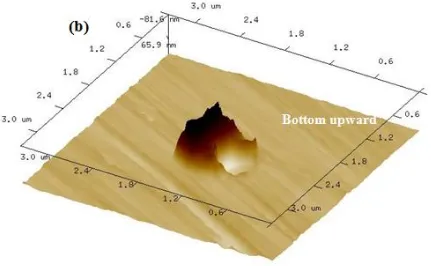
Figure 4. The images of single metastable pit after 0.4 V (SCE) polarization (a) SEM image with EDX analysis on the inclusion and matrix and (b) 3D AFM image.
The pit has irregular shape with small pits in the pit bottom and side wall (marked with arrows). The measured pit volume of the 3D AFM image by bearing analysis [21, 23] is 170 μm3, which is 98% of that determined by current transient calculation.
It should be noted that there would be an underestimate of the true volume for the pit with inclusions in it due to the limited ability of AFM. For example, Fig. 4b presents the 3D morphology of a pit initiated at the calcium and silicon inclusion (Fig. 4a) and the measured pit volume is 0.25 μm3. However, since the AFM probe cannot reach the zone underneath the inclusion, the measured volume is only 78% of the calculated one from the corresponding current transient shown in Fig. 5. The maximum depth of this pit shown in Fig. 4 is 0.19 μm and the width is 0.52 μm. Based on the measured pit width and depth with assuming a dish-shaped pit, the calculated pit volume is 0.08 μm3, which is only 25% of the true one. The error is much larger than that of the AFM measurement.
According to the above results, the growth kinetics of the metastable pit was then studied. According to Zuo et al. [24], the relationship between the current of a metastable pit with time can be described as
0 ( 0)
n
II k tt , (2)
[image:6.596.80.511.81.347.2]
142.4 142.5 142.6 142.7 142.8 142.9 143.0
-20 0 20 40 60 80 100 120 140
Curre
nt / nA
Time / s
Figure 5. Single current transient recorded during potentiostatic polarization hold at 0.4 V (SCE) on 304 SS microelectrode in 6% FeCl3 solution.
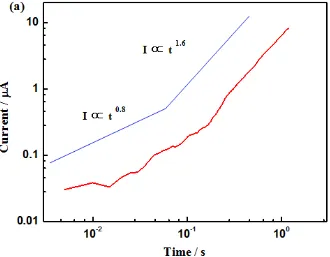
In Fig. 6a, n varies from 0.8 to 1.6, while in Fig. 6b, n varies from 1.3 to 0.35, then changes to 2.6 which is probably due to the fast rupture of the cover above the metastable pit. Similar results have been reported with n changing from 0.5 to 1.5 [9, 25].
[image:7.596.133.463.501.758.2]
Figure 6. The log-log relationship between the dissolution current and time for the single current transient shown in (a) Figure 2 and (b) Figure 5.
The smaller hole diameter in the cap leads to a parabolic (0.5) increase in the pit current, while larger hole lowers the solution resistance significantly, and the current obeys a power law relationship with n greater than 0.5. Therefore, the observed variation of n is associated with the change of hole diameter in the cover. In future work, the combination of the in situ synchrotron radiography [12, 13] and the finite element method [26] would be helpful for a better understanding the metastable pitting growth kinetics.
4. CONCLUSIONS
The current transients of single metastable pits and the corresponding 2D and 3D morphologies for 304 SS were studied by potentiostatic polarization measurements, AFM and SEM observations. The measured pit volume without inclusions in it is consistent with that calculated from the corresponding charge passed during pit growth, so that the effects of H2 evolution inside the pit and the discharging of the oxide film surrounding an active pit on the measured true anodic current can be neglected. The pit growth kinetics exponent n for single current transients was found to vary from the growing time, indicating that metastable pitting growth process is quite complicated. The presence of a small hole in the pit cap and the increase of its size are assumed to be responsible for the change of n during the pit growth.
ACKNOWLEDGEMENTS
[image:8.596.130.464.84.324.2]
References
1. M. Mukherjee and T.K. Pal, J. Appl. Electrochem., 43 (2012) 347. 2. J. Stewart and D.E. Williams, Corros. Sci., 33 (1992) 457.
3. M.A. Baker and J.E. Castle, Corros. Sci., 33 (1992) 1295.
4. R.E. Williford, C.F. Windisch and R.H. Jones, Mater. Sci. Eng. A, A288 (2000) 54.
5. X.Y. Liu, K.A. Xia, J.C. Niu, Z. Xiang, B. Yan and W. Lu, Int. J. Electrochem. Sci., 10 (2015) 9359. 6. G.S. Frankel, J. Electrochem. Soc., 145 (1998) 2186.
7. G.S. Frankel, L. Stochert and F. Hunkeler, Corrosion, 43 (1987) 429.
8. P.C. Pistorius and G.T. Burstein, Phil. Trans. R. Soc. Lond. A, 341 (1992) 531. 9. D.E. Williams, J. Stewart and P.H. Balkwill, Corros. Sci., 36 (1994) 1213.
10.W.M. Tian, N. Du, S.M. Li, S.B. Chen and Q.Y. Wu, Corros. Sci., 85 (2014) 372.
11.L. Guan, Y. Zhou, H.Q. Lin, B. Zhang, J.Q. Wang, E.-H. Han and W. Ke, Corros. Sci., 95 (2015) 6. 12.J. Soltis, Corros. Sci., 90 (2015) 5.
13.M. Drogowska and H. Menard, J. Appl. Electrochem., 27 (1997) 169.
14.R.K. Gupta, N.L. Sukiman, M.K. Cavanaugh, B.R.W. Hinton, C.R. Hutchinson and N. Birbilis, Electrochim. Acta, 66 (2012) 245.
15.H.S. Klapper, J. Goellner and A. Heyn, Corros. Sci., 52 (2010) 1362. 16.R.M. Pidaparti and R.K. Patel, Corros. Sci., 52 (2010) 3150.
17.S.M. Ghahari, A.J. Davenport, T. Rayment, T. Suter, J.P. Tinnes, C. Padovani, J.A. Hammons, M. Stampanoni, F. Marone and R. Mokso, Corros. Sci., 53 (2011) 2684.
18.S.M. Ghahari, D.P. Krouse, N.J. Laycock, T. Rayment, C. Padovani, T. Suter, R. Mokso, F. Marone, M. Stampanoni, M. Monir and A.J. Davenport, Corros. Eng. Sci. Technol., 46 (2011) 205.
19.M. Ghahari, D. Krouse, N. Laycock, T. Rayment, C. Padovani, M. Stampanoni, F. Marone, R. Mokso and A.J. Davenport, Corros. Sci., 100 (2015) 23.
20.B.R. Tzaneva, L.B. Fachikow and R.G. Raicheff, J. Appl. Electrochem., 36 (2006) 347. 21.L. Guan, B. Zhang, J.Q. Wang, E.-H. Han and W. Ke, Corros. Sci., 80 (2014) 1.
22.S. Daviðsdóttir, S. Canulescu, K. Dirscherl, J. Schou and R. Ambat, Surf. Coat. Tech., 216 (2013) 35.
23.L.C. Xu, H.H.P. Fang and K.Y. Chan, J. Electrochem. Soc., 146 (1999) 4455. 24.Y. Zuo and H.T. Wang, Corrosion Science and Protection Technology, 11 (1999) 1. 25.M.H. Moayed and R.C. Newman, Corros. Sci., 48 (2006) 1004.
26.N.J. Laycock and S.P. White, J. Electrochem. Soc., 148 (2001) B264.