COMMISSION OF THE EUROPEAN COMMUNITIES
Brussels, 01.07.2002 COM(2002) 345 final
REPORT FROM THE COMMISSION TO THE EUROPEAN PARLIAMENT AND THE COUNCIL
Growth and Employment Initiative
Measures on financial assistance for innovative and job creating Small and Medium-Sized Enterprises (SMEs)
As at 31 December 2001
2
REPORT FROM THE COMMISSION TO THE EUROPEAN PARLIAMENT AND THE COUNCIL
Growth and Employment Initiative
Measures on financial assistance for innovative and job creating Small and Medium-Sized Enterprises (SMEs)
As at 31 December 2001
1. General introduction... 4
2. ETF Start-up Facility... 6
2.1. Description of the Facility ... 6
2.2. Budgetary situation... 6
2.2.1. Overview... 6
2.2.2. Geographic distribution ... 7
2.2.3. Commitments ... 9
2.2.4. Disbursements ... 11
2.2.5. Repayments by the venture capital funds ... 13
2.2.6. Accounts ... 13
2.3. Financial Intermediaries ... 14
2.4. Beneficiary SMEs... 15
2.5. Employment ... 18
3. Joint European Venture (JEV) ... 19
3.1. Description of the programme ... 19
3.2. Budgetary situation... 19
3.2.1. Overview... 19
3.2.2. Geographic distribution ... 19
3.2.3. Commitments ... 20
3.2.4. Disbursements ... 20
3.2.5. Accounts ... 20
3.3. Financial Intermediaries ... 20
3.4. Review of the projects ... 21
3.6. Take-up of JEV ... 25
4. SME Guarantee Facility... 27
4.1. Description of the Facility ... 27
4.2. Budgetary situation... 27
4.2.1. Overview... 27
4.2.2. Geographic distribution ... 28
4.2.3. Commitments ... 29
4.2.4. Loss payments... 31
4.2.5. Accounts ... 32
4.3. Financial Intermediaries ... 33
4.4. Beneficiary SMEs... 37
4.5. Employment ... 39
5. Conclusions... 40
5.1. Growth and Employment Initiative ... 40
4
Growth and Employment Initiative
1. GENERAL INTRODUCTION
The 2001 annual report on the Growth and Employment Initiative is drawn up in accordance with Article 7(1) of the Council Decision (Decision 98/347/CE) adopted on 19 May 1998. This Decision requires the Commission to submit an annual report to the European Parliament and Council on the progress achieved on the implementation of three financial instruments, ETF Start-up Facility, JEV and SME Guarantee Facility. This third annual report will be followed by the overall evaluation report, to be prepared by the Commission according to Article 7(2) of the Decision. In that article, the Council requests the Commission to provide an evaluation of the programme, notably as regards its overall utilisation and its immediate and long-term employment effects.
The annual report is broken down into three sections, one for each of the financial instruments. It is complemented by annexes, referring particularly to statistics on SMEs that are beneficiaries of either the ETF Start-up Facility or the SME Guarantee Facility. These statistics are based on data concerning the year 2000, submitted to the Commission in the framework of surveys conducted in 2001. Finally, the conclusion describes further developments of the instruments of the Initiative within the context of the multiannual programme for enterprise and entrepreneurship (2001-2005) (MAP) which gave them a new legal basis.
As at 31 December 2001, an amount of EUR 116.58 million out of a total appropriation of EUR 443.71 million1was still available for commitments by the EIF for ETF Start-up Facility (EUR 49.68 million) and SME Guarantee Facility (EUR 20.8 million), and by the Financial Intermediaries for JEV (EUR 46.1 million).
The activity of the EIF related to the ETF Start-up Facility and the SME Guarantee Facility developed according to the plans, although it was affected by the economic development, i.e. the downturn of risk capital in Europe and the increased reluctance of banks in their lending activities towards SMEs. In this respect, the banks also anticipated the foreseeable consequences, in terms of higher risk exposure, of the Basle II capital accord, a preliminary version of which was communicated in March 2001. As regards JEV, the take-up by the market was lower than expected, compared to similar joint-venture instruments managed by the Commission (e.g. JOP). During the course of 2001, the Commission examined in detail the possibility of simplifying JEV, as requested by the MAP Council Decision.
In December 2001, the Parliament adopted the resolution on the Commission’s second annual report on the Growth and Employment Initiative on the basis of the report (A5-0422/2001) submitted in November 2001 by Mr Bushill-Matthews, rapporteur of the European Parliament’s “Committee on Employment and Social Affairs”.
The Court of Auditors carried out audits of the financial instruments operated by the EIF, i.e. the ETF Start-up and SME Guarantee Facilities, in 2001. Sector letters on these audits were sent to Commissioner Solbes respectively on 10 July 2001 and on 25 January 2002. The Commission has already taken some measures to address the Court’s findings in the
1
6 2. ETF START-UPFACILITY
2.1. Description of the Facility
The objective of the ETF Start-up Facility is to increase the availability of risk capital to innovative SMEs during their establishment and their early stage development.
The EIF invests in specialised venture capital funds (hereunder referred to as VC funds) established specifically to provide equity or other forms of risk capital to SMEs. The funds considered under this Facility are smaller or newly established ones, in particular those operating at a regional level, those focusing on specific industries or technologies and those which finance the exploitation of R&D results.
Investments are made on equal terms with other equity investors and must represent between 10% and 25% of the total capital of the VC fund, up to a maximum of EUR 10 million.
In order to offer the EIF some flexibility in its selection of funds and not to exclude otherwise strong candidates, the Investment Policy of the Facility allows VC funds to make available a small percentage of their capital to investments outside the EU. Where the VC fund foresees to invest in such non-eligible areas, the EIF's participation in the venture capital funds is reduced by the corresponding percentage of such foreseen investments.
The EIF examines the fund proposals based on criteria such as size, level of involvement from the private sector, investment strategy, target market, deal flow, proposed terms, expected rate of return, management team working on the project and lastly on the extent to which the EIF investment in the VC fund is expected to have a catalytic effect in raising funds. Attention is also given to ensuring that the programme as a whole maintains a balanced geographical representation across the European Union.
Following eligibility approval of the VC fund proposals by the Commission, the EIF signs contractual agreements with the fund managers and the other equity investors in the fund. Thereafter the EIF progressively disburses the amounts committed to the VC funds for investment in SMEs.
2.2. Budgetary situation
2.2.1. Overview
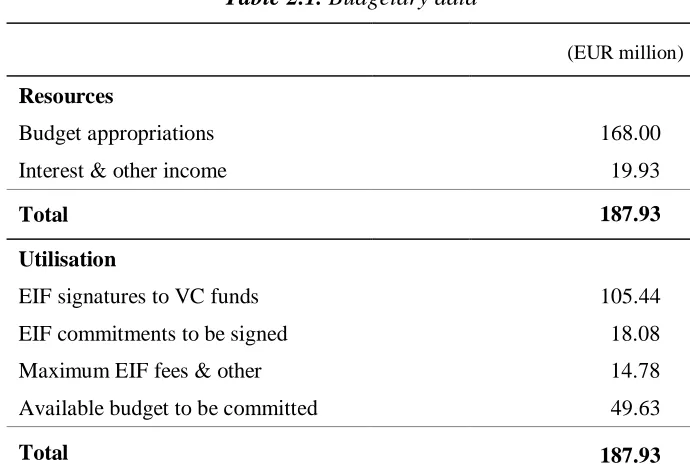
As at 31 December 2001, the budgetary appropriations of the ETF Start-up Facility amounted to EUR 168 million. In addition, according to the Council Decision 98/347/EC, Annex I, point 7, proceeds from realised investments may be reinvested during the reinvestment period2 and the interest earned on the trust account shall be added to the resources of the Facility. Therefore, these two income sources shall be added to the budgetary appropriations. This total budget shall cover the full cost of the Facility, including investments in venture capital funds and any other eligible costs of the Facility. The table below shows the breakdown of the budget appropriations, interest and other income as well as their utilisation:
2
Table 2.1. Budgetary data
(EUR million)
Resources
Budget appropriations 168.00
Interest & other income 19.93
Total 187.93
Utilisation
EIF signatures to VC funds 105.44
EIF commitments to be signed 18.08
Maximum EIF fees & other 14.78
Available budget to be committed 49.63
Total 187.93
2.2.2. Geographic distribution
The EIF continues to receive a steady flow of enquiries from potential fund managers and sponsors throughout the European Union. As at the end of 2001, following due diligence by the EIF, investment proposals into 23 VC funds were approved by the EIF and the Commission services, corresponding to a total amount of EUR 165 million. 16 contracts have been signed with the EIF and one is still being processed. For the remaining 6, final negotiations were unsuccessful. The amount committed to these 17 VC funds was EUR 123.5 million, with a global maximum funding to be raised amounting to EUR 602 million.
The breakdown of the committed amounts corresponding to the 17 VC funds by country is shown below:
F 28%
D 11% DK
8% S
5% FIN
5% UK
7% L
8% B 4%
I 8%
P 8%
A 8%
[image:7.595.72.522.485.733.2]8
The EIF has signed contracts with 16 VC funds for a total of EUR 105.44 million. These 16 VC funds have raised a total amount of EUR 457.5 million. A short description of the VC funds, which have contractual agreements with the EIF, is annexed (annex 1). The difference between the amount committed and the amount signed is explained by one fund approved before 31 December 2001, but not yet signed, and by potential further closings for three other funds. The fund for which the contract has not yet been signed is located in Austria and the EIF expects to conclude within the coming months.
2.2.3. Commitments
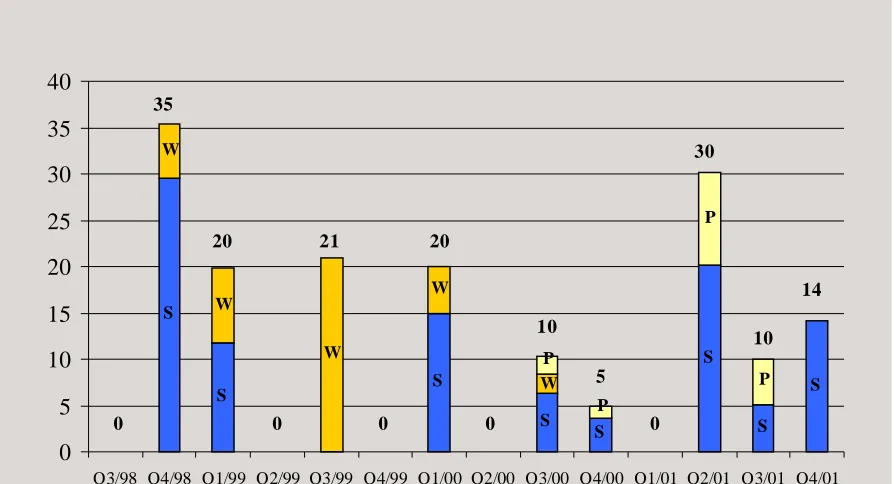
The graph below shows the quarterly approvals of investments in VC funds. Following the restructuring of the EIF implemented in 2000, activity increased substantially in 2001. Although limited in absolute terms, this activity should be seen against the background of a rapidly deteriorating VC market and the lack of new VC funds being created given the reluctance of investors for the VC asset class. This confirms the role of the EIF and of the ETF Start-up Facility in helping to sustain the venture capital market in Europe.
S
S S
S S S
S S
W W
W W
W
P P
P P
0 5 10 15 20 25 30 35 40
Q3/98 Q4/98 Q1/99 Q2/99 Q3/99 Q4/99 Q1/00 Q2/00 Q3/00 Q4/00 Q1/01 Q2/01 Q3/01 Q4/01
Signed Withdrawn Under Process
35
20 21 20
10
5
30
10 14
[image:9.595.75.522.192.434.2]0 0 0 0 0
10
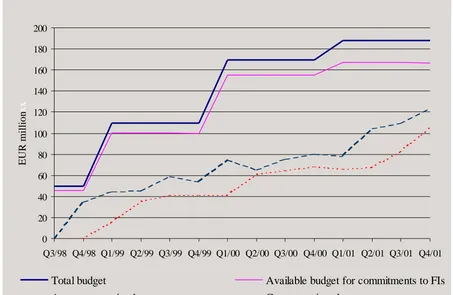
The graph below shows the cumulative evolution of the total amount committed (i.e. contracts signed plus those still being processed, corresponding to EUR 123 million as at the end of 2001) compared to the available resources (EUR 188 million as at the end of 2001).
It also shows the evolution of the amounts signed by the EIF with VC funds (EUR 105 million as at the end of 2001).
0 20 40 60 80 100 120 140 160 180 200
Q3/98 Q4/98 Q1/99 Q2/99 Q3/99 Q4/99 Q1/00 Q2/00 Q3/00 Q4/00 Q1/01 Q2/01 Q3/01 Q4/01
E
U
R
m
illio
n
xx
Total budget Available budget for commitments to FIs
[image:10.595.72.525.165.460.2]Amount committed Contracts signed
2.2.4. Disbursements
As at 31 December 2001, the total disbursements to VC funds amounted to EUR 50 million compared to EUR 32 million at year-end 2000. As a result of the increased commitment pace, the overall disbursement rate is now 48% of the amounts committed.
It is worth noting that the first ETF Start-up VC funds that signed a contract with the EIF in 1999 show an average disbursement rate of 79%. Considering that the average investment period of these VC funds is 4-5 years, the disbursement rate can be considered quite satisfactory.
The following graph shows the progress of the disbursements by the EIF to the VC funds by 31 December 2001 in comparison with the amounts of the contracts signed. The disbursements of the EIF are made in parallel with those of all the other investors in the VC funds, pro rata with their investment commitments. The disbursements are used by the VC funds for their investments in SMEs.
0 20 40 60 80 100 120
Q3/98 Q4/98 Q1/99 Q2/99 Q3/99 Q4/99 Q1/00 Q2/00 Q3/00 Q4/00 Q1/01 Q2/01 Q3/01 Q4/01
[image:11.595.75.523.298.561.2]Contracts signed EIF Disbursements to VC funds
12
[image:12.595.74.484.159.407.2]The graph hereunder shows the investments made by the VC funds in beneficiary SMEs compared to the EIF disbursements to the VC funds. At the end of 2001 the ratio of the Facility contribution to the investment of VC funds was 1:4. Taking into account that VC funds have raised a total amount of EUR 457.5 million, the following graph shows that these VC funds have about half of their capital still to be invested in new SMEs or to be used for follow-on investments in SMEs already in their portfolio.
Figure 2.5. Investments by the VC funds in beneficiary SMEs
0 20 40 60 80 100 120 140 160 180 200
Q4/98 Q1/99 Q2/99 Q3/99 Q4/99 Q1/00 Q2/00 Q3/00 Q4/00 Q1/01 Q2/01 Q3/01 Q4/01
EU
R
m
illio
n
2.2.5. Repayments by the venture capital funds
Some ETF Start-up VC funds have started repaying the EIF, following the sale of their equity participation in some successful SMEs. More information on the companies concerned by these repayments is given in point 2.4 hereunder.
In the year 2001 a total amount of EUR 5.3 million was repaid by the VC funds to the trust account of the Facility, which compares with an amount of EUR 9.6 million in 2000 and EUR 0.7 million in 1999, allowing the EIF to consider new investments as foreseen in the Council Decision (see point 2.2.1). It is interesting to note that the total amount repaid as at 31 December 2001 (EUR 15.6 million) already covers the maximum fees to be paid to the EIF for the management of the Facility.
0 10 20 30 40 50 60
Q4/98 Q1/99 Q2/99 Q3/99 Q4/99 Q1/00 Q2/00 Q3/00 Q4/00 Q1/01 Q2/01 Q3/01 Q4/01
EUR
million
[image:13.595.75.524.244.530.2]EIF Disbursements to VC funds Repayments from VC funds
Figure 2.6. Repayments by the VC funds
The deterioration of market conditions since the end of 2000, aggravated by the events of 11 September 2001, has taken its toll on valuations. Indeed, exits have been delayed due to a shortage of potential purchasers and the poor prospects for IPOs, while a more selective policy for investing in early stage companies has led to financing tensions for some start-ups already in portfolios.
2.2.6. Accounts
14 2.3. Financial Intermediaries
Most of the VC funds that have contractual agreements with the EIF have a national, if not regional, focus, although some of them are allowed to invest on a pan-European basis. They are mainly oriented towards early stage investments in high technology areas, such as information and communication technologies, Internet, healthcare and life sciences. This is in line with the investment policy of ETF Start-up.
A short description of the VC funds that have contractual agreements with the EIF is annexed (annex 1).
It is worth mentioning that there are still four EU countries that have not been covered by ETF Start-up, i.e. Greece, Ireland, Netherlands and Spain. Apart from the Netherlands, these are the countries where the venture capital market, particularly concerning the seed and start-up phases, is the least developed. In the Netherlands there are not a lot of new teams operating in the early stage market and most of the existing VC funds apply a pragmatic policy of diversification of the investment stages in order to dilute the risks. However, in the recent months a growing number of proposals from these countries have been assessed and special operational efforts have been undertaken in respect of the development of transactions in countries where the ETF Start-up Facility so far has not been used3
3
2.4. Beneficiary SMEs
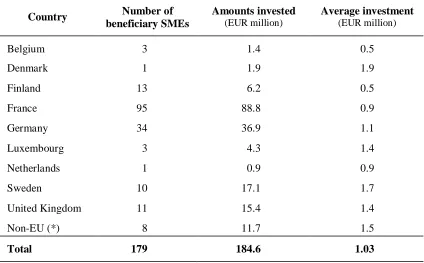
As at 31 December 2001, the VC funds had invested in 179 SMEs. The total amount invested is EUR 184.6 million, which corresponds to an average investment of EUR 1.03 million per company. This is in line with the statistics provided in the EVCA 2001 yearbook, according to which in 2000 the average investment in companies in their seed phase amounts to EUR 0.98 million, while the average investment in companies in their start-up phase amounts to EUR 1.52 million.
[image:15.595.87.511.236.499.2]The breakdown by country is as follows:
Table 2.2. Breakdown by country of beneficiary SMEs
Country Number of beneficiary SMEs
Amounts invested
(EUR million)
Average investment
(EUR million)
Belgium 3 1.4 0.5
Denmark 1 1.9 1.9
Finland 13 6.2 0.5
France 95 88.8 0.9
Germany 34 36.9 1.1
Luxembourg 3 4.3 1.4
Netherlands 1 0.9 0.9
Sweden 10 17.1 1.7
United Kingdom 11 15.4 1.4
Non-EU (*) 8 11.7 1.5
Total 179 184.6 1.03
(*) US, Canada, Israel and Switzerland (see point 2.1)
Out of the 179 companies, 159 are still in the portfolios of the VC funds and 20 investments are realised. Out of these, 15 have been sold and 5 have been written off. The table below gives more details about these 20 investments:
Table 2.3. Realised investments
Investments Cost
(EUR million)
Final value
(EUR million)
Gain/Loss
(EUR million)
Gain/Loss (%)
Written off 5 5.5 0.5 (5.0) -91%
Sold 15 14.6 81.6 67.0 459%
Total 20 20.1 82.1 62.0 308%
ETF Start-up share
[image:15.595.79.514.623.775.2]16
As far as realised investments are concerned, in average the final value of the investments represents four times the initial capital invested. It cannot be expected that these results can be extrapolated in respect of the unrealised investments.
The ETF Start-up share is paid back to the trust account of the Facility after deduction of the management fees due to the VC funds (see point 2.2.5).
[image:16.595.147.448.234.410.2]The breakdown of the 15 companies by number of employees at the time of the investment realisation (exit) is as follows:
Table 2.4. Employment in beneficiary SMEs of realised investments
Beneficiary SMEs Number of
employees
Number %
≤ 5 1 6.7
6-10 1 6.7
11-50 8 53.3
>50 5 33.3
Total 15 100
The classification of the 20 SMEs by sector of activity is as follows:
Table 2.5. Sector of activity of beneficiary SMEs of realised investments
Sector of activity Sold Written off Total
Computer related 9 5 14
Biotechnology 1 - 1
Medical/Health related 3 - 3
Communications 2 - 2
[image:16.595.101.496.498.648.2]The breakdown of the 159 SMEs, which are currently part of the portfolios of the VC funds, by the number of employees at the end of 2001, is as follows:
Table 2.6. Employment in beneficiary SMEs in portfolios
Beneficiary SMEs Number of
employees
Number %
≤ 5 19 11.9
6-10 22 13.8
11-50 93 58.5
>50 25 15.7
Total 159 100
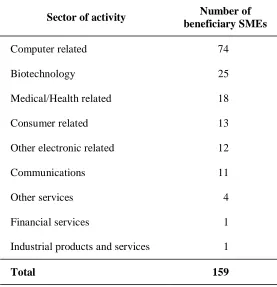
The classification of the 159 SMEs by sector of activity is as follows:
Table 2.7. Sector of activity of beneficiary SMEs in portfolios
Sector of activity Number of beneficiary SMEs
Computer related 74
Biotechnology 25
Medical/Health related 18
Consumer related 13
Other electronic related 12
Communications 11
Other services 4
Financial services 1
Industrial products and services 1
Total 159
[image:17.595.158.435.395.682.2]18
2.5. Employment
[image:18.595.103.494.215.351.2]The VC funds reported a total number of 6,079 employees at year-end 2001 in 159 investee companies for which employment data was available. Out of those, 5,225 were employed in companies that received an investment before the end of 2000; the cumulative headcount of these companies by the end of 2000 was 4,367. This represents an annual increase of 20%. Following the results of the annual survey carried out in mid-2001, the expectations of the 100 concerned SMEs in terms of employment creation can be summarised as follows:
Table 2.8. Impact on employment in beneficiary SMEs
Number of employees
Average per SME
Annual increase in %
Current 3,318 33
-Expected in one year 4,302 43 30
Expected in two years (*) 5,881 59 37
Expected in five years (**) 7,999 80 36
(*) Around 14% of the surveyed companies were unable to provide these data. For these companies an increase of 0% has been assumed.
(**) Around 37% of the surveyed companies were unable to provide these data. For these companies an increase of 0% has been assumed.
3. JOINTEUROPEANVENTURE(JEV)
3.1. Description of the programme
The JEV programme aims to encourage joint ventures between European SMEs in the European Economic Area4, thereby helping them to benefit from the opportunities offered by the single market.
The contribution is intended to cover some of the expenses related to the setting up of a joint venture (Facility for preparatory work and investment). The amount (maximum EUR 100,000 per project) and the terms of this contribution are as follows:
• The first part of the contribution covers up to 50 % of the eligible expenses with a maximum ceiling of EUR 50,000.
Eligible expenses are those related to the conception and setting up of a transnational joint venture created by European SMEs. These include the expenses of the market survey, the preparation of the legal framework and the business plan, the analysis of the environmental impact, and any other expenses that are essential for the setting up of the joint venture.
• The second part of the contribution covers up to 10 % of the total amount of the investment made.
In addition, JEV supports actions promoting the programme (Promotion Facility). The maximum amount of a contribution for the Promotion Facility is EUR 10,000 for promotional action material and EUR 20,000 for events intended to stimulate co-operation. It shall consist of 50% of all eligible expenses and shall be in the form of a grant. Entities which are eligible to apply for a JEV Promotion Facility contribution are financial intermediaries, European, national or regional associations of SMEs, Chambers of Commerce, Euro-Info-Centres, the Business & Innovation Centres, and all other non-profit entities from European Union, such as trade and industry associations, public agencies and other entities, promoting investments eligible for the JEV Programme.
In autumn 2001, the Commission suspended support for the Promotion Facility as the JEV Programme was undergoing a review and internal evaluation.
3.2. Budgetary situation
3.2.1. Overview
The budgetary allocations for the JEV programme totalled EUR 57 million, including EUR 5 million allocated in 1997 for the JEV pilot action.
3.2.2. Geographic distribution
20
3.2.3. Commitments
At the end of 2001, the Commission services had committed EUR 10.9 million of the available budgetary resources to final beneficiary SMEs.
3.2.4. Disbursements
As at 31 December 2001, the total disbursements to beneficiary SMEs amounted to EUR 1.3 million.
3.2.5. Accounts
The financial statements of the programme are enclosed in annex 6. 3.3. Financial Intermediaries
The JEV programme is implemented through a network of financial institutions. This network, constituted following a call for expressions of interest (Official Journal S 42 of 28 February 1998), comprised 71 financial intermediaries at 31 December 2001, compared to 85 the year before. A complete list of these financial intermediaries is attached (annex 3).
[image:20.595.158.436.387.751.2]The table below gives an overview of the financial intermediaries by country:
Table 3.1. Breakdown of financial intermediaries by country
Country Number of financial intermediaries
Austria 7
Belgium 6
Denmark 2
Finland 1
France 7
Germany 10
Greece 2
Ireland 1
Italy 19
Luxembourg 3
Norway 1
Portugal 2
Spain 8
Sweden 1
UK 1
An SME that wishes to submit an application under this scheme must contact one of the financial intermediaries in the network. This intermediary is entrusted with evaluating the application and passing it on to the Commission services. The latter will then verify the eligibility of the application and the possible impact on employment.
Out of the 71 financial intermediaries still in the network, about one third never submitted an application for a joint venture project. Of the active financial intermediaries, one quarter accounted for more than three-quarters of the joint venture projects.
3.4. Review of the projects
[image:21.595.64.532.312.645.2]From the start in 1998 until 31 December 2001, after an in-depth assessment of potential projects by the financial intermediaries, 243 projects had been received by the Commission services, of which 175 had been approved. Of these, 54 were promotion projects and 121 were preparatory work and investment projects. The table below summarises the evolution of projects:
Table 3.2. Projects status
(Cumulative figures) Projects
31.12.1998 31.12.1999 31.12.2000 31.12.2001
Projects received
Joint Venture Projects 23 79 127 173
Promotion Facility - 25 59 70
Total 23 104 186 243
Projects approved
Joint Venture Projects 11 53 83 121
Promotion Facility - 12 46 54
Total 11 65 129 175
Projects rejected 2 5 17 21
Projects withdrawn 2 9 25 26
Projects under review at year-end
8 25 15 21
22
To date, almost one in five projects was refused by the Commission or withdrawn by the financial intermediary. Most refusals were due to non-compliance with the eligibility criteria or to insufficient impact as regards the setting-up of new economic activities involving investment and job creation. Most of the withdrawals were due to the level of administrative requirements related to the processing of the files and the resulting delays.
[image:22.595.109.525.185.586.2]The table below shows the location of the planned joint ventures:
Table 3.3. Breakdown by country of the planned joint ventures
Planned joint ventures
1998-1999 2000 2001 Total
Austria 0 1 1 2
Belgium 7 1 2 10
Denmark 3 3 2 8
Finland 1 0 0 1
France 10 1 2 13
Germany 3 4 6 13
Greece 0 1 2 3
Ireland 1 0 2 3
Italy 7 3 2 12
Luxembourg 1 0 1 2
Netherlands 3 1 4 8
Norway 0 0 1 1
Portugal 5 3 4 12
Spain 9 7 4 20
Sweden 1 2 2 5
United Kingdom 2 2 3 7
Undecided 0 1 0 1
Nationalities of partners (lead and other) involved in projects are as follows:
Table 3.4. Breakdown by country of joint ventures’ partners
Partners
1998-1999 2000 2001 Total
Austria 1 3 2 6
Belgium 14 5 4 23
Denmark 7 5 11 23
Finland 1 2 2 1
France 22 5 3 30
Germany 11 6 12 29
Greece 0 1 2 3
Ireland 1 2 2 5
Italy 11 7 8 26
Luxembourg 1 0 1 2
Netherlands 6 7 7 20
Norway 0 0 3 3
Portugal 8 3 5 16
Spain 13 11 4 28
Sweden 3 3 4 10
United Kingdom 16 5 9 30
Other 0 3 0 3
24
[image:24.595.76.525.116.456.2]The number of planned joint ventures by sector of activity is as follows:
Table 3.5. Sector of activity of planned joint ventures
Planned joint ventures
1998-1999 2000 2001 Total
Multimedia, software, audio-visual
2 0 5 7
Marketing and commercialisation
7 6 4 17
Manufacturing 3 11 9 23
Waste management 2 0 0 2
Biotechnology 1 1 1 3
Transports, logistics 7 1 1 9
Information technology 15 5 3 23
Energy 2 2 4 8
Construction 4 0 1 5
Industry 5 0 2 7
Telecommunications and data-processing
2 0 0 2
Other services 3 4 8 15
Total 53 30 38 121
Out of the 258 partner SMEs, 53 % had fewer than 10 employees, while 33 % had between 10 and 49 employees.
The size of the SMEs involved in the approved joint venture projects (until 31 December 2001) is as follows:
Table 3.6. Employment in partner SMEs
Number of SMEs (cumulative figures) Number of employees
31.12.1999 31.12.2000 31.12.2001
< 10 48 97 137
10-49 46 56 85
50-249 21 28 36
[image:24.595.99.500.588.722.2]3.5. Employment
With only 28 joint ventures created and reported so far (according to the 79 questionnaires returned by SMEs), the effect on employment has been limited.
Although first indications seemed positive, at the end of 2001 only four applications for investment grants had actually been received. In each of the cases, only 20% of the job creation foreseen in the initial applications forms had been realised. However, it should be taken into account that the job creation figures given in the grant application only reflect the current situation - creation of, and investment in a joint venture is often a long process and it may be that further jobs will be created as the business progresses. There is also no information available on any jobs that may have been created within the partners’ enterprises as a result of the joint venture.
The great majority of the joint ventures created and reported so far have opted not to apply for the investment grant. General opinion is that the procedures are too lengthy and complicated. Another reason for not applying for the investment grant is that the joint ventures have invested only limited amounts in fixed assets and therefore, the 10% support has not been considered as incentive enough to justify the administrative effort. It can reasonably be assumed that jobs have been created also in the joint ventures that have decided not to apply for an investment grant, but in view of the actual job creation figures available for the four grants submitted, the numbers are probably rather limited. The actual number of jobs created will only be confirmed when the first reports are received from the joint ventures under their 5-year reporting obligation.
3.6. Take-up of JEV
Demand for JEV from the market has been much lower than originally expected. The programme was originally conceived, partly in response to requests from SME representative organisations, to complement the (then) existing ECIP (European Community Investment Partners) and JOP (Joint Venture Programme – Phare/Tacis) joint venture programmes, which covered the ALAMEDSA and CEEC/NIS countries respectively. ECIP was closed at the end of 1999 and JOP during 2000. One effect of this was that some financial intermediaries who had offered ECIP, JOP and JEV to their SME clients scaled down or ceased their activities, since JEV alone did not provide them with a sufficient volume of projects to justify dedicated staff. The remuneration paid to financial intermediaries for submitting files was regarded by many as insufficient in view of the administrative obligations that the financial intermediaries have assumed when concluding the Framework Agreement with the Commission.
Although the logic behind the JEV programme was considered sound, time has shown that there was in fact relatively little demand from SMEs for support for the creation of transnational joint ventures in the EU. In reality, SMEs investing in other Member States often preferred to create subsidiaries rather than joint ventures, or to enter into looser cooperation agreements without the obligation to create a new legal entity.
26
4. SME GUARANTEEFACILITY
4.1. Description of the Facility
The objective of the SME Guarantee Facility is to stimulate job-creation by supporting the investment activities of SMEs within the European Union, through increased availability of loan finance. This is achieved by increasing the capacity of guarantee schemes operating in the Member States and relates to both new and existing portfolios. This Facility provides higher volumes of guarantees for the existing guarantee products of the financial intermediaries (FIs), access to financing for a larger number of small companies for a wider variety of investments and guarantees for riskier loans. The Facility covers part of the losses incurred under the guarantees up to a pre-determined amount. The Facility is operated by the European Investment Fund (EIF) on a trust basis. The EIF manages the contacts with financial institutions interested in joining the Facility, evaluates and submits the selected proposals to the Commission services for eligibility approval. Appropriate co-operation with Member States is ensured by contacts between the EIF and the relevant national authorities. The SME Guarantee Facility gives priority to companies with up to 100 employees. Particular attention is given to financing of the intangible assets of SMEs. The financial intermediaries may have stricter SME eligibility criteria depending on their specific guarantee or loan products. In any case, the approval process, with regard to the final SME beneficiaries, is the full responsibility of the selected financial intermediaries.
4.2. Budgetary situation
4.2.1. Overview
28
Table 4.1. Budgetary data
(EUR million)
Resources
Budget appropriations 198.56
Interest & other income 5.22
Total 203.78
Utilisation
EIF commitments to FIs 165.35
Maximum EIF fees & other 17.63
Available budget to be committed 20.8
Total 203.78
4.2.2. Geographic distribution
At the end of 2001, the EIF had committed EUR 165.4 million of the available budgetary resources. The geographic distribution of these commitments is shown below:
A 3%
B 2%
DK 4%
FIN 3%
F 22%
I 15%
E 10%
S 3%
UK 4%
NL 5% P 1%
D 28%
[image:28.595.74.487.376.648.2]4.2.3. Commitments
Quarterly EIF commitments to financial intermediaries are shown in the graph below:
[image:29.595.73.508.121.354.2]0 1 25 8 28 27 1 7 11 22 0 7 22 7 0 5 10 15 20 25 30 Q3/9 8 Q4/9 8 Q1/ 99 Q2/9 9 Q3/9 9 Q4/9 9 Q1/0 0 Q2/0 0 Q3/0 0 Q4/0 0 Q1/0 1 Q2/0 1 Q3/0 1 Q4/0 1 E U R m illion
30
The graph below shows the evolution of the EIF commitments (EUR 165.4 million at 31 December 2001) compared to the total available budget (EUR 203.78 million at 31 December 2001). It should be noted that interest earned has been added to the budgetary appropriations in 2001. The graph also indicates the actual utilisation of the budgetary resources by the financial intermediaries. 0 50 100 150 200 250 Q3/9 8 Q4/9 8 Q1/9 9 Q2/9 9 Q3/9 9 Q4/9 9 Q1/0 0 Q2/0 0 Q3/0 0 Q4/0 0 Q1/0 1 Q2/0 1 Q3/0 1 Q4/0 1
Total budgetary resources EIF commitment
Actual utilisation by the financial intermediaries
E
U
R
m
[image:30.595.75.504.152.501.2]illion
Guarantee schemes in general have a high leverage effect. As at 31 December 2001, the aggregate amount of SME loans guaranteed under the Facility totalled EUR 6.8 billion. At the same time, the utilisation of the budgetary resources by the financial intermediaries amounted to EUR 117 million, achieving a leverage effect of 58. According to the forecasts by the financial intermediaries, it is estimated that more than EUR 7.9 billion of loans will be granted on the basis of the commitments of EUR 165.4 million.
The following graph shows the development of the loans to SMEs and the corresponding amounts that the beneficiary SMEs have declared to have invested so far:
0 2000 4000 6000 8000 10000 12000 Q3/9 8 Q4/9 8 Q1/9 9 Q2/9 9 Q3/9 9 Q4/9 9 Q1/0 0 Q2/0 0 Q3/0 0 Q4/0 0 Q1/0 1 Q2/0 1 Q3/0 1 Q4/0 1
Aggregate SME loan volume
Aggregate SME investment amounts
E
U
R
m
[image:31.595.76.522.203.535.2]illion
Figure 4.4. Loans granted to SMEs and corresponding investments
It is worth mentioning that the first financial intermediaries that have signed a contract with the EIF (either in the last quarter of 1998 or in the first quarter of 1999) have already fully used their total guarantee portfolios. Due to the rapid implementation of the Facility, the EIF signed further commitments with 12 intermediaries in 2001.
4.2.4. Loss payments
32
Table 4.2. Guarantee calls in 2001 as a % of EIF’s commitment
Intermediary Guarantee calls (%)
Deutsche Ausgleichsbank (D) 12.2
Bürges (A) 1.7
Almi (S) 17.6
Cersa (E) 0.1
BBMKB (NL) 8.9
Artigiancredit Lombardia (I) 0.6
Eurofidi (I) 0.6
Artigiancredit Emilia Romagna (I) 2.0
Federfidi Lombarda (I) 1.4
Total 4.4
It should be noted that the guarantee calls follow the specific risk characteristics of the portfolio covered, i.e. start-ups have a higher default rate than 'normal' SMEs and the default usually occurs at an earlier stage. In addition, EIF’s guarantee mirrors the nature of the guarantee given by the intermediary (e.g. first loss, residual loss). The time lag between the granting of the loan and the guarantee call reflects the structure of the transaction and the number of institutions involved.
4.2.5. Accounts
4.3. Financial Intermediaries
The EIF has signed contracts with 23 financial intermediaries in 12 countries. In 2001, contracts were signed with 2 new intermediaries and 12 existing contracts were amended. There are some countries where guarantee schemes do not exist and/or where the public interest in the Facility was low. In these countries, the EIF has tried to find private organisations in order to offer guarantee support to SMEs in all Member States.
It is worth mentioning that three EU countries have not been covered by SME Guarantee Facility, i.e. Greece, Ireland and Luxembourg6.
Towards the end of 2001 the majority of intermediaries scaled back their lending activities due to the high risk exposure of loans to SMEs and the slowing down of the economic activity. Therefore, the number of additional guarantees that were included in the SME Guarantee Facility portfolios decreased during the last quarter of 2001.
Under the Management Agreement, EIF may charge commitment fees to financial intermediaries if they do not reach the annual target volumes. This system was established in order to enhance the implementation phase of the Facility. In 2001, no commitment fees were charged as regards Confidi Sardegna in Italy.
Taking into account the current economic situation and the fact that the implementation phase of the Facility under the Growth and Employment Initiative is coming to an end, the EIF proposed a general waiver of the commitment fees as regards 2001. The Commission services are currently examining this.
The following graph shows the utilisation of the EIF commitments by country as on 31 December 2001. The utilisation is calculated as the ratio between aggregate amount of the guarantees included in the relevant SME Guarantee Facility portfolio of each intermediary divided by the maximum guarantee portfolio volume contractually agreed for the intermediary.
6
In Greece, the EIF launched a call for expressions of interest in co-ordination with the National Authority in January 2002, with a view to selecting banks as potential intermediaries during the first quarter 2002. However, the banks have expressed low interest so far.
In Ireland, after having contacted local authorities and representatives of Mutual Guarantee Societies, the EIF has explored with local commercial banks their willingness to co-operate under the SME Guarantee Facility. However, the banks expressed no interest.
In Luxembourg, first discussions took place with the national authorities and potential intermediaries: due to the low overall guarantee activity in the country it is difficult to select sizeable eligible portfolios with a minimum diversification.
34
0% 20% 40% 60% 80% 100%
[image:34.595.77.438.61.430.2]United Kingdom Sweden Spain Portugal Netherlands Luxembourg Italy Ireland Greece Germany France Finland Denmark Belgium Austria
Figure 4.5. Utilisation by financial intermediaries
Note that this graph takes also into account the subsequent amendments of the contracts (increases of commitments and guarantee volumes) due to the rapid take-up by the market of the SME Guarantee Facility in 2000 and 2001. Some intermediaries might ask further increase of the relevant volumes in 2002. The country descriptions hereafter give a more detailed picture of the situation. A detailed list of the financial intermediaries and a short description of the financing products guaranteed under the SME Guarantee Facility is annexed (annex 5).
Austria
The Facility supports two Bürges programmes:
1. the 'Jungunternehmerförderungsaktion' supporting start-ups and ownership transfers;
2. the 'Unternehmensdynamik' supporting innovative SMEs, i.e. development of new
products, services or significant improvement of existing products or services.
Belgium
The “Fonds de Participation” has used the Facility to implement two programmes: one providing guarantees for loans to unemployed persons who want to start their own business; the second providing guarantees for loans to newly created SMEs.
Denmark
The demand for two loan guarantee programmes of Growth Fund (Vækstfonden) has been very high. The first Growth Fund programme supports innovative SMEs with growth and therefore job creation potential. The second supports recruitment of staff with potentially reduced productivity (people with some kind of social or physical handicap). Due to the rapid take-up, the amounts of the relevant portfolio volumes were increased in October 2001.
Finland
Despite strong marketing efforts carried out by Finnvera, the demand for its guarantee products remained below expectations. Access to finance from commercial banks has improved significantly during the last few years, thus limiting the role of Finnvera as a public institution complementing the banking sector.
Therefore, the relevant portfolio volumes were revised at the end of 2001 taking into account the volumes achieved since the inception of the Facility in Finland.
France
The EIF signed a contract with a new intermediary, Siagi, in April 2001. It issues loan guarantees to micro-enterprises, typically craft SMEs and retailers. Concerning Sofaris, more than 29,000 loans have been granted to SMEs so far.
Germany
Due to high demand for the "Startgeld" loan product of Deutsche Ausgleichsbank (DtA), the amounts of the relevant portfolio volumes were further increased in July 2001. More than 17,000 loans have been granted to start-up SMEs so far.
The EIF signed a contract with Kreditanstalt für Wiederaufbau (KfW) in December 2000. With the support of the Facility, KfW implemented in the old federal 'Länder' of Germany the Employment and Qualification programme, which was already operational in the new 'Länder'. However, the demand for this programme is below expectations, principally due to a slower implementation across the on-lending banks. The utilisation of the Facility by KfW at a rate of 28% is slightly below the forecasts.
Italy
36 The Netherlands
Even though the relevant portfolio volumes of BBMKB (Besluit Borgstelling MKB kredieten) were already increased in July 2001, it had again reached an utilisation rate of 91% as at 31 December 2001.
Portugal
Under the Facility, SPGM (Sociedade Portuguesa de Garantia Mútua) was supposed to set up a national guarantee fund. The originally envisaged structure foresaw 5 regional guarantee funds. Due to major legal constraints, these have not yet been established. In January 2001 the Central Bank decided that the law decree issued in 1998 concerning mutual guarantee societies had to be amended in order to classify the foreseen regional funds as credit institutions under the European Banking Act. This amendment has not yet taken place and therefore the creation of the mutual guarantee system is delayed by more than one year. 27 loans have been granted to SMEs under the existing guarantee program.
Spain
The scheme operated by CERSA (Compañía Española de Reafianzamiento) provides coverage to national mutual guarantee schemes and to loans granted by the Ministry of Science and Technology. The utilisation rate of 77% by CERSA has exceeded expectations.
Sweden
Almi Företagspartner is a development agency, which complements commercial bank financing as it provides financing to SMEs that find it difficult to borrow from commercial banks due to the higher risk involved.
The Swedish authorities welcomed the EIF intervention in 1999, as a direct guarantee from the EIF would enhance Almi's lending activities for financing 1) growth and working capital or investments in machinery, market or product development, etc 2) start-up loans and 3) loans for female entrepreneurs, i.e. areas with unsatisfied demand. However, the expected increase of lending activity, especially in the e-commerce sector, has not taken place as foreseen. As at 31 December 2001, due to the low market demand the utilisation rate is 66%, i.e. below expectations.
The United Kingdom
4.4. Beneficiary SMEs
[image:37.595.130.465.167.512.2]As at 31 December 2001, the total number of SMEs benefiting from the SME Guarantee Facility was 92,408 compared with 50,956 as at 31 December 2000. The following table shows the breakdown by country and the corresponding aggregate loan amounts:
Table 4.3. Breakdown by country of beneficiary SMEs
Country Number of beneficiary SMEs
Average loan amount (EUR 000)
Austria 3,461 111
Belgium 797 41
Denmark 575 186
Finland 1,314 258
France 24,902 79
Germany 16,577 35
Italy 28,744 65
Netherlands 3,034 164
Portugal *) 26 756
Spain 6,026 136
Sweden 3,461 43
UK 3,491 4
Total 92,408 73
*) SPGM is in the process of establishing a mutual guarantee system in Portugal. As the mutual guarantee funds are not yet operational, SPGM has issued guarantees under its normal activities to SMEs.
38
[image:38.595.130.432.125.331.2]The classification in terms of the number of employees is as follows:
Table 4.4. Employment in beneficiary SMEs
Beneficiary SMEs Number of
employees
Number %
0-5 77,588 84
6-10 8,273 9
11-20 3,615 4
21-50 2,204 2
51-100 642 1
Not available 86 0
Total 92,408 100
The classification of the SMEs, in terms of their year of establishment, is as follows:
Table 4.5. Breakdown of beneficiary SMEs by year of establishment
Year of establishment Number of beneficiary SMEs
<1998 31,966
1998 3,838
1999 10,707
2000 16,621
2001 14,395
2002*) 178
Not available**) 14,703
Total 92,408
*) The loans were granted as pre-start-up financing before the companies were established.
**) This data mainly concerns Sofaris. It is estimated that approximately 52% of Sofaris’ guarantee portfolio relates to its start-up programme. Therefore, out of the 14,703 SMEs for which data on the year of establishment is not available, some 7,600 are start-ups.
[image:38.595.133.433.443.637.2]4.5. Employment
The 92,408 SMEs benefiting from the SME Guarantee Facility have so far declared that they have 384,178 employees. They have also indicated that they expect an increase of 54,512 employees within one year and a further increase of 56,866 within a second year. Hence it is estimated that the SMEs that have benefited from the Facility will create a total of around 111,378 new jobs within two years or an average of 1.2 new jobs per SME. This is substantial, if one remembers that more than 80% of the beneficiary SMEs are very small companies with up to 5 employees.
40 5. CONCLUSIONS
5.1. Growth and Employment Initiative
As far as the ETF Start-up and SME Guarantee Facilities are concerned, the overall utilisation appears to be quite satisfactory, even considering the current economic downturn that led to a serious decline in the investment activities by venture capitalists and increasing reluctance of banks to lend to SMEs at the end of 2001. The worsening economic climate may also have a significant impact on the expected returns of venture capital funds and potential losses for guarantee schemes.
As far as JEV is concerned, the take-up by the market was far below expectations, the employment creation impact was minimum and the cost effectiveness was very low. The slowdown of the economic activity within the European Union and the reluctance of banks to finance SMEs may also be having an impact on the finance of transnational joint ventures by SMEs within the European Union.
An evaluation which is currently being carried out will provide more detailed data on the impact of the Growth and Employment Initiative as regards its overall utilisation and its immediate and forecasted effects on employment. When presenting the evaluation, the Commission will, if necessary, make recommendations on the future of those three schemes and in particular of JEV.
5.2. Multi Annual Programme
On 20 December 2000, by decision 2000/819/EC, the Council decided to extend the financial instruments of the Growth and Employment Initiative under a new legal basis, the multiannual programme for enterprise and entrepreneurship, and in particular for small and medium-sized enterprises 2001-2005 (MAP). The new MAP proposes modifications and extensions of the ETF Start-up Facility and the SME Guarantee Facility and introduces a new action, the Seed Capital Action. All three actions are to be managed by the EIF and aim to address recognised market failures in order to improve SMEs’ access to finance.
The Commission proposal on the implementation of these measures received a positive opinion on 4 October 2001 from the Enterprise Programme Management Committee, as required under Article 3 of the above-mentioned Council decision.
On 10 December 2001, the Commission adopted its Decision C(2001) 3973 on the implementation of the financial instruments of MAP. Following this, on 18 December 2001 the EC signed with the EIF the fiduciary and management agreements for ETF Start-up Facility, SME Guarantee Facility and Seed Capital Action.
Within the new MAP, the ETF Start-up Facility has been adapted to support the establishment and financing of SMEs in their start-up phase, by investing in specialised VC funds and incubators.
– micro-credits;
– equity investments;
– loans to cover IT equipment, software and training in the area of internet and e-commerce.