Int. J. Electrochem. Sci., 7 (2012) 2009 - 2018
International Journal of
ELECTROCHEMICAL
SCIENCE
www.electrochemsci.org
Influence of pH Solution on Electroless Copper Plating Using
Sodium Hypophosphite as Reducing Agent
T. Anik, M. Ebn Touhami*, K. Himm, S. Schireen, R. A. Belkhmima, M. Abouchane, M. Cissé,
Laboratory of Electrochemistry, Corrosion and Environment, University Ibn Tofail, Faculty of Science, B. P. 133 Kenitra, MOROCCO
*
E-mail: [email protected]
Received: 5 November 2011 / Accepted: 3 February 2012 / Published: 1 March 2012
The effect of pH solution on the electroless deposition of copper-rich Cu–Ni–P alloys, using hypophosphite as reducing agent, has been carried out. The deposition rate increased obviously with the increase of pH. The surfaces morphology, the roughness and the cristallinity depend many of pH. The kinetics of copper electroless was investigated by means of cyclic voltammetry and electrochemical impedance spectroscopy. The shape of voltammogramms and impedance diagram depend also of the pH solution.
Keywords: Electroless, Copper, pH, Surfaces morphology, Cristallinity
1. INTRODUCTION
The copper plating has been widely used as interconnect materials for ultra large scale integration (ULSI) technology due to its low resistivity and high electromigration resistance [1,2]. The electroless deposition of copper is one of major process steps involved in electronic packages for the computer industry. It is also used for various metallization processes such as carbon nanotubes or hollow metal spheres [3,4].
and the sodium thiosulfate pentahydrate (Na2S2O3,5H2O) [17], Co(II) [18], Fe(II)[19],
borane-dimethylamine complex [20,21], etc, have been developed as substitutes for formaldehyde. Among these, the plating process using hypophosphite as the reductant has attracted considerable attention due to its low price, good bath stability, and relatively easy to control plating conditions. It may replace the formaldehyde electroless copper plating and may be applied in industries. However, the main difficulty results from the fact that the oxidation of hypophosphite is not catalyzed by copper [16, 22-24]. In alkaline solutions, this drawback is overcome by using additional catalysts, such as organic compounds or small amounts of mediators such as Ni2+ or Pd2+ ions [16, 23-24]. In acid solutions, several difficulties still remain, especially a low deposition rate due to slow oxidation of hypophosphite at these pH and the corrosion of the deposited copper layer [24]. So far, mainly Ni–Cu–P alloys have been obtained; however, high nickel contents reduce the conductivity of the layers [25, 26]. In the present work, the influence of pH on electroless copper plating using sodium hypophosphite as reducing agent is developed. The effect of solution pH on the plating rate, composition, morphology and structure of coatings are investigated. The voltammetric investigation and electrochemical impedance spectroscopy of the effect of pH are also realised.
2. EXPERIMENTAL WORK
A 200 ml cell thermostated was used. The substrates were iron plates (S=3cm2), mechanically polished down to 1200 SiC paper, degreased in acetone, etched in 10% dilute sulfuric acid and rinsed with water, prior to the experiment. The deposition rate was estimated from the weight gain after a given immersion time (1–2h). The electrochemical measurements were carried out with a potentiostat (VoltaLab model PGZ100). The reference electrode was a saturated calomel electrode with all potentials referred. The morphology of the deposits was examined by scanning electron microscopy (SEM), the composition was estimated by EDX analysis, whereas the crystalline structure was determined by X-ray diffraction using a cobalt anticathode.
The electrolytes were made up of analytical grade chemicals. The solutions contained sodium hypophosphite as reducing agent, nickel sulfate and copper sulfate. Sodium citrate and ammonium acetate (or ammonium chloride) were added as complexing agents (Table 1). After the addition of all constituents, the solution pH is in the order of 6,8. It is adjusted by acetic acid or by ammonia in the range 5-9. The electrolytes were held at 78+2 °C.
Table 1. Composition of the solutions, which contain in addition 0.081M NiSO4,6H2O, 0.28M
NaH2PO2, H2O and 0,3M C6H5Na3O7, 2H2O.
Electrolyte CuSO4, 5H2O M CH3CO2NH4 M NH4Cl M pH
1 0.0016 1 0 5
2 0.002 1 0 5
3. RESULTS AND DISCUSSION
3.1. Effect of solution pH on the rate deposition and the plating composition
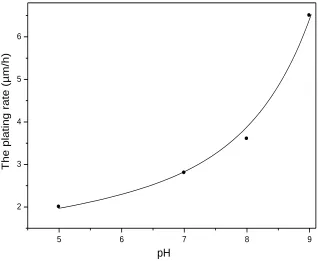
The solution pH is a very important factor in the electroless deposition, indeed, it affects both anodic and cathodic reactions and various phenomena associated with the structure and composition of the metal-solution interphase. The major phenomena include; adsorption, potential zero charge, structure of the double layer, structure of ions species in the solution and the ionic strength of the solution. All these phenomena affect the rate of electroless copper deposition [27]. The influence of the solution pH, using bath 3, on the plating rate and the plating composition is shown in fig 1 and fig 2. The plating rate increases remarkably from 2 to 6.5µm/h when the solution pH increases from 5 to 9, this behavior can be justified by the effect of pH on the anodic reaction [22]. In our studies on the deposit of alloy Ni–P alloy in ammoniacal medium [28], we showed that in anodic range, a chemical reaction precedes charge transfer. This is a deprotonation reaction which can be written as:
H2PO2− → HPO2− + Hads (1)
(HPO2)−Surf + OH− → (HPO2OH)−solution + 1e− (2)
The increase of pH solution enhances reaction (1) which supports the anodic process. In addition to that, the anodic oxidation of hypophosphite is the dominant factor in electroless deposition [22,29].
[image:3.596.127.445.456.717.2]
Figure 1. The effect of pH on the plating rate (Bath 3: 0.0032M Cu2+, 0.081M Ni2+, 0.3 M cit, 1 M NH4 Cl, 0.28M NaH2PO2 and T = 78°C).
5 6 7 8 9
2 3 4 5 6
T
he
plat
ing
r
at
e
(µm
/h)
4 5 6 7 8 9 10
0 20 40 60 80 100
Ni % P % Cu
% Cu % Ni % P
Solution pH
%
C
u
,N
i
0 2 4 6 8 10 12
%
P
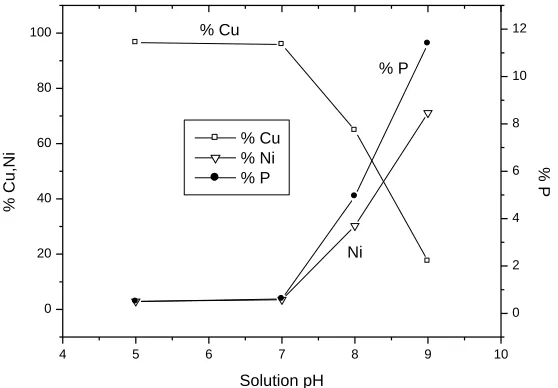
Figure 2. The effect of pH on the plating composition (Bath 3: 0.0032M Cu2+, 0.081M Ni2+, 0.3 M cit, 1 M NH4 Cl, 0.28M NaH2PO2 and T = 78°C).
The content of both nickel and phosphorus increases and the content of copper decreases with the increasing of solution pH [15,30]. We note that in the pH range 7-9, the Cu content decreases significantly. This behavior can be justified by the change of the nature of the complex formed by Cu2+ with pH. In the pH range 4-10, the complex formed between citrate and CuII is the dimer [Cu2cit2]
4-[31]. CuII forms also heteronuclear citrate complexes with NiII. The most important among the formed compounds is the complex of the type [CuNicit2]4- equivalent to the dimeric complex [Cu2cit2]4- in
which one of the CuII ions has been replaced by NiII[32,33]. Ewa Beltowska-Lehman have also shown that in the pH range 6-8, the inert heteronuclear complex [CuNi(cit)2]4- is formed [34]. In our case, the
decrease of the copper content may be due to rising solution pH, needs excess of ammonia solution addition, which is a kind of ligand that is able to form a good complex with Cu2+, which decreases the free Cu2+ in the deposition boundary layer.
3.2. Effect of solution pH on the surface morphology and structure
[image:4.596.160.439.84.278.2]
Figure 3. The effect of pH on the surface morphology (Bath 3: 0.0032M Cu2+, 0.081M Ni2+, 0.3 M cit, 1 M NH4 Cl, 0.28M NaH2PO2 and T = 78°C).
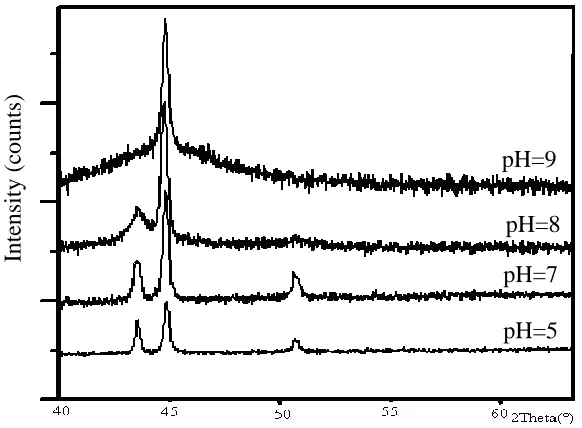
The XRD patterns of the films deposits obtained at different pH solution are shown in fig 4. At pH 5, nearly pure copper (Ni-97Cu-0.5P) is deposited and also as shown in fig 4, it has a crystalline structure. When the pH solution increases from 5 to 9, we note that the peak broadness increases successively compared with the peak obtained at pH 5 and the Ni-17.5Cu-11.4P deposit is thought to be amorphous. This can be due to the increase of the phosphorus content from 0.5 to 11.4 wt% in the matrix. Indeed, it has been previously shown that the phosphorus content controls the structure of the Ni-Cu-P deposits, and the lower P deposits are crystalline, however they become amorphous once the phosphorus content is higher than 7 wt% [35, 36].
Figure 4. The XRD analysis of the Ni–Cu–P deposit obtained with various pH solution. (Bath 3: 0.0032M Cu2+, 0.081M Ni2+, 0.3 M cit, 1 M NH4 Cl, 0.28M NaH2PO2 and T = 78°C).
pH=5
a
pH=9
a
10µm 10µm
Inte
nsit
y (c
ounts
)
[image:5.596.80.514.70.271.2] [image:5.596.152.443.497.711.2]
3.3. Polarization behaviour
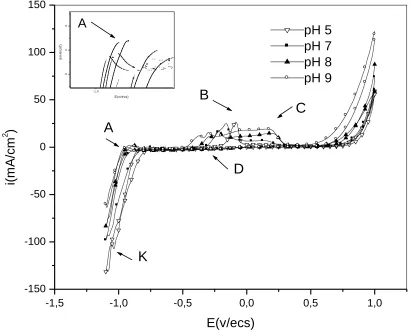
It is well known that the autocatalytic deposition of metals or alloys usually result from two half reactions: anodic oxidation of the reducing agent, here sodium hypophosphite, and the cathodic discharge of the metals. However, interactions often occur between these reactions [37, 38]. Cyclic voltammetry was carried out to characterize the effect of pH solutions on various redox processes. Fig.5 shows the voltammograms recorded at pH 5, 7, 8 and 9 (Bath 3). These voltammograms reveal the existence of:
- A cathodic peak K representing the reaction of reduction of Ni2+, Cu2+, H2PO2− and H3O+
ions.
- A landing D, relating to the diffusion of ions Cu2 +.
- An anodic peak A located at −750 mV/s relating to the oxidation of H2PO2− ions and
hydrogen atoms adsorbed to the surface of the electrode.
[image:6.596.72.484.377.710.2]- Two peaks B (at −100 mV) and C (at 250mV) relating to the dissolution of the Ni–Cu–P deposit. According to literature, the first peak represents the dissolution of the crystalline phase of alloy, and the second one represents the dissolution of the amorphous phase [30].
Figure 5. Cyclic voltammogram recorded on glassy carbon electrode from bath 3 (Table 1) at pH 5,7,8 and 9. Scan rate 10 mVs−1.
-1,5 -1,0 -0,5 0,0 0,5 1,0
-150 -100 -50 0 50 100 150
A
-1,0 -5 0 5
i(
m
A
/c
m
2)
E(v /ecs)
pH 5 pH 7 pH 8 pH 9
D
B
K
A
C
i(m
A/cm
2 )
In the anodic range (peak A), the polarization curves exhibit a maximum [22,37]. This indicates that the oxidation of hypophosphite is hindered by the adsorption of some species [22,29,39]:
H2PO2- + H2O → H2PO3- + 2e- + 2H+ (3)
H2PO2- + 2OH- → [H2PO2(OH)2]ads- + 2e- (4)
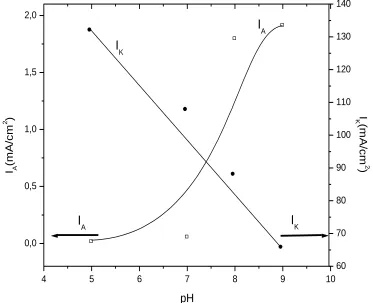
The figures 6 and 7 show the evolution of the peaks intensities IK, IA, IB and IC according to the
solution pH. The analysis of these figures shows that, when the pH increases, the peak intensity IK
decreases because of the inhibition of the H+ ions reduction, and the peak intensity IA increases, this
confirms that the increase of the solution pH favors the oxidation of the hypophosphite.
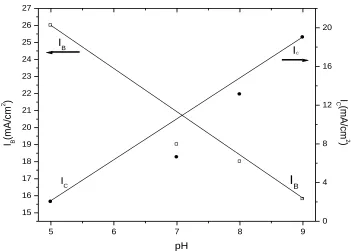
The peak intensity IB decreases, whereas the peak intensity IC remarkably increases. Moreover,
we showed previously that the increase of the pH solution acts on the structure and the copper content in the matrix. Indeed, at pH 5, the copper content is 97 wt% and has a crystalline structure: IB (relating
to the dissolution of the crystalline phase of copper-rich Cu–Ni–P alloy) >> IC (relating to the
dissolution of the amorphous phase of Cu-Ni-P). But, at pH 9, the copper content is 17.5 wt% and the structure becomes amorphous as a result: IC >> IB.
Figure 6. Deposition current, IK, at upper cathodic limit and anodic peak current, IA, as a function of
pH solution.
4 5 6 7 8 9 10
0,0 0,5 1,0 1,5 2,0
IA
I
A
IK I
K
pH I A
(m
A
/c
m
2 )
60 70 80 90 100 110 120 130 140
I
K (m
A
/c
m
2
[image:7.596.111.484.405.708.2]
Figure 7. Evolution of the currents, IB, the Ni–Cu–P crystalline phase and the Ni–Cu–P amorphous
phase, Ic, as a function of pH solution.
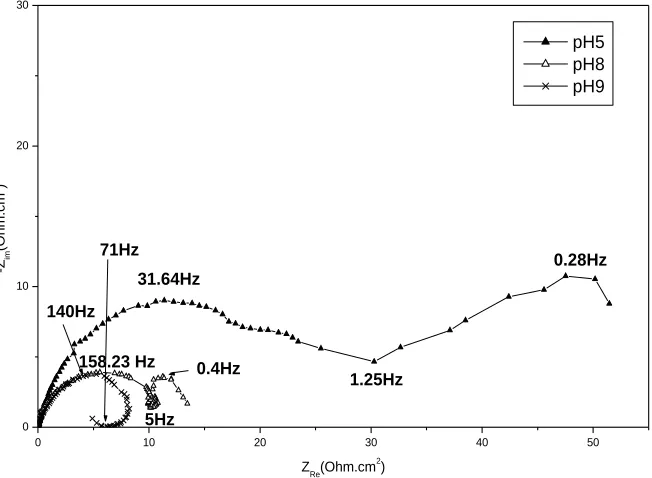
3.4. Impedance behavior
The deposition potential is characterized by a net current equal to 0, resulting from two simultaneous anodic (oxidation of hypophosphite) and cathodic processes (reduction of nickel species and hypophosphite, and evolution of hydrogen). Figure 8 shows typical impedance diagrams recorded at the plating potential, for various pH values (Bath 3). At pH=8, we obtain a characteristic impedance diagram of an alloy Ni-Cu-P [30]. This diagram presents:
- In the high frequency domain, a capacitive loop appears which is related to the relaxation of the double layer capacitance whose value is 80 µFcm-2
, in parallel with the charge transfer resistance Rt.
- An inductive loop appears with a characteristic frequency around 5Hz. This effect is more visible when the nickel content is increased (impedance diagrams recorded at pH=9, Fig 8). A similar inductive feature is observed in the deposition of nickel and attributed to the two-step discharge of the Ni2+ species through the intermediate NiIads adion [37,38,40-42]:
Ni(II) + e- → NiIads (5)
NiIads + e- → Ni (6)
- A capacitive loop appears in low frequency. The size of this effect increases when the content of copper increases (impedance diagrams recorded at pH=5, Fig 8). It is linked to the discharge of copper which is controlled by mass transport [22,33].
5 6 7 8 9
15 16 17 18 19 20 21 22 23 24 25 26 27
IB
IB
IC
IC
pH
I B
(m
A/
cm
2 )
0 4 8 12 16 20
I
C (m
A/
cm
2
[image:8.596.119.470.70.321.2]
0 10 20 30 40 50
0 10 20 30
0.4Hz 71Hz
140Hz
0.28Hz
1.25Hz 31.64Hz
5Hz 158.23 Hz
-Z
im
(Oh
m
.cm
2)
ZRe(Ohm.cm2)
[image:9.596.139.465.71.310.2]pH5 pH8 pH9
Figure 8. Electrochemical impedance plot recorded from bath 3 (Table 1) at three solutions pH (Ω= 100 tr/mn).
4. CONCLUSION
In this present work, we have investigated the influence of pH on electroless copper plating using hypophosphite as reducing agent. The deposit composition and the deposition rate depend strongly on the pH solution. The investigations carried out by XRD and SEM show that the pH of the solution influences the surface morphology and structure of deposits. The electrochemical investigation shows that the pH solution acts on the anodic and cathodic reactions. In addition, cyclic voltammetry confirms the evolution of the crystallinty of the alloy with pH.
References
1. G. Ritter, P. McHugh, G. Wilson, T. Ritzdorf, Solid State Electron, 44 (2000) 797. 2. J.A. Cunningham, Semicond. Int, 23 (2000) 97.
3. F. Wang, S. Arai and M. Endo, Electrochem. Commun, 6 (2004) 1042.
4. Jeong Hoon Byeon, Jang-Woo Kim, Journal of Colloid and Interface Science, 348 (2010) 649–653 5. R. Touir, H. Larhzil, M. Ebn Touhami, M. Cherkaoui, E. Chassaing, J. Applied Electrochem, 36
(2006)69
6. R. H. Guo, S.Q. Jiang, C.W. M. Yuen and M. C. F. Ng, J. Mater.Sci.: Mater Electron, DOI 10.1007/s10854-008-9594-4 (2008).
7. G. Xueping, W. Yating, L. Lei, Sh. Bin and H. Wenbin, J. Alloys Compounds, 455, 308 (2008). 8. G. Xueping, W. Yating, L. Lei, Sh. Bin and H. Wenbin, Surface & Coatings Technology, 201,
7018 (2007).
9. Arezoo Afzali, Vahid Mottaghitalab, Mahmood Saberi Motlagh, and Akbar Khodaparast Haghi, Korean J. Chem. Eng, 27(4), 1145-1149 (2010)
11.G. H. Hu,, F. Z. Yang, C. J. Lin, J. M. Lian, Electroplating and Finishing, 20(1) (2001)1 12.H. Honma, T. Kobayashi, J. Electrochem Soc, 141(3) (1994) 730
13.Y. Shacham-Diamand, Electrochem. Solid-State Lett, 3(6) (2000) 279 14.J. Li, P. A. Kohl. J. Electrochem. Soc, 149(12) (2002) C631
15.J. Li, P. A. Kohl. J. Electrochem. Soc, 150(8) (2003) C558 16.A.Hung and K.M. Chen, J. Electrochem.Soc, 136, 1 (1989)72.
17.C. Y.Hung , H. C.Yuan, L . F.Der , R. M.Lih , C. K.Nan, Y. J.Taut, Thin Solid Films, 517 (2009) 4984
18.C. H. Lee, J. Kim, J. Journal of Vacuum Science and Technology B, 23 (2) (2005) 475. 19.M. Sone, K. Kobayakawa, M. Saitou, Y. Sato. Electrochim. Acta, 49(2) (2004) 233. 20.L. Yinxiang , Applied Surface Science, 255 (2009) 8430.
21.Daniela Plana, Andrew I. Campbell, Samson N. Patole, Galyna Shul, and Robert A. W. Dryfe, Langmuir, 2010, 26(12), 10334–10340.
22.I.Ohno, O. Wakabayashi and S. Haruyama, J. Electrochem. Soc, 132 (1985) 2323. 23.M. Cherkaoui, A. Srhiri and E. Chassaing Plating Surf. Finish, 79 (1992) 68. 24.J.G. Gaudiello and G.L. Ballard IBM J. Res. Develop, 37 (1993) 107.
25.S. Armyanov, O. Steenhout, N. Krasteva, J. Georgieva, J.L. Delplancke, R. Winand and J. Vereecken, J. Electrochem. Soc, 143 (1996) 3692.
26.E. Valova, S. Armyanov, J.L. Delplancke, R. Winand, O. Steenhaut and J. Vereecken, J. Electrochem. Soc, 143 (1996) 2804.
27.J. Duffy, L. Pearson, and M. Paunovic, J.Electrochem Soc, 130(1983) 4
28.M. Ebn Touhami, M. Cherkaoui, A. Srhiri, A. Benbachir, E. Chassaing, J. Appl. Electrochem, 26 (1996) 487.
29.I.Ohno,Master. Sci. Eng. A 146(1991)33.
30.H. Larhzil, M. Cisse, R. Touir, M. Ebntouhami, M. Cherkaoui, Electrochemica Acta, 53 (2)(2007) 622.
31.P. G. Daniele, G. Ostacoli, O. Zerbinati and S. Sammartano, Trans. Met. Chem,13 (1988) 87. 32.P. Amico, P. G. Daniele, G. Ostacoli, G. Arena, E. Rizzarelli and S. Sammartano, Inorg. Chim.
Acta 44L, (1980) 219.
33.P. G. Daniele, G. Ostacoli, O. Zerbinati and C. Rigano, Trans. Met. Chem, 9 (1984) 385. 34.Ewa Beltowska-Lehman and Piotr Ozga, Electrochimica Acta, 32 (1998) 617
35.Hui-Sheng Yu, Shou-Fu Luo, Yong-Rui Wang, Surface and Coatings Technology 148(2001)143. 36.B. Zang, G. Li, J. Zhai, J. Environ, 13(3)(1995)38-39.
37.M. Ebn Touhami, E. Chassaing, M. Cherkaoui, Electrochemical Acta, 43 (1998) 1721. 38.M. Ebn Touhami, E. Chassaing, M. Cherkaoui, Electrochemical Acta, 48 (2003) 3651. 39.L. Burke, M. Murphy, J. Electrochem. Soc, 130 (1991) 88.
40.I.Epelboin, M. Joussellin and R. Wiart, J. Electroanal. Chem, 119, 61 (1981). 41.E. Chassaing, M. Joussellin and R. Wiart, J. Appl. Electrochem, 157, 75 (1983).
42.E.Chassaing, K. Vu Quang and R. Wiart, J. Off applied Electrochemistry, 17(1987)1267.