Disrupted alternative splicing for genes implicated
in splicing and ciliogenesis causes PRPF31 retinitis
pigmentosa
Adriana Buskin et al.
#Mutations in pre-mRNA processing factors (PRPFs) cause autosomal-dominant retinitis
pigmentosa (RP), but it is unclear why mutations in ubiquitously expressed genes cause
non-syndromic retinal disease. Here, we generate transcriptome pro
fi
les from RP11 (
PRPF31
-mutated) patient-derived retinal organoids and retinal pigment epithelium (RPE), as well as
Prpf31
+/−mouse tissues, which revealed that disrupted alternative splicing occurred for
speci
fi
c splicing programmes. Mis-splicing of genes encoding pre-mRNA splicing proteins
was limited to patient-speci
fi
c retinal cells and
Prpf31
+/−mouse retinae and RPE. Mis-splicing
of genes implicated in ciliogenesis and cellular adhesion was associated with severe RPE
defects that include disrupted apical
–
basal polarity, reduced trans-epithelial resistance and
phagocytic capacity, and decreased cilia length and incidence. Disrupted cilia morphology
also occurred in patient-derived photoreceptors, associated with progressive degeneration
and cellular stress. In situ gene editing of a pathogenic mutation rescued protein expression
and key cellular phenotypes in RPE and photoreceptors, providing proof of concept for future
therapeutic strategies.
DOI: 10.1038/s41467-018-06448-y
OPEN
Correspondence and requests for materials should be addressed to S.-N.G. (email:sushma@cantab.net) or to C.A.J. (email:c.johnson@leeds.ac.uk) or to M.L. (email:majlinda.lako@ncl.ac.uk).#A full list of authors and their affliations appears at the end of the paper.
123456789
R
etinitis pigmentosa (RP) is one of the most common
inherited forms of retinal blindness with a prevalence of
about 1 in 2500 births and more than 1 million people
affected worldwide
1. RP is characterised by progressive
degen-eration of the mid-peripheral retina, leading to night blindness,
visual
fi
eld constriction and eventual loss of visual acuity. To date,
there are no effective treatments for RP and it remains a
medi-cally challenging disease. About 15% of RP are
autosomal-dominant forms caused by mutations in the pre-mRNA
proces-sing factors (PRPFs)
PRPF8
,
PRPF31
,
PRPF3
,
PRPF4
,
PRPF6
and
SNRNP200
2–11. The PRPFs are components of the U4/U6.U5
tri-snRNP (small nuclear ribonucleoprotein) subunit of the
spliceo-some, the large RNP complex that catalyses pre-mRNA splicing.
Alternative pre-mRNA splicing expands the coding capacity of
eukaryotic genomes by differential inclusion of exons or retention
of introns in mRNA that enables a relatively small number of
genes to encode a diverse proteome. High levels of splicing
diversity occur in the vertebrate nervous system where it is
required for neuronal development and function. Mouse rod and
cone photoreceptors, for example, have a speci
fi
c splicing
pro-gramme that is initiated prior to the development of outer
seg-ments
12. This speci
fi
c splicing programme primarily affects
transcripts encoding components of photoreceptor primary cilia
and outer segments, both of which are essential for
photo-transduction. Functional primary cilia are also required for
maturation of the retinal pigment epithelium (RPE)
13.
Collec-tively, these data suggest that the precise regulation of splicing
programmes for photoreceptor-speci
fi
c transcripts, including
those that are involved in ciliogenesis, are essential for retinal
development.
Mutations in PRPFs affect the stoichiometry and kinetics of
spliceosome assembly
14,15, resulting in either transcriptional
dysregulation of genes required for retinal function
16or
mis-folding and aggregation of mutant PRPF proteins that trigger
apoptosis in photoreceptors
16,17. However, the disease
mechan-isms for PRPFs-related RP remain unclear and it is uncertain
whether RPE or photoreceptors are the primary affected tissue.
Paradoxically, PRPFs are ubiquitously expressed
10, but mutations
only cause retinal-speci
fi
c degeneration, raising the question of
why retinal cells are more susceptible to de
fi
ciencies in these
splicing factors. Furthermore, PRPF animal models either do not
recapitulate the human RP phenotype
18,19, or only manifest
late-onset RPE defects
20,21.
Since human induced pluripotent stem cells (iPSCs) can be
differentiated into RPE and photoreceptors
22–24, we developed
patient-derived retinal cells as unique physiologically relevant
disease models in order to gain new insights into the molecular
pathogenesis of splicing factor RP. We generated RPE and
three-dimensional (3D) retinal organoids from iPSCs derived from four
RP11 patients with variable clinical severity caused by two
dif-ferent
PRPF31
deletion mutations. Large-scale transcriptome
analyses identi
fi
ed mis-splicing of cell type and patient-speci
fi
c
target genes affected by
PRPF31
mutations, providing
unprece-dented molecular characterisation of splicing-factor RP clinical
phenotypes. CRISPR/Cas9 correction of a
PRPF31
mutation in
cells derived from an RP11 patient with very severe RP, resulted
in the rescue of molecular and cellular phenotypes, providing
proof-of-concept evidence for the effectiveness of in situ gene
correction.
Results
Derivation and characterisation of RP11-iPSCs. We ascertained
three
related
RP
type
11
patients
with
a
PRPF31
c.1115_1125del11 heterozygous mutation with variable
pheno-typic expression and one patient with severe RP with a
PRPF31
c.522_527
+
10del
heterozygous
mutation
(Supplementary
Data 1). Disease severity was determined according to fundus
examination, visual
fi
eld and visual acuity, and took account of
the age at the time of examination (Supplementary Data 1).
Hereafter, all patients and derived cells are referred to as RP11
accompanied by M (moderate), S (severe) and VS (very severe).
Three unaffected controls are referred to as WT1 (wild type),
WT2 and WT3 (Supplementary Data 1)
25,26. Dermal skin
fi
broblasts were reprogrammed to iPSCs using a non-integrative
RNA-based Sendai virus (Supplementary Figure 1A). All
RP11-iPSCs harboured the mutation identi
fi
ed in
fi
broblast samples
(Supplementary Figure 1B–E), expressed pluripotency markers
(Supplementary Figure 2A–B), were free of transgenes
(Supple-mentary Figure 2C), were genetically identical to parent
fi
bro-blasts (Supplementary Figure 2D) and clear of any genomic
abnormalities (Supplementary Figure 2E). Both patient-speci
fi
c
and control iPSCs were able to differentiate into cells belonging
to all three germ layers in vitro (Supplementary Figure 3A) and
in vivo (Supplementary Figure 3B).
RP11-RPE have functional and ultrastructural abnormalities.
Control and RP11-iPSCs were differentiated into RPE cells using
an established differentiation protocol (Fig.
1
a, b). Control and
RP11-iPSC-RPE showed a similar expression of the apical RPE
marker Na
+/K
+-ATPase, but expression of the basolateral
mar-ker BEST1 was reduced in the severe (S) and very severe (VS)
RP11 patients (Fig.
1
c). Polarised cells in control RPE monolayers
expressed MERTK in the apical layer and collagen IV in the basal
layer, whereas RP11-RPE had reduced expression of both markers
(Fig.
1
d). Cytokine secretion assays revealed a signi
fi
cantly higher
apical pigment epithelium-derived factor (PEDF) and basal
vas-cular endothelial growth factor (VEGF) expression in the severe
and very severe RP11 patients in comparison to control RPE
(Fig.
1
e, f). RPE cells produce very high levels of PEDF and
polarised secretion is associated with their maturation
27–29.
Furthermore, PEDF has been shown to activate cone-speci
fi
c
expression and decrease rod numbers
30. Elevated levels of such an
important cytokine could therefore impair RPE polarity, with
further functional consequences for rod survival. VEGF has also
shown to be important for the survival of Müller cells and
pho-toreceptors, in addition to its role in vasculogenesis
31, and
although no neovascularisation is observed in RP11 patients,
dysregulated VEGF expression from RPE could have important
consequences for retinal function. RP11-RPE also had an
impaired ability to form a tight epithelial barrier as measured by
trans-epithelial resistance (TER) assay (Fig.
1
g). Furthermore,
RP11-RPE derived from the two patients with severe (S) and very
severe (VS) phenotypes had reduced functional ability to
pha-gocytose rod outer segments (Fig.
1
h), corroborating previous
results following
PRPF31
knockdown in the ARPE-19 cell line
21.
At weeks 21 and 43 of differentiation, transmission electron
microscopy (TEM) analyses revealed apical microvilli and
mela-nosomes in control RPE, in contrast to RP11-RPE that displayed
shorter and fewer microvilli, and contained large basal deposits
underneath the RPE (Supplementary Figure 4). Collectively, these
data indicate a loss of apical
–
basal polarity in patient-derived
RP11-RPE.
Days 0–5
WT1
15
PEDF VEGF TER Phagocytosis
1500
400
60
40
20
0
6000
4000
2000
0
MFI 300
200
100
0 1000
500
0 10
5 n.s.
n.s.
n.s.
***
****
****
***
***
****
**** ****
****
0
WTs
RP11S1RP11MRP11VS
WTs
RP11S1RP11MRP11VS
WTs
RP11S1 RP11MRP11VS
WTs
RP11S1 RP11MRP11VS
ng/ml pg/ml
Ohms X cm
2
Inter
nalised %
Br
ightness (MFI)
WT3
BEST1 DAPI MERTK DAPI
MERTK DAPI
C-IV DAPI
C-IV DAPI
MERTK DAPI
C-IV DAPI
Na+/K+-ATPaseDAPI
WT3
RP11S1
RP11M
RP11VS
RP11S1
RP11M
RP11VS WT3
WT3
WT3
RP11S1 RP11M RP11VS
WT3
RP11S1
RP11M
MERTK DAPI
C-IV DAPI
RP11VS
RP11S1 RP11M RP11VS
RP11S1 RP11M RP11VS
10 μM SB431542,
10 ng/ml Noggin
3 μM CHIR990021 10 ng/ml
Noggin
5 ng/ml Activin A
Data collection
Data collection Days 5–9 Days 10–15
RPE differentiation
a
b
c
e
f
g
h
d
Days 16–21 Week 21 Week 43
[image:3.595.94.502.48.646.2]Day 0–5
a
b
c
d
e
10% KSR 10% FBS
1% N2 0.1 mM Taurine
Data collection
Data collection 0.5 μM RA
1% Lipids 450 μM MTG
55 ng/ml BMP4
Day 6 Day 18
WT2
W
eek 21
W
eek 43
WT2 RP11VS
OS
CC
IS
IS
*
*
*
RP11VS Week 21
Week 10
RECOVERIN
CRALBP HuCD PKCα
RECOVERIN NRL ARL13B
Week 13 Week 17 Week 21 Week 43
[image:4.595.131.463.50.613.2]packed with photoreceptors (expressing RECOVERIN) with
connecting cilia (expressing ARL13B; Fig.
2
c), some of which also
expressed NRL indicating a rod precursor phenotype. Müller glia,
ganglion and bipolar cells were also present, indicated by
CRALBP, HuC/D and PKC
α
expression (Fig.
2
c). TEM of retinal
organoids at week 21 revealed the presence of outer limiting-like
membrane, inner segments, connecting cilia and developing outer
segments in photoreceptors residing in the apical layer of retinal
organoids (Fig.
2
d). There were striking morphological
differ-ences between control and patient-derived cells. RP11 - retinal
organoids had a 150% increase in cells with apoptotic nuclei
compared to the controls (a total of 50 TEM sections analysed).
In addition, unlike WT cells, RP11 cells had 'stress vacuoles' (17%
of patient TEM sections). At week 43, TEM revealed the
con-tinuing presence of apoptotic nuclei and stress vacuoles in RP11
patient-derived photoreceptors, suggesting 'adaptive survival' in
response to environmental or oxidative stress (Fig.
2
e).
At week 21 of differentiation, the 3D retinae were
fl
attened
down on multi-electrode arrays (MEAs) with the presumed
ganglion cell layer facing down on the electrodes, in order to
record action potentials generated by these cells. Measuring
activity in retinal ganglion cells (RGCs) re
fl
ects the global
network function of the organoid, similar to the retina, since
RGCs carry the output signal to central visual areas in the form of
spike trains. Control and RP11-retinal organoids had no
difference in response to 8-Br-cGMP (a membrane permeable
analogue of cGMP), indicating that phototransduction responses,
speci
fi
cally Na
+in
fl
ux similar to the inward dark current, were
intact in photoreceptors (Supplementary Figure 5B, C & F).
Control retinal organoids responded to the addition of the
neurotransmitter GABA with an increased
fi
ring rate, but this
response was signi
fi
cantly reduced for those derived from the very
severe RP11 patient (Supplementary Figure 5D, E & G). GABA
signalling emerges during very early development, and at that
time it is depolarising and can induce spiking. Reduced responses
to GABA therefore indicate the impairment of emerging
functional neural networks in RP11 patients.
Impaired pre-mRNA splicing in RP11 RPE and retinal
orga-noids. To better understand the impact of
PRPF31
mutations, we
performed semi-quantitative RT-PCR and western blot analysis
of PRPF31 expression in primary
fi
broblasts, iPSCs and
iPSC-derived RPE and retinal organoids. We observed and con
fi
rmed
by Sanger sequencing the presence of nonsense-mediated decay
(NMD)-insensitive long mutant (LM) and NMD-sensitive short
mutant (SM) transcripts only in cells derived from RP11 patients
with the c.1115_1125del11 mutation, but not in the control cells
(Fig.
3
a).
PRPF31
expression levels were decreased more
sig-ni
fi
cantly in RP11-RPE cells (Fig.
3
b), and this was further
con-fi
rmed by western blot analysis (using an anti-PRPF31 C
terminus antibody) (Fig.
3
c, d). Interestingly, the PRPF31 LM
isoform (detected by using an anti-PRPF31 N terminus antibody)
was expressed only in RP11-RPE (Fig.
3
c). Furthermore,
RP11-RPE showed a substantial downregulation of SART1, a U5 snRNP
protein important for the formation of the pre-catalytic
spliceo-somal B complex, but no changes in the expression of the U5
protein PRPF8 or the U4/U6 protein PRPF4 were observed
(Fig.
3
c).
To test if splicing ef
fi
ciency was altered in patient-speci
fi
c cells,
we performed splicing assays
32,33following lentiviral
transduc-tion of an E1A minigene reporter with multiple 5
′
-splice sites.
This can be alternatively spliced into at least
fi
ve mRNAs (sizes
13S, 12S, 11S, 10S and 9S; Fig.
3
e). Both RP11-RPE and retinal
organoids had impaired alternative splicing of the E1A reporter,
indicated by the accumulation of pre-mRNA and the decrease in
the 9S and 10S isoforms in RPE and the 12S isoform in retinal
organoids (Fig.
3
f) compared to unaffected control and
patient-speci
fi
c RP11
fi
broblasts and RP11-iPSCs. There were no
differences in tri-snRNP stability for RP11 and control iPSCs,
as determined by sedimentation of nuclear extracts on density
gradients followed by detection of snRNAs (Supplementary
Figure 6). However, RP11 retinal organoids had decreased
expression of U4 snRNA (Fig.
3
g) compared to controls,
suggesting a likely reduced function of the U2-dependent
spliceosome.
Disrupted splicing in cellular adhesion and cilia genes. To
identify differences in transcription and splicing pro
fi
les between
RP11 patients and unaffected control cells, we next performed
large-scale transcriptome analyses in primary dermal
fi
broblasts,
iPSCs, RPE and retinal organoids as biological triplicates from all
subjects (Supplementary Data 2). We identi
fi
ed differentially
expressed transcripts by using DESeq2 (Supplementary Data 2;
threshold value
p
adj< 0.05). Fewer differentially expressed genes
were identi
fi
ed in iPSCs (
n
=
163) and RPE (
n
=
59) group
comparisons, in contrast to
fi
broblasts (
n
=
1395) and retinal
organoids (
n
=
1367). The most signi
fi
cant differentially
expres-sed genes in RP11 retinal organoids (Supplementary Data 2) were
enriched for Gene Ontology (GO) categories related to actin
cytoskeleton, ciliary membrane, primary cilium, photoreceptor
inner and outer segments, axon terminals and phototransduction
(Supplementary Data 3). In RP11
fi
broblasts, signi
fi
cant
differ-entially expressed genes were enriched for lysosome and
endo-somal processes, focal adhesion, cell-substrate junctions and
extracellular matrix organisation. There were no notable-enriched
pathways in RP11-iPSCs and RP11-RPE.
Since RP11-RPE and retinal organoids had impaired
pre-mRNA splicing (Fig.
3
f, g), we next analysed transcripts in all four
cell types for differential exon usage (skipped exons, retained
introns, alternative 5
′
and 3
′
splice sites, and mutually exclusive
exons; Supplementary Data 4) using rMATS software (threshold
values
p
adj< 0.05 and inclusion difference >5%). Differential exon
usage analyses revealed that RP11-RPE had the highest level of
transcripts with retained introns and alternative 3
′
splice sites
(Fig.
4
a and Supplementary Data 4). GO enrichment analysis of
biological processes for each cell type (Fig.
4
b) showed that RP11
fi
broblasts had signi
fi
cant differential exon usage for transcripts
implicated in cilium formation categories (cilium assembly,
cilium organisation, microtubule organising centre and
centro-some; Supplementary Data 5). This suggests that PRPF31 has a
role in
fi
broblast ciliogenesis and corroborates our previously
published data on decreased cilia length and incidence in RP11
fi
broblasts
34. In iPSCs, enriched GO biological processes included
DNA recombination and DNA double-strand break repair,
whereas enriched cellular components identi
fi
ed the centrosome,
centriole and microtubule organising centre (Fig.
4
b). RP11-RPE
were enriched in genes implicated in cells-to-substrate adherens
junctions and focal adhesions, and mitochondrial inner
mem-brane, whereas RP11 retinal organoids were enriched for centriole
and microtubule organisation (Fig.
4
b and Supplementary
Data 5).
and
U2AF1L4
), association of U2 snRNP with pre-mRNA
(
DDX39B
and
PTPB1
) and 5
′
-splice site selection (
LUCL7
). To
validate some of these
fi
ndings, we performed RT-PCR
experi-ments in RPE and retinal organoids derived from RP11 and
control iPSC samples (Fig.
4
c). For this validation we selected key
genes involved in cilia formation and/or outer segments of
photoreceptors (
RPGR
,
RPGRIP1L
and
CNOT3
), intra
fl
agellar
transport (
IFT122
), actin
fi
lament organisation, centrosome and
focal adhesion (
SORBS1
) and pre-mRNA 3
′
-end processing
(
CPSF1
). As predicted by the rMATS analysis, the RP11 RPE
- Pre-mRNA - 13S - 12S
- 10S
- 9S - 11S
RP11M retinal organoids WT2 retinal organoidsRP11VS RPEWT3 RPE RP11VS fibroblast
WT2 fibroblastWT2 iPSCRP11M iPSC
0 20 40 60 80 100 120
WT3 RP11VS RP11S2
Fibroblasts iPSCs Retinal organoids
RPE RP11S1
Ratio of PRPF31 WT (%) (normalized to SF3b-155)
kDa
150
100
50
-- SF3b155
- Snu114
- PRPF31
WT3 fibroblastRP11VS fibroblastRP11S2 fibroblastWT3 iPSCRP11VS iPSCRP11S2 iPSCWT3 retinal organoidsRP11VS retinal organoidsRP11S2 retinal organoidsWT3 RPERP11S1 RPERP11VS RPE
GAPDH WT3FIB
-RP11VS FIB
-WT3 IPSC
-RP11VS IPSC
-WT3 RPE
-RP11VS RPE
-WT3 RO
-RP11VS RO -% 100 44 100 92 100 16 100 42
0 20 40 60 80 100
Ratio of
PRPF31
WT levels (%)
(normalised to GAPDH)
- PRPF8
- SART1
- PRPF31 WT - PRPF31 LM
- PRPF4 250
100
50
50
1 0.98 0.96 1 0.88 0.87 1 1 0.95 1 0.55 0.53
a
b
c
d
e
g
9S 12S
13S
10S/11S
10S 11S Alternative splicing
pattern of E1A
0 0.5 1 1.5 2 2.5 3 3.5
WT3 fibroblastRP11VS fibroblastRP11S2 fibroblastWT3 iPSCRP11VS iPSCRP11S2 iPSCWT3 retinal organoidsRP11VS retinal organoidsRP11S2 retinal organoids
- U2
- U1 - U4
- 5S rRNA - U5 - U6
WT3 RP11VSRP11S2
WT3 RP11VSRP11S2
WT3 RP11VSRP11S2
Fibroblasts iPSCs Retinal organoids
Relative amount of snRNAs (normalized to 5S rRNA)
U2 U1 U4 U5 U6
f
0 10 20 30 40 50 60
Pre-mRNA 13S 12S 11S 10S 9S
%E1A isoforms
WT2 RP11VS WT2 RP11M WT2 RP11M WT3 RP11VS Fibroblasts iPSCs Retinal organoids RPE
PRPF31 EXON 11
Fibroblasts
200 bp WT (203 bp)
LM (192 bp)
SM (130 bp)
WT3
L + – + – + – + – + – + – + – + – RP11VS WT3 RP11VS WT3 RP11VS WT3 RP11VS
FibroblastsiPSCRetinal organoidsRPE FibroblastsiPSCRetinal organoidsRPE Biological
process: Cilium assembly Midbody Microtubule Cleavage furrow Cell surface furrow Centrosome Centriole Microtubule organising centre part Nuclear chromosome part Cell cortex Stress fibre Contractile actin filament bundle Adherens junction Cell-substrate adherens junction Cell-substrate junction Mitochondrial inner membrane Focal adhesion Cilium organisation
Organelle disassembly DNA recombination Intracellular receptor signalling pathway Double-strand break repair via homologous recombination Double-strand break repair Recombination repair Regulation of alternative mRNA splicing, via spliceosome Alternative mRNA splicing, via spliceosome Microtubule anchoring RNA splicing RNA splicing, via transesterification reactions
RNA splicing, via spleceosome Cellular respiration RNA splicing, via transesterification reactions with bulged adenosine as nucleophile Protein localisation to centrosome Protein localisation to microtubule organising centre
Cellular component:
Gene Ratio Adjusted p value
Gene Ratio 0.01 0.01 0.02 0.02 0.04 0.06 0.01 0.02 0.03 0.02 0.03 0.04 0.05 0.06
Adjusted p value
Fibroblasts iPSC Retinal organoids RPE
0 25 50 75 100 %
Splice event A3SS A5SS MXE RI SE RPGR RPGRIP1L IFT122 SORBS1 CPSF1 CNOT3 GAPDH
PSI: 58 89
PSI: 74 63
PSI: 84 79
PSI: 98 72
PSI: 9 31
PSI: 25 0 348 164 215 112 250 196 300 130 232 158 415 219 bp WT3 RP11VS Retinal organoids RPE GAPDH Control Control
RPGR PCR product
SORBS1 PCR product
CNOT3 PCR product
Biological process:
Cellular
component: Biological
process: Cellularcomponent:
RPE (Prpf31+/– vs Prpf31+/+)
Retina (Prpf31+/– vs Prpf31+/+)
a
b
c
d
e
f
15 8 14 26 22 6 37 30 7 9 6 62 81 14Endocytosis Nuclear chromatin Postsynapse
Peptidyl-lysine modification
Histone modification
Regulation of mRNA metabolic process
Endomembrane system organisation Proteasome-mediated ubiquitin-dependent protein catabolic process Proteasomal protein catabolic process mRNA processing Negative regulation of protein catabolic process Regulation of receptor-mediated endocytosis Protein acylation Anchoring junction
Acetyltransferase complex
Protein acetyltransferase complex U1 snRNP
Microtubule
ATPase complex
SWI/SNF superfamily-type complex Schmidt-Lanterman incisure Transcription elongation factor complex Spindle
SWI/SNF superfamily-type complex
Microtubule Vacuolar membrane Postsynaptic specialisation Ribonucleoprotein granule Ciliary part Centrosome Cytoplasmic ribonucleoprotein granule RNA splicing mRNA processing DNA repair Ribosome biogenesis
Regulation of cell morphogensis
ncRNA metabolic process
Gene ratio 0.025 0.01 0.02 0.03 0.04 2.0e-06 1.5e-06 1.0e-06 5.0e-06 1.5e-06 0.01 0.02 0.02 0.03 0.04 0.05 0.005 0.004 0.003 0.002 0.001 0.006 0.03 0.04 0.04 0.03 0.02 0.01 1.0e-06 5.0e-06 0.030 0.035 0.040 Ribonucleoprotein complex biogenesis Positive regulation of cell projection organisation Microtubule cytoskeleton organisation
Adjusted p value Gene ratio Adjusted p value Gene ratio Adjusted p value Gene ratio Adjusted p value
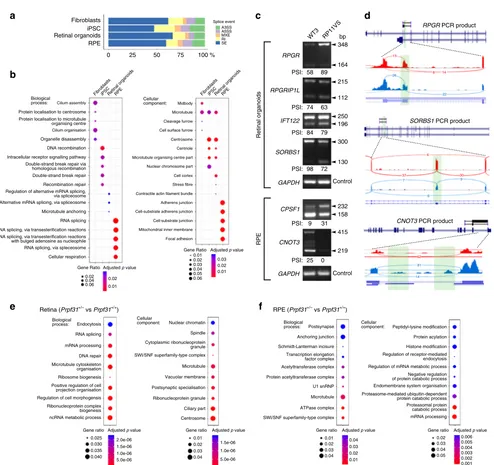
Fig. 4RNA-seq analysis of alternative splicing infibroblasts, iPSC, RPE, retinal organoids andPrpf31+/−retina.arMATS analysis showing that RP11 - RPE
have the highest percentage of transcripts containing retained introns (RI) and alternative 3′splice sites (A3SS);bGene Ontology enrichment analysis showing biological and cellular processes affected by alternative splicing, respectively, in human cells;cGel electrophoresis of RT-PCR for the indicated genes in RPE and retinal organoids derived from patient RP11VS and unaffected control WT3. Sizes (in bp) for major and minor isoforms (arrowheads), and percentage-spliced-in (PSI) values, are indicated;dSashimi plots for the indicated genes for validation of alternative splicing events in RPE and retinal organoids derived from RP11 patients (blue) and unaffected controls (red). Data are representative of at least three independent experiments. Green highlights in Sashimi plots indicate alternative splicing events with the number of junction reads indicated for each event;e,fGene Ontology enrichment analysis showing biological and cellular processes affected by alternative splicing, respectively, in mousePrpf31+/−retinae and RPE. Data are
representative of at least three independent experiments
[image:7.595.54.548.172.637.2]showed a signi
fi
cant change in alternative splicing of
CPSF1
and
CNOT3
, while RP11 retinal organoids showed alternative splicing
for
RPGR
,
RPGRIP1L
,
IFT122
and
SORBS1
(Fig.
4
d). These
in vitro data were strongly corroborated by differential exon
usage analyses of
Prpf31
+/−mouse retinae and RPE
20,21. The
most signi
fi
cantly enriched GO processes and categories in
Prpf31
+/−
mouse mutant compared to wild-type control retinae were
for RNA splicing, mRNA processing and ribonucleoprotein
complex biogenesis, as well as microtubules, cilia and
centro-somes (Fig.
4
e). Similarly,
Prpf31
+/−mouse mutant compared to
wild-type control RPE were enriched for genes involved in
mRNA processing and microtubules (Fig.
4
f). These data suggest
that disrupted alternative splicing programmes in RP11 result in
exacerbation of splicing de
fi
ciencies, in turn disrupting speci
fi
c
biological processes that cause the unique cellular phenotypes
observed in RP.
RP11 - RPE and photoreceptors show ciliary abnormalities. To
analyse the role of PRPF31 in cilia formation and function, we
fi
rst determined the extent of co-localisation of PRPF31 with an
snRNP-speci
fi
c marker (Y12, Supplementary Figure 7A) and a
cilia-speci
fi
c marker (ARL13B, Supplementary Figure 7B) in
fi
broblasts, iPSCs, RPE and photoreceptors. PRPF31 co-localised
with both snRNPs and ARL13B for all patient cell types and
controls, con
fi
rming PRPF31 localisation in both splicing
com-plexes and cilia.
We then measured cilia length and incidence in RP11 - RPE
cells using a combination of ARL13B and a basal body marker
(pericentrin) that is located at the base of the cilia (Fig.
5
a). Both
cilia incidence and cilia length were signi
fi
cantly reduced in all
RP11 - RPE cells when compared to controls (Fig.
5
b). TEM
analysis revealed the presence of long cilia with clearly aligned
microtubules in control RPE cells, while RP11 - RPE cells had
shorter, abnormal, bulbous cilia (Fig.
5
c). Structural defects in
axonemal microtubules were con
fi
rmed by serial block face
scanning electron microscopy (SBFSEM, Fig.
5
d). RP11
photo-receptors also had signi
fi
cantly reduced cilia incidence (Fig.
5
e, f)
and defective, bulbous cilia with misaligned microtubules (Fig.
5
g)
that was also con
fi
rmed by SBFSEM analysis (Fig.
5
h).
To further con
fi
rm that loss of human PRPF31 negatively
regulates ciliogenesis, we performed siRNA knockdown in the
human ciliated retinal pigment epithelial hTERT-RPE1 cell line.
Knockdown of PRPF31 protein levels caused a signi
fi
cant
decrease in cilia incidence (Fig.
6
a). Since SHH activity is known
to require functional cilia, we con
fi
rmed that
PRPF31
siRNA
knockdown caused a dysregulated response to Smoothened
agonist (SAG; Fig.
6
b). To investigate possible defects in ciliary
morphogenesis and structural organisation as a consequence of
ciliary gene mis-splicing, we used structured illumination
microscopy (SIM) to resolve the detailed localisation of proteins
along the ciliary axoneme and at the transition zone (TZ).
PRPF31
knockdown caused signi
fi
cant mislocalisation of IFT88
to the ciliary tip (Fig.
6
c), and the TZ proteins CC2D2A and
RPGRIP1L were either entirely excluded from the TZ (Fig.
6
d) or
mislocalised from the TZ into the ciliary axoneme (Fig.
6
e).
Similar mislocalisation was also evident in RP11 - RPE (Fig.
6
f, g).
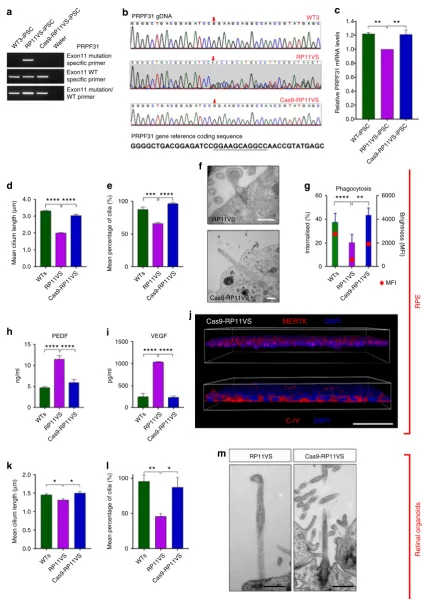
Correction of
PRPF31
mutation restores molecular and
cel-lular defects. To further validate the function of PRPF31 in
ret-inal cells, CRISPR/Cas9 genome editing was used to correct the
PRPF31
c.1115_1125del11 genetic mutation in cells from the
patient with the most severe clinical phenotype (RP11VS). For
in situ gene correction, an ssODN template with wild-type
PRPF31
sequences was designed with 91 bp homology arms on
each side of the mutation region (Supplementary Data 6). Two
hundred iPSC clones were selected and tested (Fig.
7
a), and
candidates identi
fi
ed by PCR were sequenced to con
fi
rm gene
editing of
PRPF31
(Fig.
7
b). Quantitative RT-PCR analysis
con-fi
rmed the increased expression of
PRPF31
in the
CRISPR/Cas9-corrected clone when compared to unCRISPR/Cas9-corrected iPSCs (Fig.
7
c).
We also excluded potential off-target effects (Supplementary
Data 7) and CytoSNP analysis con
fi
rmed the identity to the
parental cell line and lack of genomic abnormalities
(Supple-mentary Figure 8). The CRISPR/Cas9 iPSC clone expressed
pluripotency-associated markers Nanog and TRA-1-60, and gave
rise to cells belonging to all three germ layers (Supplementary
Figure 9).
The CRISPR/Cas9-corrected iPSC clone was differentiated to
RPE and retinal organoids, in parallel with uncorrected
RP11-iPSCs using our established protocols. Cilia length and incidence
was signi
fi
cantly increased in both corrected RPE (Fig.
7
d, e) and
corrected photoreceptors (Fig.
7
k, l). TEM analysis also revealed
cilia with well-aligned axonemal microtubules in corrected cells
that did not display the aberrant morphology observed in the
RP11-derived retinal cells (Fig.
7
f, m). Importantly,
fl
ow
cytometry con
fi
rmed the rescue of phagocytic capacity (Fig.
7
g),
suggesting an improvement of functional characteristics in
corrected RPE. Immunostaining and cytokine secretion assays
also revealed the restoration of cytokine secretion and basal
collagen IV and apical MERTK expression, suggesting that
corrected RPE apical
–
basal polarity was restored (Fig.
7
h–j).
These data indicate that in situ gene editing restored key cellular
and functional phenotypes associated with RP type 11.
ARL13BPERICENTRIN
WT3 control
Retinal organoids
ARL13B
WT3 control RP11VS patient
RPE
RP11VS patient
WT2
WT2 RP11VS
WT3 RP11S2
RP11VS
4.0
a
b
e
f
h
g
d
c
100
50
0
Mean cillium length (
μ
m)
Mean cillium length (
μ
m)
Mean percentage of cilia (
μ
m)
Mean percentage of cilia (%)
3.0 2.0 1.0 0.0
2.0 1.5 1.0
100
50
0 0.5
0.0
Patients
WTs RP11S1RP11MRP11VS
WTs RP11S2RP11MRP11VS
WTs RP11S2RP11MRP11VS WTs
RP11S1RP11MRP11VS
Patients
Patients Patients
Controls WT2
Cilia
WT3
*
*
*
RP11M RP11VS RP11S2
RP11 patients
****
****
**
*
Controls
RP11 patients
*
*
[image:9.595.62.533.44.593.2]proteins that are affected by alternative splicing in RP11 retinal
cells and deserve further investigation.
Discussion
Retinitis pigmentosa (RP) is one of the most common forms of
hereditary progressive sight loss. Autosomal-dominant
inheri-tance accounts for about 40% of RP, with an estimated 15% of
cases of this RP inheritance type caused by mutations in
pre-mRNA processing factors (PRPFs). PRPFs are ubiquitously
expressed and involved in the formation of stable U4/U6.U5
tri-snRNPs and the spliceosomal B complex leading to spliceosome
activation, yet human
PRPF
mutations result in retinal-speci
fi
c
phenotypes. Despite a large body of work in immortalised cell
lines and animal models, there are no described cellular
pheno-types for
PRPF31
-related RP type 11 that de
fi
ne the primary
affected cell type or provide clear insights into the
patho-mechanisms that can explain the retinal speci
fi
city of phenotypes.
a
c
f
g
d
e
b
siScrsiScr
siScr
siScr
WT3 control
RP11S1 patient RP11S1 patient
WT3 control
WT3RP11S1 WT3RP11S1
siScr siScr
siScr siScr
siScr 60
500
siPtch1
siPrpf31
siScr 450
400 350 300 250
n.s.
***
200 150 100 50 0
PRPF31 55 kDa
36 kDa GAPDH
Loading ratio: 1.00
Vehicle control SAG 0.51
**
5040 30 20 10
70
70 60 50 40 30 20 10 0
70 60 50 40 30 20 10 0
80 35
30 25 20 15 10 5 0 70
60 50 40 30 20 10 0
*
**
**
**
**
60 50 40 30 20 10 0 0
Cilia incidence (%)
% Cilia with IFT88
accum
ulation at the tip
% Cilia with IFT88
accum
ulation at the tip
% Cilia with RPGRIP1L
in axoneme
% Cilia with RPGRIP1L
in axoneme
% Cilia with basel CC2D2A
P
oly-Glu tub
ulin /
γ
-tub
ulin
IFT88
ARL13B
IFT88
Ac
α
-tub
u
lin
RPGRIP1L
P
oly-Glu tub
ulin /
γ
-tub
ulin
RPGRIP1L
ARL13B
CC2D2A
Firefly:
Renilla
lucif
er
ase r
atio
ARL13B
D
API
siPRPF31
siPRPF31
siPRPF31
siPRPF31 siPRPF31 siPRPF31
siPRPF31 siPRPF31
To gain insights into RP pathomechanisms, we characterised
the cellular phenotypes and splicing programmes of RPE and
retinal organoids in comparison to
fi
broblasts and iPSCs derived
from RP11 patients with
PRPF31
mutations. Through large-scale
transcriptome and biochemical analyses, we provide evidence that
impaired in vivo splicing is restricted to patient-derived retinal
cells only, and that impaired pre-mRNA splicing appears to be
limited to splicing programmes that affect RNA processing itself
(Fig.
4
). These splicing defects appeared to be correlated with
ultrastructural, cellular and functional de
fi
ciencies that are
char-acteristic of RPE in the RP disease state. These include shorter
microvilli and primary cilia, loss of polarity, reduced barrier
function and defective phagocytic capacity. Similarly,
photo-receptors in patient-speci
fi
c retinal organoids had defective
pri-mary cilium morphology and features of degeneration and
cell stress. This was corroborated by transcriptome analyses of
Prpf31
+/−mouse tissues, demonstrating that alternatively spliced
transcripts in retinae and RPE (but not brain or muscle) also
occurred within the pre-mRNA splicing category (Fig.
4
e, f). Our
results are consistent with the existence of precisely regulated
mRNA splicing programmes in the normal mouse retina that are
essential for the formation of primary cilia and their subsequent
development into photoreceptor outer segments
12. The
exacer-bation of splicing de
fi
ciencies in RP11 retinal cells, in addition to
the disruption of splicing programmes for ciliary genes, are likely
to cause the serious deleterious effects on cellular phenotypes that
underlie splicing factor RP clinical phenotypes. Importantly, our
transcriptomics and proteomics analysis suggest that RPE is the
most severely affected retinal cell type in
PRPF31
-mutated RP11
patients. In our previous work, we have shown that reduced cilia
length in
fi
broblasts derived from RP11 patients;
34however,
studies to date have not highlighted cellular de
fi
ciencies outside
the retina. Despite this ciliary de
fi
ciency, we were able to
repro-gramme RP11
fi
broblasts to iPSC with similar ef
fi
ciency and ease
as the unaffected controls. Thus, we suggest that altered
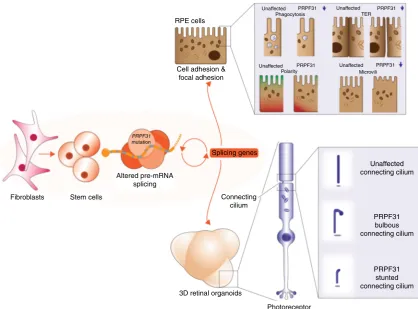
pre-mRNA splicing is the primary pathogenic defect and cilia de
fi
-ciencies are secondary impacts that arise from splicing de
fi
-ciencies (Fig.
8
). Since a recent manuscript has shown that
PRPF8
defects cause mis-splicing in myeloid malignancies
35, it will be
important in future studies to investigate cellular phenotypes in
tissues that have not previously been noted to have clinical
manifestations of pre-mRNA splicing factor de
fi
ciency.
Our transcriptome analyses do not directly interrogate the
con-sequences of mis-splicing at the protein-coding level. However, our
quantitation of the different types of alternative splicing events in
cell types (Fig.
4
a) showed that RPE and retinal organoids had the
highest burden of retained intron (RI) events. Our transcriptome
analyses do not interrogate the levels of non-canonical or intergenic
transcripts that could arise from retinal cell splicing de
fi
ciencies,
since the analysis software only aligns and maps sequence reads to
annotated
alternative
transcripts.
Unique unmapped
reads
comprised a minority of total reads (mean
=
11.307%, SD
=
3.569%, range 5.917–20.797%), but there is unlikely to be a potential
contribution of non-canonical transcripts to RP cellular phenotypes
because there are consistently no signi
fi
cant differences in the
proportion of unmapped reads between control and disease data
sets (
p
=
0.57, unpaired
t
test). However, our use of polyA-selected
RNA rather than total RNA could not exclude the involvement of
other classes of noncoding or non-canonical transcripts such as
microRNAs, long noncoding RNAs and circular RNAs. Recent
work has shown that the output of protein-coding genes shifts to
circular RNAs by a process of back-splicing under conditions when
pre-mRNA processing components are limiting
36, but the relative
contribution of this process to RP pathogenesis cannot be
deter-mined from our data sets. However, our in vitro and in vivo data
sets both strongly suggest that the exacerbation of splicing de
fi
-ciencies, speci
fi
cally of canonical transcripts in retinal cells,
con-tributes to the restricted retinal phenotype in RP11 patients.
Our study recruited four patients with different clinical severity
and
although
this
is
a
small
number
for
performing
phenotype–genotype correlations, we observed some differences in
cellular phenotypes. For example, there was no signi
fi
cant reduction
in phagocytosis for RPE cells derived from the patient with mild
clinical severity. The incomplete penetrance of RP11 has been linked
to the number of microsatellite repeat elements (MSR1) adjacent to
the
PRPF31
core promoter
37, but we did not
fi
nd any difference in
the number of MSR1 repeats between the patients and controls.
Variable clinical severity has also been linked to the expression of
CNOT3, which acts as genetic modi
fi
er for
PRPF31
38. The inclusion
of only four patients makes it dif
fi
cult to assess such genetic
corre-lations in the present study, but our work provides guidelines about
the optimal size and direction of larger future investigations into
correlations between cellular phenotype and genotype.
The development of therapies for RP and other retinopathies is
a key goal in the stem cell and regenerative medicine
fi
elds.
CRISPR/Cas9-mediated in situ gene editing has become a popular
methodology for correcting mutations in iPSCs prior to
differ-entiation into cells of interest. Our iPSC-derived disease models
are the
fi
rst for this type for splicing factor RP, and we were able
to correct the mutation in iPSC cells derived from a RP11 patient
with the most severe clinical phenotype (Fig.
7
a–m). This rescued
all key cellular and functional phenotypes in RPE, the most
severely affected patient cell type, without causing off-target
effects. This demonstrates proof of concept that in situ gene
editing is effective. For this approach to be effective in RP
patients, in situ gene editing in patient
′
s RPE and photoreceptors
has to be performed. This strategy has been successfully tested in
animal models of RP
39and intense efforts are under way to make
this applicable for human clinical trials
40. In addition to CRISPR/
Cas9 gene editing, restoration of
PRPF31
mRNA and protein
expression could also be achieved by traditional gene therapy
approaches using AAV vectors that have been optimised for
WT3-iPSC Water PRPF31
1.4
**
**
1.2
Relativ
e PRPF31 mRNA le
v
els
1.0
0.8
0.6
0.4
0.2
0.0 PRPF31 gDNA
b
c
a
d
e
f
h
i
j
k
l
m
g
PRPF31 gene reference coding sequenceWT3
RP11VS
Cas9-RP11VS
Exon11 mutation specific primer
Exon11 mutation/ WT primer Exon11 WT specific primer
RP11VS-iPSCCas9-RP11VS-iPSC
WT -iPSC
RP11VS-iPSC
Cas9-RP11VS-iPSC
WTs RP11VS
Cas9-RP11VS
WTs RP11VS
Cas9-RP11VS WTs
RP11VS
Cas9-RP11VS
WTs RP11VS
Cas9-RP11VS WTs
RP11VS
Cas9-RP11VS
WTs RP11VS
Cas9-RP11VS WTs
4.0 100 60 6000
4000
2000
0
MFI
RPE
Retinal organoids
40
Inter
nalised (%)
Br
ightness (MFI)
20
0 50
0
1500
500
0 1000
100
0 50 15
5
0 10
ng/ml pg/ml
**** ****
*** ****
**** **
3.0
PEDF VEGF
Phagocytosis
**** ****
****
*
*
**
*
****
2.0
Mean cilium length (
μ
m)
Mean percentage of cilia (%)
Mean percentage of cilia (%)
1.0
0.0
2.0
1.5
1.0
Mean cilium length (
μ
m)
0.5
0.0
RP11VS
Cas9-RP11VS
RP11VS
Cas9-RP11VS
RP11VS Cas9-RP11VS Cas9-RP11VS MERTK DAPI
C-IV DAPI
[image:12.595.83.507.46.646.2]retinal cells
41. Notwithstanding, our studies showed that
PRPF31
-mutated RPE had low but detectable levels of mutant PRPF31
proteins, corresponding to the long and NMD-insensitive mutant
(Fig.
3
c). It is unclear if mutant PRPF31 proteins could have a
dominant-negative effect, either compromising spliceosome
function in a cell-type-speci
fi
c fashion, or causing differences in
cellular phenotypes between iPSC-derived lines and even retinal
phenotypes in patients. In contrast, PRPF31 mutant proteins were
not detected in patient-speci
fi
c retinal organoids, which suggests
that any cellular and functional impairment in photoreceptors
can be ascribed to PRPF31 haploinsuf
fi
ciency, which is consistent
with previous studies
42. Nevertheless, the presence of PRPF31
mutant proteins in RPE suggests that the use of allele-speci
fi
c
antisense or morpholino oligonucleotides will be required as an
additional treatment strategy to modify
PRPF31
gene expression
in order to more fully rescue all retinal phenotypes in splicing
factor RP. However, there are important caveats to extrapolating
disease modelling in iPSCs and derivatives to future preclinical
studies of RP. In particular, cellular phenotypes of RP are
detectable in the iPSC-derived retinal cell types weeks after
dif-ferentiation, whereas the clinical phenotype in RP patients
manifests as a late-onset condition. Part of this disparity may be
explained by the observation of rapid premature senescence in
RPE differentiated from iPSCs
43,44.
In conclusion, our data provide a detailed mechanistic
expla-nation of retinal-speci
fi
c phenotypes in
PRPF31
-mutated RP type
11 (summarised in Fig.
8
) and, more generally, the
character-isation of potential pathomechanisms during retinal
degenera-tion. Our transcriptome data sets comprise a comprehensive
catalogue of target genes affected by
PRPF31
mutations. These
delineate retinal-speci
fi
c splicing programmes in the RP disease
state, providing new insights into the contribution of mRNA
processing to human disease.
Methods
Human subjects. All samples used in this study were obtained with informed consent according to the protocols approved by Yorkshire and the Humber Research Ethics Committee (REC ref. no. 03/362). Further information on the patients and controls is provided in Methods and in Supplementary Data 1.
Animals. The in vivo experiments using mice were performed according to pro-tocols approved by the Institutional Animal Care and Use Committee of the Massachusetts Eye and Ear Infirmary. All procedures were performed to minimise suffering in accordance with the animal care rules in the institution in compliance with the Animal Welfare Act, the Guide for the Care and Use of Laboratory Animals, and the Public Health Service Policy on Humane Care and Use of Laboratory Animals.
iPSC generation. Three age-matched unaffected controls (WT1, WT2 and WT3) and four RP11 dermal skinfibroblasts (RP11M, RP11S1, RP11S2 and RP11VS, Supplementary Data 1) were cultured with advanced Dulbecco’s modified Eagle Medium (Thermo-Fisher, Waltham, MA, USA) containing 10% FBS (Thermo Fisher Scientific), 1% glutamax (Thermo Fisher Scientific) and 1% penicillin/ streptomycin (Thermo Fisher Scientific) at 37 °C and 5% CO2in a humidified incubator. Thesefibroblasts were transduced at a density of 30,000 cells/cm2using
the CytoTune™-iPS 2.0 Reprogramming Kit (Life Technologies, A16517) following the manufacturer’s instructions. iPSC colonies were established on inactivated primary mouse embryonicfibroblasts feeder layer and then adapted to the feeder-free system described below.
iPSC culture. Human iPSCs were cultured on six-well plates on Matrigel™GFR (Corning, 354230)-coated wells with mTeSR™1 (StemCell Technologies, 05850) media supplemented with penicillin/streptomycin (Gibco, 15140). Cell culture medium was replaced on a daily basis. Cells were allowed to grow for 4–5 days prior to passaging or induction of differentiation. Passaging was carried out using Versene (EDTA 0.02%) (Lonza, BE17–771E) solution at 37 °C for 3–5 min and
Cell adhesion & focal adhesion RPE cells
Fibroblasts Stem cells
Splicing genes
Connecting cilium
Unaffected connecting cilium
PRPF31 bulbous connecting cilium
PRPF31 stunted connecting cilium
PRPF31
mutation
Altered pre-mRNA splicing
3D retinal organoids
Photoreceptor
Unaffected
Unaffected Unaffected
Phagocytosis TER
Unaffected PRPF31
PRPF31
Polarity Microvili
PRPF31 PRPF31
[image:13.595.88.507.48.357.2]cells were transferred to fresh matrigel plates in a 1:3–1:6 ratio. All cultures were maintained at 37 °C, in a humidified environment, with 5% CO2. Cells were cryopreserved with freezing media containing 90% foetal bovine serum (Gibco, 10270) and 10% dimethyl sulfoxide (Sigma, D2650).
Detection of pluripotency markers by immunocytochemistry. iPSC colonies werefixed in 4% paraformaldehyde (Sigma, 47608) for 15 min at room temperature and permeabilised with 0.25% Triton X-100 (Sigma, T8787) for 40 min. Blocking solution was applied (10% FBS+1% bovine serum albumin—Sigma, A3311) for 45 min at room temperature before proceeding with addition of anti-human SSEA4 conjugated with Alexa Fluor®555 (BD Biosciences, 560218, 1:200) and anti-human OCT4 primary antibody (R&D, AF1759, 1:200). Secondary staining was performed with the antibody anti-goat IgG with FITC (Jackson Immuno Research, 705-096-147, 1:500) diluted in blocking solution, followed by nuclear counterstaining with DAPI (Partec, 05-5005). Colonies were imaged using a Bioscience Axiovert microscope in combination with the associated Carl Zeiss software, AxioVision. All antibody details are shown in Supplementary Data 6.
Detection of pluripotency markers byflow cytometry. iPSCs were treated with 0.02% EDTA (Lonza, BE17-711E) for 3 min at 37 °C to dissociate the colonies. The suspension was collected in phosphate buffer saline (PBS) and centrifuged for 3 min at 300 ×g. Supernatant was removed and replaced with PBS with 0.1% BSA containing TRA-1-60-conjugated FITC (Merck Millipore, FCMAB115F, 1:60) and NANOG conjugated with Alexa Fluor®647 (Cell Signaling Technology, 5448S, 1:150). Samples were incubated in the dark at room temperature for 60 min on a shaker. Cells were washed with PBS and resuspended in FACS buffer (PBS with 2% FBS). At least 10,000 events were analysed using a FACS Canto IIflow cytometer. Results were analysed using the FACSDiva software.
In vitro and in vivo three germ-layer differentiation. iPSCs were detached from six-well plates (20–30 colonies per well) using 1 ml of 1 µg/ml Collagenase type IV (Gibco 17104–019) and 0.5 µg/ml Dispase II (Gibco, 17105–041) solutions. The colony suspension was transferred to a 50 ml conical tube until the colonies settled in the bottom of the tube. The supernatant was carefully aspirated and 2 ml of differentiation media, containing DMEM-F12 (Gibco 11330), 20% FBS (Gibco, 10270), 1% penicillin/streptomycin (Gibco, 15140), 1% non-essential amino acids (Gibco, 11140), was added per well. The colony suspension was then transferred to a 10 cm Petri dish and media was changed every day. After 7 days, the embryoid bodies (EBs) were transferred to a gelatin-coated 24-well plate or a chamber slide. After an additional 7 days, colonies werefixed and stained with specific antibodies for the three germ layers using the 3-Germ Layer Immunocytochemistry Kit (Life Technologies, A25538). As a negative control, cells were stained only with sec-ondary antibodies.
For the teratoma assay, iPSC colonies were dissociated with EDTA and 1 million cells were resuspended in a 200μl solution of PBS (Gibco, 14190)+2% FBS (Gibco, 10270). The samples were injected intraperitoneally in immunosuppressed mice at the Comparative Biology Centre, at the Medical School, Newcastle University. Each injection consisted of 0.5 million cells mixed with 100μl Matrigel (BD, 354230). Following a period of 10 weeks, the mice were killed and the teratomae were excised, processed and sectioned according to standard procedures and stained for Weigert’s haematoxylin, Masson’s trichrome and Mayer’s haematoxylin and eosin histological analysis. Sections (5–8 µm) were examined using bright-field microscopy and stained tissue photographed as appropriate.
hTERT-RPE1 cell culture. Human telomerase reverse transcriptase-transformed retinal pigment epithelium (hTERT-RPE1) were purchased from American Type Culture Collection (ATCC) at passage 9. The genomic status of the cell lines was assessed by array CGH and karyotyping. All cell lines were tested every 3 months for mycoplasma. Cell lines were maintained in DMEM/Ham’s F12 medium (Gibco, 31331) supplemented with 10% foetal calf serum (FCS) (Sigma-Aldrich, F7524), under standard conditions (37 °C, 5% CO2). Cells were passaged at a split ratio of 1:8 twice a week, with low passages (<25) for both mIMCD3 and hTERT-RPE1 cells. hTERT-RPE1 cells were serum starved in OptiMEM (Gibco, 31985) for 48 h to induce ciliogenesis.
RNA isolation and reverse transcription. iPSC and iPSC-derived cell pellets were washed with PBS before being lysed with RNA Lysis buffer provided by the RNA extraction kit ReliaPrepTMRNA Cell Miniprep System (Promega, Z6010). The
manufacturer’s instructions were followed, including a DNAse incubation step to the extracted RNA. The products were then passed through a column and resus-pended in nuclease-free water. RNA was stored at−80 °C or immediately used for cDNA synthesis. RNA was measured with a NanoDrop 2000 Spectrophotometer (Thermo Scientific) and 1 µg of extracted RNA was converted into cDNA using GoScriptTM Reverse Transcription System (Promega, A5000) following the manufacturer’s instructions.
Reverse transcription polymerase chain reaction. For detection of any residual expression of the ectopically applied Yamanaka factors, RT-PCR was utilised in
which the primers used were complementary to part of the SeV vector as well as the transgenes. Oligonucleotides for the housekeeping gene (GAPDH) were used as a positive control. For the detection of mRNA transcripts as a result of c.1115_1125 del11 mutation, we have designed primers to detect wild type, long and short mutant transcripts ofPRPF31gene. All primers are listed in Supplementary Data 6. For the PCR reaction mixture, cDNA produced from 1 µg of RNA was amplified using the primers described on CytoTune™-iPS 2.0 Sendai Reprogramming Kit User Guide at the concentration of 10 µM each in addition to 10 µM dNTP mix, 5X Green GoTaq®Reaction Buffer and GoTaq®DNA Polymerase (5 U/µl) (Promega, M3175). The PCR consisted of a 35-cycle programme of 95 °C for 30 s, 55 °C for 30 s followed by 72 °C for 30 s and was carried out using a Mastercycler®thermal cycler. Following the reaction, the samples were analysed using a 2% agarose gel electrophoresis mixed with GelRedTM Nucleic Acid Stain (Biotium, 41003). A 100 bp ladder was run against the samples.
Quantitative real-time polymerase chain reaction. qRT-PCR was performed using the GoTaq™qPCR Master (Promega) according to the manufacturer’s instructions. Each reaction contained 5μl GoTaq qPCR Master Mix (Promega), 0.5μl cDNA sample, nuclease-free water and 0.6μl primers (10μM). All amplified products ranged from 100 to 200 bp in size. The plates were run on an Applied Biosystems 7500 fast Real Time PCR machine. The cycling programme consisted of a hot-start activation at 95 °C for 5 min, followed by 45 cycles of denaturation at 95 °C for 10 s, annealing/extension at 60 °C for 30 s and denaturation 95 °C for 1 min. Following amplification, a melt-curve analysis was performed from 65 to 95 °C with 0.5 °C increments every 10 s. Each sample was run in triplicate, and the average quantification cycle (Cq) value was determined. Control reactions were run with water instead of template for each primer pair to check for primer-dimers and reagent contamination. Normalised gene expression values (againstGAPDH) were obtained using theΔΔCT method. All primer details are shown in Supplementary Data 6.
Genomic DNA extraction. Genomic DNA was extracted from the pelleted cultures of the iPSC and corresponding parentalfibroblast cell lines using the QIAamp DNA Mini Kit (Qiagen, 56304) following the manufacturer’s instructions.
Mutation screening. An aliquot of 10 ng of DNA from control and patients’ fibroblasts and iPSCs was amplified by standard PCR (40 cycles of 95 °C for 30 s, 64 °C for 30 s and 72 °C for 30 s) using primers described by Dong et al.42for the specific exons where thePRPF31mutations were located. The amplified products were purified using the QIAquick PCR Purification Kit (Qiagen, 28104) and quantified using the Qubit®2.0 Fluorometer. The sequencingfiles were analysed in the SeqScape v.2.5 software and forward and reverse sequences from bothfi bro-blasts and iPSCs were aligned and compared with thePRPF31reference sequence gene (NG_009759.1) from GenBank to identify thePRPF31mutations. The con-sensus sequences from the forward and reverse sequences were then extracted from the software and pairwise aligned against the codingPRPF31sequence. Here the nucleotide designated as 1 commences at position 36 of GenBank accession number AL050369. All primer details are shown in Supplementary Data 6.
SNP array. DNA samples from the iPSCs and corresponding parentalfibroblasts were analysed using the Infinium HumanCytoSNP-12 (Illumina, WG-320-2101) SNP array following the manufacturer’s instructions. The results were analysed using the BlueFuse Multi 4.3 software (Illumina, San Diego, USA).
iPSC differentiation to retinal pigment epithelium. iPSC colonies were grown to 80–95% confluency and all differentiation areas were removed. mTeSR™1 media was replaced with 2 ml of differentiation medium [Advanced RPMI 1640, (12633, Gibco), GlutaMAX-1 (35050, Gibco), penicillin/streptomycin (Gibco, 15140) and B-27 (Gibco, 17504)] supplemented with 10μM SB431542 (STEMCELL™, 72232) and 10 ng/μl Noggin (R&D Systems, 6057-NG-025) from days 0 to 5. From days 6 to 9, only 10 ng/μl Noggin (R&D Systems, 6057-NG-025) was added to the med-ium. From days 10 to 15, the medium was supplemented with 5 ng/μl Activin A (PeproTech, 120–14 A) and from days 16 to 21, Activin A was replaced with 3μM CHIR99021 (Sigma, SML1046). The cells were then fed every 2 days until thefirst RPE patches appeared, normally by week 4 of differentiation. RPE patches were mechanically picked and placed in TryPLE (10×) (Invitrogen, USA) for 30 min to dissociate the cells, agitated by gentle pipetting at 10, 20 and 30 min. Cells were sieved using a 100 µm cell strainer and re-plated at 4.5 × 10⁵cells per cm2on
24-well plates or 0.33 cm2PET hanging cell culture inserts (Merck Millipore; Billerica,
USA) coated with PLO/laminin (50 ng/μl) (Sigma-Aldrich, USA).
differentiation medium (45% Iscove’s modified Dulbecco’s medium (Gibco, 12440–053), 45% Hams F12 (Gibco, 31765–029), 10% KSR (Gibco, 10828–028), glutamax (Gibco, 35050–038), 1% chemically defined lipid concentrate (Thermo, 11905031), 450 µM monothioglycerol (Sigma, M6145), penicillin/streptomycin (Gibco, 15140–122). This was defined as day 0 of differentiation. BMP4 (55 ng/ml, R&D, 314-BP) was added to the differentiation medium on day 6. Half of the medium was exchanged every third day. On day 18, the aggregates were transferred from a 96-well plate to a low-attachment 6-well plate, and further cultured in suspension in the neural retinal differentiation medium containing DMEM/F12 (Gibco, 31330–038), 10% foetal bovine serum (Gibco,10270–106), 1% N2 supplement (Thermo, A1370701), 0.1 mM taurine (Sigma, T8691), 0.5 µM retinoic acid (Sigma, R2625), 0.25μg/ml Fungizone (Gibco, 15290–02), penicillin/ streptomycin (Gibco, 15140–122). The cells were maintained for up to 43 weeks, with media changes every 3–4 days.
APS-MEA experiments. Recordings were performed on the BioCam4096 platform with BioChips 4096S+(3Brain GmbH, Lanquart, Switzerland), integrating 4096 square microelectrodes. Organoids were transferred to 33 °C artificial cere-brospinalfluid (aCSF) containing the following (in mM): 118 NaCl, 25 NaHCO3, 1 NaH2PO4, 3 KCl, 1 MgCl2, 2 CaCl2, 10 glucose, and 0.5 l-glutamine, equilibrated with 95% O2and 5% CO2. Organoids were dissected longitudinally and placed, with the presumed RGC layer facing down, onto the 4096 channel MEA,flattened with a translucent polyester membranefilter (Sterlitech Corp., Kent, WA, USA). The organoids were allowed to settle for at least 2 h. To reliably extract spikes from the raw traces, we used a quantile-based event detection45and single-unit spikes were sorted using an automated spike sorting method for dense, large-scale recordings46. Statistical significance andfiring rate analyses were evaluated by using Prism (GraphPad, CA) and MATLAB (Mathworks, MA). Light stimuli were projected as described previously46. Broad white light pulses (200 ms, 217 µW/cm2
irradiance, 1 Hz) were presented for 5 min onto the organoids after recording of 5 min without pulsed light stimulation. The drugs cGMP (8-Bromoguanosine 3′,5′ -cyclic monophosphate, Sigma-Aldrich, MO) and GABA (γ-Aminobutyric acid, Tocris Bioscience, Bristol, UK) were puffed in the recording chamber (final con-centrations, cGMP 100 µM, GABA 125 µM) and 2 min before and after the puff were recorded.
CRISPR-Cas9 correction ofPRPF31mutation in the RP11VS. Correction of PRPF31mutation in the RP11VS iPSCs was achieved by using the CRISPR/ Cas9 system in combination with ssODNs as homologous templates covering the mutation site. The online design tool (http://tools.genome-engineering.org) was used to design the sgRNA sequences and predict off-targets. The sgRNA (see Supplementary Data 6), which targets only mutant but not wild-typePRPF31 sequences and predicted to have low off-targets, was chosen. The sgRNA was cloned into the CRISPR/Cas9 vector (pSpCas9(BB)-2A-Puro) following the pro-tocol from Ran et al.47. The ssODN template with wild-typePRPF31sequences was designed manually with 91 bp homology arms on each side of the mutation region (Supplementary Data 6). The sgRNA-CRISPR/Cas9 vector and ssODN were co-transfected into the RP11VS iPSCs by using Lipofectamine-3000 (Invitrogen) according to the manufacturer’s instructions. Twenty-four hours after transfection, puromycin (0.2 µg/ml) was added for 2 days. Four–5 days after selection, the resistant iPSCs were dissociated into single cells using Accutase (Gibco, A1110501). A total of 100,000 cells in mTeSR1 media supplemented with ROCK inhibitor (Y-27632, Chemdea, CD0141, 20 µM) were plated on a 10 cm Matrigel-coated dish. After 7 days, the colonies were picked and transferred to a cell culture 96-well plate. When the wells became confluent, iPSCs were split in two 24-well plates for further expansion and DNA isolation. Genomic DNA (gDNA) was isolated using QIAamp DNA Mini Kit (Qiagen, 56304). Subsequently, PCR were performed with the primers includingPRPF31-mutation specific primers;PRPF31-WT-specific pri-mers;PRPF31-mutation/WT primers (Supplementary Data 6). The positive clones, which are negative forPRPF31-mutation-specific primers and positive forPRPF31 -WT-specific primers were sequenced to confirm in situ gene editing ofPRPF31.
Off-target prediction and capture sequencing. sgRNA off-target sequences were predicted using the online design tool (http://tools.genome-engineering.org). Each sgRNA off-target sequence was blasted against the human genome reference (https://blast.ncbi.nlm.nih.gov/Blast.cgi). Capture intervals were expanded by ~500 bp in both the 5′and 3′directions. Primers were designed in this region (Sup-plementary Data 6). The PCR products were then sequenced to check the off-target effects of sgRNA.
Measurement of trans-epithelial resistance. TER was performed using a Mil-licell ERS-2 Voltohmmeter (Millipore, MERS00002) by measuring the resistance of the blank transwell insert with PBS (Gibco, 14190) and the insert with RPE cells. The shorter and longer tips of the electrode were inserted in the transwell apical chamber and in the basolateral chamber, respectively. The resistance was measured twice in each transwell insert. The resistance reading of the blank was then sub-tracted from the resistance reading of the cells for each measurement. The results were multiplied by the membrane area value using the formula: Unit area
resistance=Resistance (Ω) × effective membrane area (cm2), where thefinal value
was given in ohms (Ω).
Transmission electron microscopy. RPE and 3D optic cup samples werefixed with 2% gluteraldehyde in 0.1 M sodium cacodylate buffer and sent to the trans-mission electron microscopy facilities at Newcastle University, where samples were postfixed in 1% osmium tetroxide, dehydrated in gradient acetone and embedded in epoxy resin. Ultrathin sections (70 nm) were picked up on copper grids, stained with uranyl acetate and lead citrate and imaged using a Philips CM100 trans-mission electron microscope with high-resolution digital image capture.
Serial block face SEM. Cells werefixed overnight in 2% glutaraldehyde in 0.1 M sodium cacodylate buffer. Oncefixed, the samples were processed using the heavy metal staining protocol adapted from Deerinck et al.48. Briefly, samples were incubated in a series of heavy metal solutions−3% potassium ferrocyanide in 2% osmium tetroxide, 10% thiocarbohydrazide, 2% osmium tetroxide again, 1% uranyl acetate overnight andfinally lead aspartate solution. Between each step the samples were rinsed thoroughly in several changes of deionised water. Samples were dehydrated through a graded series of acetone and then impregnated with increasing concentrations of Taab 812 hard resin, with several changes of 100% resin. The samples were embedded in 100% resin and left to polymerise at 60 °C for a minimum of 36 h. The resin blocks were trimmed to ~0.75 mm by 0.5 mm and glued onto an aluminium pin. In order to reduce sample charging within the SEM, the block was painted with silver glue and sputter coated with a 5 nm layer of gold. The pin was placed into a Zeiss Sigma SEM incorporating the Gatan 3view system, which allows sectioning of the block in situ and the collection of a series of images in thez-direction. Multiple regions of interest were imaged at ×2000 magnification, 3000 × 1500 pixel scan, which gave a pixel resolution of ~15 nm. Section thickness was 50 nm in thez-direction. In the resulting z-stacks, cilia were identified and segmented manually using Microscopy Image Browser (MIB, University of Hel-sinki). The segmentations were imported into Amira (FEI) for construction of the 3D models.
Phagocytosis assay. Bovine rod photoreceptor outer segments (POS) (InVi-sionBioResources, 98740) were centrifuged at 2600 ×gfor 4 min and the pellet was resuspended in 100μl of advanced RPMI (AdRPMI) 1640 medium (12633, Gibco). The POS were incubated with 0.4 mg/ml FITC (Sigma, F7250) for 1 h at room temperature and agitated in the dark. POS were centrifuged at 2600 ×gfor 4 min and washed three times with PBS (Gibco, 14190). Then, they were resuspended in AdRPMI 1640 (12633, Gibco)+B-27 Supplement (Gibco, 17504)+10% foetal bovine serum (FBS) (Gibco, 10270) and the staining was confirmed under a Bioscience Axiovert microscope. RPE cells were treated with 1 × 10⁶POS-FITC per
cm2and incubated for 4 h at 37 °C. For the control experiments, RPE cells were
treated with the same number of non-stained POS and incubated for the same time. Cells were rinsed with PBS supplemented with calcium and were detached from the wells using 200μl of Trypsin for 5–8 min. Trypsin was neutralised by the addition of 500μl of AdRPMI 1640 medium+10% FBS and POS were centrifuged at 300 ×g. Cell pellets were resuspended in FACS buffer (PBS with 2% FBS) and transferred to FACS tubes. 5 mM DRAQ5 (Biostatus, DR50200; 1:2500) was used to distinguish cells from debris and outer segments. Cells were washed with 0.2% trypan blue solution (Sigma, T8154) to quenchfluorescence from bound POS, washed with PBS and suspended in FACS buffer. Samples were analysed imme-diately on a LSRIIflow cytometer and 10,000 events were collected per sample. Results were analysed using FacsDiva software.
RPE cytokine secretion studies. Medium from basal and apical chambers of transwell inserts were collected from RPE cells of healthy controls and patients. The levels of PEDF and VEGF secretion were measured by using human PEDF-ELISA Kit (Cusabio, CSB-E08818h) and human VEGF-PEDF-ELISA Kit (Life technolo-gies KHG0111) according to the manufacturer’s instructions.
Immunofluorescence and microscopy of hTERT-RPE1 and RPE. Immuno-fluorescence staining was performed as described previously49. hTERT-RPE1 cells were cultured as described above. Coverslips were seeded with 105cells and serum
starved in OptiMEM for 48 h after transfection to induce ciliogenesis. Twenty-five pmoles of siRNA was reverse-transfected using Lipofectamine RNAiMAx (Invi-trogen). Ciliated cells werefixed in ice-cold methanol for 5 min at−20 °C, treated with 0.05% Triton X-100 in PBS for 5 min, and blocked in 1% non-fat milk in PBS for 30 min. Fixed cells were stained for 90 min with appropriate primary anti-bodies. Coverslips were then washed in PBS and stained for 1 h with appropriate Alexa Fluor-conjugated secondary antibodies (Life Technologies). Coverslips were washed again with PBS before mounting in Prolong Gold ant