Int. J. Electrochem. Sci., 7 (2012) 6247 - 6264
International Journal of
ELECTROCHEMICAL
SCIENCE
www.electrochemsci.org
The ABTS-HRP System as an Alternative Method to RRDE for
the Determination of the Selectivity of the Oxygen Reduction
Reaction
Xi Cheng1,4, Lilyan Challier3, Arnaud Etcheberry2, Vincent Noël3, Henri Perez1,*
1
Laboratoire Francis Perrin, CEA/DSM/IRAMIS/SPAM-LFP CNRS URA 2453 bât. 522, 91191 Gif/Yvette, France
2
Institut Lavoisier (ILV, UMR 8180 CNRS, Université de Versailles Saint Quentin, 45 Avenue des Etats-Unis, 78035 Versailles, France
3
Université Paris Diderot, ITODYS, UMR 70 86 CNRS, 15 rue Jean-Antoine de Baïf, 75205 Paris cedex 13, France
4 Agence de l’environnement et de la Maîtrise de l’Energie 20, avenue du Grésillé- BP 90406 49004
Angers Cedex 01 France *E-mail:
Received: 3 May 2012 / Accepted: 7 June 2012 / Published: 1 July 2012
A 2,2’-azino-bis(3-ethylbenzothiazoline-6-sulfonate) (ABTS)-H2O2-peroxidase system was involved
to study the oxygen reduction reaction (ORR) selectivity in acid medium. The average number of electron transferred per oxygen molecule (n) was calculated by measuring the quantity of H2O2
produced during the oxygen reduction reaction, taking advantage of the high activity of peroxidase enzyme coupled with the ABTS chromogen. The method was validated using electrode materials for which the electron pathway is established. It is simple, accurate and can be used on various kind of electrode structure.
Keywords: ORR, selectivity, hydrogen peroxide, porous electrodes
1. INTRODUCTION
proceed by two major pathways: a“direct” four electron pathway (1) and a two electron “peroxide” pathway [4](2).
O2 + 4H+ + 4e- → 2H2O E0 = 1.229 V (1)
O2 + 2H+ +2e- → H2O2 E0 = 0.670 V (2)
The Rotating Ring Disk electrode is widely used to estimate the ORR selectivity, as it allows the amount of H2O2 produced during the reaction to be estimated. The measurement is performed on a
sample of the electrocatalysts deposited on the disk. Due to the small area of the disk it is difficult to make a homogeneous deposit in term coverage and roughness. It is therefore of interest to develop alternative methods to RRDE measurement which can be applied to electrodes having various shape and feature. In this paper, the 2,2’-azino-bis(3-ethylbenzothiazoline-6-sulfonate) (ABTS)-peroxidase system [5,6] is used to measure the amount of H2O2 produced during the ORR. The measurement is
based on the complete consumption of H2O2 by peroxidase in the presence of ABTS. ABTS regenerate
peroxidase giving a radical-cation (ABTS·+) with an absorption maximum at 414 nm (3), the intensity of which is proportional to the amount of H2O2 initially present in the sample.
ABTS ABTS·+ (3) λmax = 340 nm λmax = 414 nm
The determination of the H2O2 quantity produced was here obtained from calibration curves
built using solutions containing ABTS-peroxidase couple and known amounts of H2O2.
Chronoamperometry measurement was performed in O2 saturated acid electrolyte on various
electrodes, in order to measure the total number of mole of electron (MTe-) consumed by oxygen reduction at a given time. At this time a volume of the electrolyte was submitted to H2O2 amount
(MH2O2)determination using ABTS-peroxidase mixture. The number of mole of electrons involved in
the production of H2O2 (M2e-) was calculated using equation (4), and the percentage of H2O2 (H2O2%)
was deduced from equation (5).
M2e- = 2 × MH2O2 (4)
H2O2% (5)
Also, the average number of electron transferred per oxygen molecule (n) was obtained from equation (6)
In order to check the feasibility of our method, n measurements were first carried out on electrode materials for which the ORR electron pathway is established. Bulk Pt was used as electrode material proceeding via the four electron pathway (1). Pure carbon nanotubes and chemically grafted carbon nanotubes with 2-aminoanthraquinone electrodes known as two electrons pathway ORR materials were used (2) [7-10]. Additional n determinations were finally performed on porous electrodes structures developed in our laboratory, which are based on organically capped platinum nanoparticle electrocatalyst (NP) and carbon nanotubes (CNT) [11,12].
2. EXPRIMENTAL PART
2.1 Chemicals
Horseradish peroxidase (HRP RZ=3.2), 2,2’-azino-bis (3-ethylbenzthiazoline-6-sulfonic acid), diammonium salt (ABTS) and phosphate Buffered Saline (PBS), 2-aminoanthraquinone (AQ) ,NaNO2
and HCl (37%) were purchased from Sigma Aldrich; H2O2 solution (30% v/v) and isopropanol were
supplied by Merck; HClO4 (70%) from Fluka.
2.2 Instrumentation
The electrochemical measurements were performed using Bio-Logic VMP3 potentiostat. The electrolyte was HClO4 at the 0.1 M concentration. The counter electrode was a platinum foil and the
reference electrode a Sodium-Saturated Calomel Electrode (SSCE, Radiometer Analytical). In the figures of the paper the potential has been reported vs. the Standard Hydrogen Electrode (SHE, -0.236 V vs. SSCE). UV-VIS spectra were recorded with a JASCO V-570 UV-VIS spectrophotometer. For calibration curves and H2O2 amount determination all the volumes were collected using Eppendorf
micropipettes.
2.3 Electrodes
Bulk platinum electrode consisted in a 2 square centimeter foil and was used as 4 electron pathway ORR material. The multi-walled carbon nanotubes were produced by catalytic chemical vapor deposition as previously reported[13] and treated thermally (2000°C under argon), in order to remove the iron catalyst residue involved in the synthesis. Nanotubes were dispersed in isopropanol using a standard 12 liters ultrasound trough for 2 to 3 hours. Electrodes were formed as previously reported by filtration of a given volume of liquid dispersion on a carbon felt [11] (Freudenberg H2315 T10 A felts). These electrodes were used as formed (CNT electrodes) or were electrochemically grafted with 2-aminoanthraquinone (CNT-AQ electrodes), using the well established diazonium procedure (see S1). This gives electrodes able to reduce oxygen through the 2 electron pathway [8,9].
nanocomposite dispersion combining capped electrocatalyst and carbon nanotubes is prepared, in which the platinum density at carbon nanotube surface is well controlled and closely related to the mass ratio NP/CNT involved in the experiment. The active layers are then formed by vacuum assisted filtration of the nanocomposites liquid dispersion onto a carbon felt. The macroscopic geometrical area of the porous active layer formed on the carbon felt is generally 2.54 cm2. The platinum loading in these electrodes can be controlled by both, the feature of the liquid dispersion by changing the mass ratio NP/CNT or using different volumes of liquid dispersion involved in the filtration on the carbon felt. Different types of electrodes were prepared from different nanocomposite liquid dispersions: NP/CNT masse ratio 20% to give electrodes with a Pt loading of 38.6 µgPt.cm-2
. NP/CNT masse ratio 3% to give electrodes with Pt loadings of, 2.1, 4.3, 6.4, 12.8, 17.0 µgPt.cm-2. NP/NT mass ratio 10% to form electrodes having identical total amount of platinum but different platinum density of 19.3 µgPt.cm-2and 64.1 µgPt.cm-2
.
2.4 Spectrophotometric assay of H2O2
The solutions for the determination of the calibration curve and for H2O2 assay were prepared
as:
1. HClO4 0.1 M
2. H2O2 0.02 mM in HClO4 0.1 M
3. PBS 1 tablet in 200 ml water, pH=7.4
4. A solution containing HRP (0.021 mg.ml-1) and ABTS (0.0144 mM) prepared from PBS solution 3. The spectrophotometric calibration was performed as follow: 3 ml of the solution HRP-ABTS-PBS and a given volume (for example 10µl) of H2O2 in HClO4 0.1 M (solution 2) was added in the
sample cuvette (Hellma 100-QX). Then 3 ml of the solution HRP-ABTS-PBS and 10 µl of HClO4 0.1
M (solution 1) corresponding to the same H2O2 solutionvolume introduced in the sample cuvette, were
added in the reference cuvette. The addition of HClO4 0.1 M in the reference cuvette was performed
to keep the same concentration of HRP and ABTS and to record the modification only induced by H2O2. A scan between 200 nm and 800 nm was recorded right after the filling of the sample and
reference cuvettes. The procedure was repeated for 30, 50, 70, 100, 200, 300 µl additions of H2O2
(solution2) in the sample cuvette, and the same volumes of HClO4 0.1 M (solution 1) in the reference
cuvettes to establish the calibration curve. The high activity of HRP ensures a fast consumption of H2O2. But the absorption which is recorded is due to the ABTS which regenerate the HRP. Thus, in
order to make sure that the H2O2 added in the sample cuvette was consumed completely and rapidly,
we set the concentration of ABTS in the cuvette much higher than that of H2O2 (CABTS ≥ 10CH2O2). All
H2O2 is 6.10-8 M in the cuvette what is considered as the detection limit of the system in our
experimental conditions. Also related to our experimental conditions the pH of the solution changes in the cuvette if more than 300 µl of HClO4 (solution 1) is added, making HRP losing its catalyst activity
[14].
2.5 Electrochemistry
Electrodes that incorporate carbon nanotubes are porous and were impregnated by the electrolyte using a reported procedure [11]. First, for each kind of electrodes, cyclic voltammetry was performed in O2 and Argon saturated electrolyte at 100 mV/s, to clearly identify the reduction peak
related to oxygen reduction. These peak potentials values (vs. SHE: 0.5 V for Bulk Pt, -0.025 V for CNT electrode, -0.4V for CNT-AQ electrode) were used to perform the chronoamperometry. During the measurement the electrolyte was kept under mechanical magnetic stirring and permanent bubbling of O2. Then, determined volumes of the electrolyte were collected and were introduced in the quartz
cell (see above) for spectrophotometric detection and assay of H2O2 possibly produced during the
ORR.
3. RESULTS AND DISCUSSION
3.1 Calibration curve for H2O2 assay
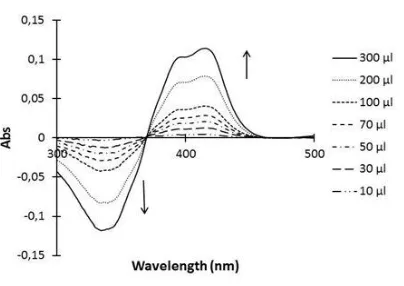
Figure 1 shows the UV-Visible spectra recorded on sample cuvettes right after the addition of increasing amount of H2O2.
Figure 1. Absorption spectrum of the solution containing HRP (0.021 mg.ml-1) and ABTS (0.0144 mM) in PBS (pH=7.4) with different addition volume of H2O2 (solution 2).
It is seen that the ABTS·+ radical specific absorption peak at 414 nm [5,6] increases with the H2O2 concentration. Concomitantly, a negative absorption appears at 340 nm which is the maximum
[image:5.596.201.403.502.645.2]
ABTS at the same concentration, but the addition of H2O2 in the sample cuvette results in the ABTS
consumption. This leads to a decrease of ABTS concentration in the sample cuvette producing a negative absorption on the spectra, the intensity of which is directly related to the absorption of the ABTS·+
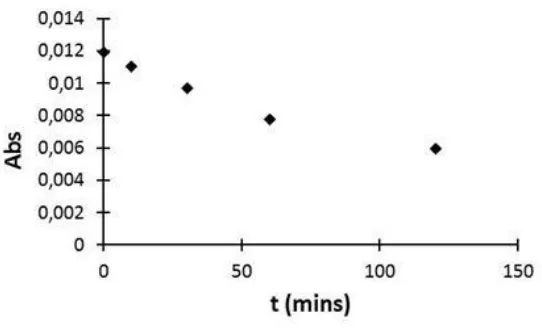
radical which is formed from ABTS. Presumably due to the “back” reaction of ABTS·+ into ABTS [6], a time-dependent decay of the absorption at 414 nm absorption was observed (Figure 2). This indicates that the UV-VIS measurements must be carried out within quite after the addition of the H2O2 into the cuvette. A linear calibration curve was obtained by plotting the absorbance of ABTS·+
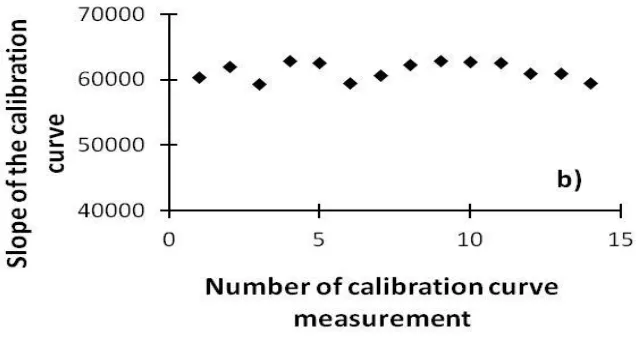
according to the concentration of hydrogen peroxide, giving quite reproducible slopes (Figure 3a). An average value of 61347 was calculated over fourteen calibration curves, with a maximum variation of ± 3.4 % (Figure 3b). Furthermore, we found that HRP-ABTS in PBS (solution 4) and H2O2 in HClO4
[image:6.596.165.436.320.484.2](solution 2) that serve for building the calibration curve could be stored at 6°C at least for a week and produce quite similar the calibration curves: slope changed from 60358 to 62013 (see supporting info S2).
Figure 2. The variation of Absorbance against time after the addition of 30 µl of H2O2 (solution 2) in 3
Figure 3: a) Calibration curve representing the variation of Absorbance against concentration of hydrogen peroxide b) Slopes for fourteen calibration curves.
3.2 Selectivity measurement by H2O2 assay on 4 and 2 electron ORR pathway materials
Figure 4 shows the integral of the chronoamperometry data as a function of time for 4 and 2 electrons ORR pathway electrodes: the bulk platinum, the CNT electrode and the CNT-AQ electrode.
Figure 4. Integral of the current of chronoamperogrammes for bulk Pt, CNT and CNT-AQ electrodes.
Every 30, 60 and at a maximum of 120 minutes a given volume of the electrolyte was collected for the different electrodes studied and submitted to spectrophotometric measurement for H2O2 amount
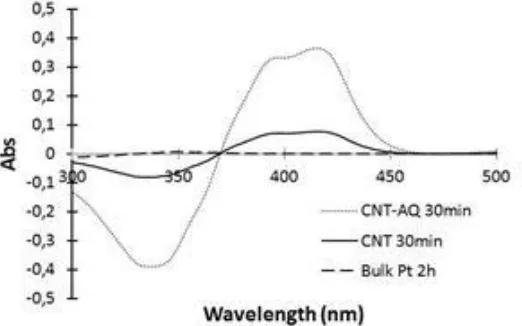
determination. Figure 5 reports examples of UV-Visible spectra showing: for the Pt bulk electrode the absence of H2O2 even after 2 hours ORR duration, and the production of H2O2 for the CNT and
[image:7.596.141.460.75.247.2] [image:7.596.155.421.407.571.2]
Figure 5. Absorption spectrum of the solution containing HRP (0.021 mg.ml-1) and ABTS (0.0144 mM) in PBS (pH=7.4) with 300 µl addition of the electrolyte for the electrodes CNT and CNT-AQ after 30 min of chronoamperometry measurement; and bulk Pt electrode after 2 h of chronoamperometry measurement. As mentioned in the case of figure 1 (see the text), the negative absorption at 340 nm is due to the decrease of ABTS concentration in the sample cell which is related to H2O2 consumption.
At the same time when the electrolyte was collected, the charge (QORR) corresponding to the
ORR was noted and the number of mole of electron (MTe-) was calculated (equation 7). From the total number of mole of H2O2 produced, the number of mole of electron corresponding to the 2e- pathway
way was calculated (equation 4) as well as the percentage of H2O2 produced by oxygen molecule
consumed (equation 5). The average number of electron transferred per oxygen molecule (n) can be obtained from (equation 6)
MTe-= QORR/F (7)
Figure 6 shows the average number of electron transferred per oxygen molecule (n) consumed as a function of the assay time. The percentage of H2O2 produced at each given time for each sample is
also reported. It is clearly seen that the bulk platinum electrode gave the expected 4 electron ORR reduction pathway, whatever the assay time. For CNT and CNT-AQ electrodes the expected 2 electron ORR pathway was found, but n becomes slightly higher than 2 when the assay time was higher than 30 minutes. We found that this is due to both stirring and oxygen bubbling and H2O2 disproponation
which induce a loss of H2O2. This has been shown by dedicated studies of H2O2 concentration stability
[image:8.596.168.429.75.238.2]
Figure 6. The number of electrons transferred per Oxygen molecule (n) and the percentage of H2O2
produced as a function of the time of chronoamperometry for Bulk Pt, CNT and CNT-AQ electrodes.
3.3 ORR Selectivity measurements on porous electrodes based on carbon nanotubes and organically capped platinum electrocatalyst.
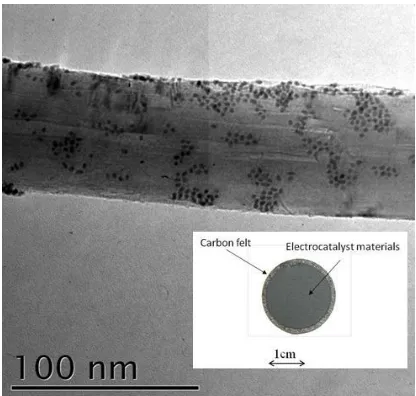
Figure 7 shows a macroscopic view of the electrode as well as a transmission electron microscopy image of the capped-Pt/CNT electrocatalyst in which the Pt nanoparticles are clearly observed at the CNT surface. The experiments were performed as presented above for the determination of n. First, Porous electrodes in which the mass ratio Pt/CNT was set at 20 % (Pt/CNT 20%) and the total Pt loading was 98.0 µg (38.6 µgPt.cm-2
) were studied as well as electrodes in which the mass ratio Pt/CNT was 3% (Pt/CNT 3%). For the latter different volumes of liquid dispersion were used to give electrodes with a total Pt loading of 5.4, 10.8, 16.2, 32.4 and 53.5 µg. Through these experiments our goal was first to show that the method presented in this paper to determine ORR selectivity can be used even on such original electrode structures.
[image:9.596.191.415.74.201.2] [image:9.596.194.402.510.708.2]
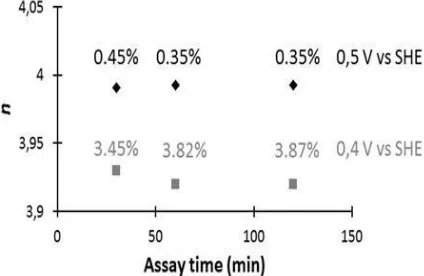
Second, experiments were performed to get preliminary results regarding the selectivity changes as a function of parameters such as the potential at which the ORR is performed, or the platinum loading in the electrode. Results related to the first point are shown in figure 8, in the same way as in figure 6, i.e. with thevalue of nand the percentage of H2O2 produced as a function of time.
For the Pt/CNT 20 % electrode it is seen that at 0.5 V vs. SHE n is very close to 4 (3.99) and that the percentage of H2O2 produced is between 0.35 and 0.45 %. When the potential is lowered by 0.1 V n is
slightly lower (3.92) and the percentage of H2O2 increase by a factor close to ten.
Figure 8. The number of electrons transferred per Oxygen molecule (n) and the percentage of H2O2
produced as a function of the time for chronoamperometry recorded on Pt/CNT 20% at 0.5 V vs. SHE and Pt/CNT 20% at 0.4 V vs. SHE.
Figure 9. The number of electrons transferred per Oxygen molecule (n) and the percentage of H2O2
produced as a function of Pt loading (µg/cm2) for Pt/CNT 3% electrodes (assay time 30min).
[image:10.596.195.407.223.361.2] [image:10.596.158.451.444.600.2]
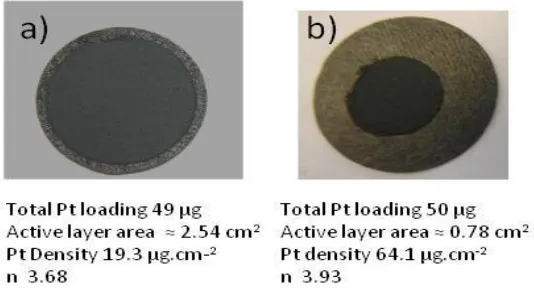
measurements for platinum based as well as non noble electrocatalyst materials 15-17. A strong advantage of our method is that it can be implemented directly on“real” porous electrode structures. In order to illustrate this point a last set of experiment was performed using Pt/NT 10% composite liquid dispersion as follows: 60 ml of the later were used to prepare two different electrodes using 30 ml for each one. The first electrode had a macroscopic active layer area of 2.54 cm2 and the second one (prepared using the same filtration device but using a mask to reduce the area of the active layer) had an area of 0.78 cm2. Therefore the catalyst composite structure is the same for both electrodes, the total amount of platinum is also the same (≈ 50 µgPt) but the platinum density is 19.3 µgPt.cm-2 for the first
electrode and 64.1 µgPt.cm-2
for the second one. The results for n are shown in figure 10, definitely indicating that the crucial parameter for selectivity is the electrocatalyst density.
Figure 10. Electrode prepared using the same NP/NT 10% mass ratio liquid dispersion, having the same total amount of Pt but different platinum density.
Finally, additional experiments were performed on Pt/CNT electrodes to check a possible effect of H2O2 heterogeneous disproponation that could disturb the selectivity measurement (see supporting
information S4). We found that the influence of the disproportionation of H2O2 on our measurements
is negligible and our data suggest that disproponation is related to the total amount of platinum rather than platinum density.
4. CONCLUSION
In this paper we reported an alternative method to the RRDE for the determination of the ORR selectivity. It has been validated using well known electrode materials for which the expected ORR selectivity is recorded. The method is simple, quite accurate and can be used whatever the feature of the electrode (shape, bulk, porous). Preliminary results on the ORR selectivity obtained on porous electrodes based on organically capped platinum electrocatalyst and carbon nanotubes as a function of various parameters (Pt loading, effect of potential on H2O2 production) have been recorded. The trends
[image:11.596.164.431.270.415.2]
ACKNOWLEDGMENTS
This work was supported by the following French agencies: Agence de l’Environnement et de la Maîtrise de l’Energie (ADEME) and Agence National de la Recherche (ANR) through its HPAC-2009 program (project “Facteur 10”).
References
1. N.M. Markovic, P.N. Ross Jr., Surf. Sci. Rep. 45 (2002) 117.
2. F. Jaouen, J. Herranz, M. Lefèvre, J-P. Dodelet, U.I Kramm, I. Herrmann, P. Bogdanoff, J. Maruyama, T. Nagaoka,; A. Garsuch,; J. R. Dahn, T. Olson, S. Pylypenko, P. Atanassov, E.A. Ustinov, ACS Applied Materials interfaces, 2009, 1, 8, 1623-1639
3. Electrocatalysis, Frontiers in Electrochemistry, Vol. 5, J. Lipkowski and P. N.Ross, Jr., Editors, VCH, New York (1997)
4. E. Yeager, Electrochim.Acta, 1984, 29, 1527-1537
5. R. E.Childs, W. G. Bardsley, Biochem. J. 1975 145, 93-103
6. E.N. Kadnikova, N.M. Kostic, Journal of Molecular Catalysis B : Enzymatic, 2002, 18, 39-48 7. M. Gara and R.G. Compton, new J. Chem. 2011, 10, 1039
8. M. Kullapere, J-M. Seinberg, U. Mäeorg, G. Maia, G.; D. J. Schiffrin, K. Tammeveski, Electrochim. Acta 2009, 54, 1961-1969
9. B. Sljukic, C. E. Banks, R. G. Compton, Iran J. Chem. Soc. 2005, 2, 1
10.Comprehensive Treatise of Electrochemistry, Vol 7: Kinetics and Mechanisms of Electrode Processes, ed. B. Conway, J. Bockris, E. Yeager, S. Khan, R. White, Plenum Press, New York, 1983, vol. 7, pp. 301-398
11.B. Baret, P-H. Aubert, M. Mayne-L’Hermite, M. Pinault, C. Reynaud, A. Etcheberry, H. Perez, Electrochim. Acta. 2009, 54, 5421
12.G. March, F. Volatron, F. Lachaud, X. Cheng, B. Baret, M. Pinault, A. Etcheberry, H. Perez, Electrochim. Acta. 2011, 56, 5151-5157
13.M. Pinault, V. Pichot, H. Khodja, P. Launois, C. Reynaud, M. Mayne-L’Hermite, Nano Lett. 2005, 5, 12, 2394
14.O. V. Ignatenko, I.G. Gazaryan, E.A. Mareeva, Biochem. J. 2000, 65, 583-587 15.N. Alonso-Vante, N. ChemPhysChem. 2010, 11, 13
16.E.J. Biddinger, D. Von Deak, D. Singh, H. Marsh, B. Tan, D.S. Knapke, U.S. Ozkan, J. Electrochem. Soc. 2011, 158, B402-B409
17.A. Bonakdarpour, M. Lefevre, R.Z. Yang, F. Jaouen, T. Dahn, J-P. Dodelet, J Electrochem. and Solid-State Lett. 2008, 11 (6), B105-B108
SUPPORTING INFORMATION:
S1: Preparation of the CNT-Aminoanthraquinone electrode
Scheme 1 : Diazotization of 2-aminoanthraquinone with NaNO2 in 0.5 M HCl
Second, a CNT electrode was formed by filtration of a given volume of dispersion of CNT in isopropanol on a carbon felt (Scheme 2), then the CNT electrode was immersed in 30ml of 0.5 M HCl electrolyte with 3ml of the AQ diazonium solution in 0.5 M HCl.
Scheme 2: porous electrode based on carbon nanotubes prepared by filtration on a carbon felt
Cyclic voltammetry was performed between 1.2 and -0.25 V vs. SHE at a sweep rate (v) of 100mVs-1 in argon saturated condition to perform the electrochemically assisted grafting at the carbon nanotube surface. The grafted CNT layer was then separated from the carbon felt by sonication of the electrode in isopropanol for 5 min. A filtration of the AQ-grafted CNT was performed on a new carbon felt. This process was repeated twice to remove any possibly ungrafted AQ. The combination of AQ with CNT was evidenced by cyclic voltammetry (HClO4 1M) on which the redox peak of AQ were
clearly observed (see below).
The curves are unchanged indicating the stability of the HRP-ABTS solution used for the H2O2 assay.
S3: Additional experiments aiming at the understanding of the decrease of n as a function of assay time for data related to 2 electron pathway electrode materials
These experiments were performed in order to get insights in the reasons for which the average number of electron determined using our method tends to increase with time when 2 electrons pathway electrodes were studied (figure 6 in the paper).
The increase observed for n as a function of the assay could be related to a decrease of H2O2
concentration in the electrolyte with time. The later point can be due to i) the electrochemical consumption of H2O2, and/or ii) the disproponation (homogenous or heterogeneous) of H2O2. To check
these points the electrochemical cell was filled with 30 ml HClO4 0.1M and an adapted amount of
H2O2 was added in order to obtain a concentration close to 3.2 10-5 M. Then the following experiments
were performed:
To address (i) two experiments were performed in which the electrolyte was continuously bubbled with argon and kept under stirring. In the first one a carbon nanotube based porous electrode (working electrode WE) was submitted to chronoamperometry and H2O2 concentration was monitored
as a function of time (scheme a, curve a): It was found (curve a) that the amount of H2O2 decreased
with time. The second experiment (scheme b, curve b) consisted in the same as the first one but without chronoamperometry. Identical trends for H2O2 concentration were observed in both
experiments (see below) thus indicating that the decrease on the H2O2 concentration is not induced by
To address (ii) two additional experiments were performed consisting in H2O2 concentration
monitoring as a function of time under argon bubbling and mechanical stirring: in the first one (scheme c, curve c) only the platinum counter electrode used for chronoamperometry was immersed in the electrolyte in the second one the electrolyte only was in the cell (scheme d, curve d). Curves b) and c) revealed the same trends while curve d) showed a lower decrease for the H2O2 concentration.
Therefore it is concluded that the loss of H2O2 is due in part to H2O2 disproponation on platinum
counter electrode (CE) and to a lesser extent to argon bubbling and stirring (may be reflecting homogeneous disproponation in such experimental conditions)
Finally because the selectivity determination is performed under O2 bubbling and continuous
stirring a last experiment was performed (scheme e, curve e), in which H2O2 concentration was
monitored as a function of time in such conditions. The data from curve e) were used to correct the value of n as shown below for CNT and CNT-AQ electrodes.
S4: Checking the impact of heterogeneous H2O2 disproponation for Pt/NT based porous electrodes.
Because the H2O2 concentration in the electrolyte may vary due to heterogeneous
disproponation when Pt loaded electrodes are involved the amount of H2O2 measured could be
under-estimated. Therefore, experiments reported below were performed in order to evaluate possible need for the correction of n due to the loss of the H2O2.
First, two electrochemical cells were filled with 30 ml HClO4 0.1M under continuous argon
bubbling and mechanical stirring and an adapted amount of H2O2 was added in order to obtain a
concentration close to 3.0 10-5 M. In the first cell a Pt/CNT 10% electrode (19.29µg.cm-2) was connected to the potentiostat and submitted to chronoamperometry at 0.5 V vs SHE. The H2O2
The figure above shows that the decrease of H2O2 concentration over time is only due to the
heterogeneous disproponation of H2O2 and that there is no significant effect due to the polarization of
the electrode on the H2O2 loss. Using the data shown in S4, we can correct the value of n for our
Pt/CNT 10% electrode (19.3µg.cm-2
), (this even if the loss is over estimated because we have seen that the H2O2 loss is lower under O2 than Argon). It is found that this correction has negligible effect on the
results, the value of n change from 3.68 to 3.64 after the correction.
In a third experiment the heterogeneous disproponation was recorded for the two electrodes shown in figure 10 which were prepared using the same Pt/NT 10% liquid dispersion, and the same volume of the later (30mL). These electrodes had thus the same total platinum loading (≈ 50 µg.cm-2) but differ from each other by the macroscopic area of the active layer formed on the carbon felt and therefore differ by their platinum density (19.3µg.cm-2 and 64.1 µg.cm-2
). Scheme b and c picture these experiments in which the H2O2 was monitored over time. Curves b and c (see below) indicates that the
H2O2 disproponation was identical in both cases. Therefore the heterogeneous disproponation of H2O2