Int. J. Electrochem. Sci., 11 (2016) 5448 – 5458, doi: 10.20964/2016.07.46
International Journal of
ELECTROCHEMICAL
SCIENCE
www.electrochemsci.orgShort Comminication
Phase Transitions Observations During the Direct Electrolysis
of Ilmenite to Ferrotitanium in CaCl
2-NaCl Melt
Zhongren Zhou1,2, Yixin. Hua1,2,*, Cunying. Xu1,2, Jian. Li1,2, Yan. Li1,2, Qibo. Zhang1,2, Li. Xiong1,2, Yadong. Zhang1,2
1
Faculty of Metallurgical and Energy Engineering, Kunming University of Science and Technology, Kunming 650093, PR China
2
State Key Lab of Complex Nonferrous Metal Resources Clean Utilization, Kunming 650093, PR China
*
E-mail: yxhua@kmust.edu.cn
Received: 18 April 2016 / Accepted: 23 May 2016 / Published: 4 June 2016
The electrochemical reduction method is successfully used to prepare porous ferrotitanium alloys from ilmenite by using equal-molar CaCl2-NaCl eutectic as electrolyte, molybdenum rod as cathode and
graphite as anode at 973K with cell voltage of 3.0V under inert atmosphere. The intermediate products formed in the electrochemical reduction process are analyzed by cyclic voltammetry and constant cell voltage electrolysis in the two electrodes system together with XRD, EDS analysis and SEM observation. It is demonstrated that the electrochemical reduction of ilmenite is a stepwise process since the intermediates CaTiO3, Fe2Ti and Ti are observed in the products partially reduced. In the
electrochemical reduction process, the reduction of FeTiO3 firstly gives rise to the formation of Fe and
CaTiO3 mixtures, which are formed at the interface between the ilmenite pellet and the electrolyte and
are agglomerated on the surface of the samples. The intermediate CaTiO3 will be further reduced in the
presence of solid Fe to form ferrotitanium alloys as well as directly deoxidized to titanium metal, which is then combined with Fe2Ti to form ferrotitanium. This reduction path is in good agreement
with the cyclic voltammetry analysis. Experimental results also show that the reduced metallic grains are interconnected on the surface of the unreduced CaTiO3 particles, indicating that the metallic matrix
helps the electron transfer into the oxide inside.
Keywords: Ferrotitanium, ilmenite, electrolysis, cyclic voltammetry.
1. INTRODUCTION
concentrates such as ilmenite ores or by re-melting the mixtures of iron and titanium at a proper ratio. However, these methods have many disadvantages such high energy consumption, low quality of products and so on. For example, carbothermic process should be operated in an electric arc furnace at extremely high temperatures, which leads to not only an extensive energy consumption but also large amount of CO2 emissions. The aluminothermic reduction and re-melting method, however, are
regrettably high energy consumption also. Thus, developing both environmentally friendly and energy saving methods seem to be urgent for the production of ferrotitanium alloy.
Over years, many efforts have been focused on the electrometallurgical techniques to produce and purify metals [6-9]. Of the existing electro-refining techniques, the FFC process has been studied worldwide and applied in the successful production of various metals and alloys, such as Nb, Ti, Tb, Zr, TbFe2, FeTi, CeCo5, TiMo and ZrSi alloys [7-35]. The mechanism of this process can be
summarized as follows: first, experiments are carried out in fused alkaline chloride in the two electrodes system with the metallic oxide pellets as cathode and graphite as anode; second, the oxide pellets are deoxidized at the cathode and the released oxygen ions are diffused in the molten salt and then removed as O2, CO or CO2 gas at the anode. Recently, the electrochemical techniques have been
applied in the electrochemical reduction analysis and provide reliable evidences particular in the mechanism and kinetics properties of electrode reactions. The classical electrochemical system is composed of three electrodes [11-22]: the molybdenum metallic cavity electrode (MCE) as the working electrode, the graphite crucible as the counter electrode and the Ag/AgCl [36] or Ag wire as the reference electrode. Other electrodes can be also found in literatures [8,37].
The FFC process provides a promising technique for the extraction of FeTi alloys from their oxides. Researchers have successfully prepared FeTi alloys by this method with the pretreated ferro-titanium oxide processor as cathode, graphite as anode and CaCl2 as electrolyte [25,38-40]. Similar
results can be also tracked by the SOM process [41]. The electrochemical reduction mechanism, however, reaches few attentions, especially the intermediate phase transitions as well as the electrochemistry properties could be hardly found in the present literatures. Moreover, it has been found that the intermediate CaTiO3 was always formed during the reduction. The reducing path of
CaTiO3 is needed more detailed researches to clarify the reduction mechanism.
In this communication, experiments are carried out to study the electrochemical behavior and the phase transitions in the electrochemical reduction of ilmenite by cyclic voltammetry and constant cell voltage electrolysis. Moreover, to study the electrochemical reduction process of ilmenite could further enrich and consummate the reduction mechanism and contribute to the development of the electrochemical extraction of metallic oxides technique in molten salts.
2. EXPERIMENTAL
2.1 Preparation of CaCl2-NaCl Eutectic Electrolyte
The as-received analytical grade anhydrous CaCl2 (73g, purity >97 mass%) and NaCl (32g,
63mm, and 75mm in depth) and then transferred into a vertical quartz tube reactor under argon (analytical grade, >99.999%). The mixture was heated to 973K that was higher than the eutectic point of 777K. Pre-electrolysis was carried out at 2.8V for 20h between the graphite anode (99.9% in purity, dia. 6mm, 80mm in length) and molybdenum plate (10mm×10mm) cathode in order to remove redox-active impurities remained in the molten salt.
2.2 Cyclic voltammetry analysis
Cyclic voltammetry analysis was recorded by using a computer controlled CHI760D Electrochemical System (Shanghai Chenhua, China). The three electrodes system containing the metallic cavity electrode (MEC) [42] filled with/without FeTiO3 powder as the working electrode, a
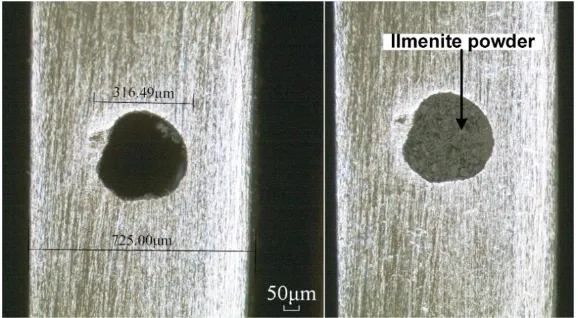
graphite stick (99.9% in purity, dia. 2mm, 100mm in length) as the counter electrode, and a Ag wire (dia. 0.5mm, 50mm in length) as the quasi-reference electrode. Generally, the metallic cavity electrode, named widely as the MCE, has been employed comprehensively in the cyclic voltammetry analysis [43-48] due to at least two advantages. One is the decrease of the iR drop and the other is the consequently enhancement of the CV measurements sensitivity [6]. In the present study, the MCE was fabricated by high-speed mechanical drilling a ~0.35mm circular hole at the end of molybdenum foil (0.5mm thickness, ~0.7mm width and ~100mm in length). The foil was then polished on the metallographic sandpaper, boiled in concentrated NaOH for another 10 minutes, washed in distilled water and dried in air. Then, FeTiO3 powder (particle size ~50 micrometers) was manually filled into
[image:3.596.154.443.482.641.2]the MCE hole by repeatedly finger-pressing the powder on both sides of the foil, and wiped off carefully any powder left on the surface of the foil. The corresponding optical photographs for MCE with/without FeTiO3 powder, were shown in Fig. 1.
Figure 1. The optical photographs of MCE
2.3 Constant cell voltage electrolysis in the two electrodes system
at constant cell voltage of 3.0V. The synthetic FeTiO3 powder [49] (~2.0g) mixed thoroughly with
ammonium bicarbonate (NH4HCO3, 1g, served as pore-forming agent) was pressed (15MPa) in a
columnar module for 5 minutes in order to form a pellet of 13mm in diameter and 3mm in thickness. The mixed powder was then sintered in a numerical controlled tube furnace in argon inert atmosphere at 1173K for 3h. Finally, the sintered pellet was wrapped with Mo wires to assemble as the cathode.
2.4 Characterization of samples
After terminations of electrolysis at prescribed periods, the cathode was removed from the cooled molten salt, and then washed with distilled water in an ultra-phonic water bath to dissolve the solidified salts. The reduced samples were then examined by X-ray diffraction (Version. D/max-2200pc) with Cu Ka radiation at a scan rate of 10°/min in the range of 2θ=10~90°. The morphology, particle size and elemental constituents of the reduced samples were analyzed by SEM and EDS (XL 30ESEM TMP model).
3. RESULTS AND DISCUSSION 3.1 Cyclic voltammetry
Figure 2. Cyclic voltammogram of the MCE without and with (solid line) FeTiO3 powder of the first
to third cycles in a smaller negative potential range (the first cycle: 0 to -1.7V, the second and the third cycle: 0 to -1.6V) at a scan rate of 100 mV/s.
The electro-reduction behavior of FeTiO3 powder in the pre-electrolyzed fused CaCl2-NaCl
[image:4.596.155.444.408.620.2]
C6/A6) due to the deposition and re-dissolution of Ca and/or Na metal, it can be seen from Fig. 2 that the first cycle of the FeTiO3 powder (bold solid line) presents at least four reduction peaks that is
started by the decomposition of ilmentie, labeled as C1 (-0.72V vs Ag), and then followed by another three small but detected current peaks of C2 (-1.15V), C3 (-1.4V) and C4 (-1.58V) before the deposition of Ca and/or Na metal. This result indicates that the electro-reduction of FeTiO3 is a
stepwise process before the final product FeTi formed. In the second cycle, however, the current curves can be hardly found before the negative potential limits (-1.6V), indicating the irreversibility of the deoxidization of ilmenite on the continuous CVs. After the third cycle of FeTiO3-MCE in molten
salt, the recorded currents are close to background values, suggesting the deoxidization process is almost completed. Thus, based on the above analysis, the electrochemical deoxidization of ilmenite goes through at least four steps, the intermediates are analyzed by the next electrolysis experiments.
3.2 Constant Voltage Electrolysis in a Two-Electrode Cell
In order to better understand the electrochemical reduction process of ilmenite, experiments were conducted with the constant cell voltage of 3.0V that was below the thermodynamic decomposition potentials of CaCl2 (3.33V vs S.H.E) and NaCl (3.36V vs S.H.E) eutectic for 5min, 1h,
2h, 8h, 16h, and 20h at 973K. The intermediate products are analyzed by XRD in Fig. 3 and the inter-reactions with the theoretical electrode potentials (vs S.H.E) are listed in Table 1 also. It shows clearly that the intermediate products are Fe and CaTiO3 mixtures reduced for 5 minutes, suggesting that
FeTiO3 particles are firstly electro-deoxidized to Fe and CaTiO3 via reaction 1 in the initial electrolysis
period. In the mixtures reduced for 1h and 2h, Fe2Ti phase is detected. This result demonstrates that
the intermediate CaTiO3 formed is further reduced near the Fe phase via reaction 2 to obtain Fe2Ti
phase.
It is necessary to note that the initial transformation mechanism of FeTiO3 to Fe/CaTiO3 as well
as the following formation of Fe2Ti through the further deoxidization of CaTiO3 is different with the
previous findings [14, 39-41]. In their studies, two steps are needed to form Fe-Ti alloys. The first step is the deoxidization of FeTiO3 to form Fe, TiO2, and O2-, and the spontaneous combination of them in
electrolytes to form CaTiO3; the second step is the deoxidization of CaTiO3 to produce Ti metals,
which will further react with Fe metals to form Fe-Ti alloys, such as Fe2Ti and FeTi. However, the
main problem is the intermediate phases of TiO2 could be hardly detected in their XRD results and the
reduction kinetics of CaTiO3 to Ti metals is very slow. Actually, we believe that CaTiO3 phases are
formed directly with Ca2+ participated by reaction 1 at -0.72V vs Ag. After that, CaTiO3 will be
preferentially reduced on the basis of Fe enriched phases to form Fe2Ti by reaction 2. This result is
also evidenced by the products after 2h of electrolysis.
As furthering the electrolytic time for 8h, there`s still some CaTiO3 phases are detected. The
Table 1. The intermediates detected by XRD reduced for different time at cell voltage of 3.0V and the corresponding cathodic electrode reactions with the theoretical potentials at 973K as well as the derived potentials on the CVs.
Electrolysis time
Phases detected by XRD analysis
Possible cathodic electrode reactions
5min Fe, CaTiO3, FeTiO3, NaCl
FeTiO3(s)+Ca2+
+2e-=CaTiO3(s)+Fe(s)
1 1h Fe, CaTiO3, Fe2Ti
CaTiO3
(s)+2Fe(s)+4e-=Fe2Ti(s)+Ca2++3O2- 2
2h Fe, CaTiO3, Fe2Ti CaTiO3(s)+Fe(s)+4e-=FeTi(s)+
Ca2++3O2- 3
8h CaTiO3, Fe2Ti, FeTi,
Ti CaTiO3(s)+4e-=Ti(s)+ Ca
2+
+3O2- 4 16h Fe2Ti, FeTi, Ti
Fe2Ti(s)+Ti(s)=2FeTi(s) 5
20h FeTi, Fe2Ti
Moreover, the intermediate CaTiO3 can be also deoxidized to form titanium metal via reaction
4, as is detected by XRD analysis in Fig. 3d and e. When electrolysis time reaches to 16h, CaTiO3 is
found to be reduced completely by reactions 2-4 to form FeTi, Fe2Ti and Ti. In this period, the reduced
Fe2Ti and Ti are combined chemically to form FeTi particles by reaction 5. As electrolysis for 20h, the
products contain the main FeTi phase and minor Fe2Ti phase.
[image:6.596.171.428.434.712.2]
Thus, from the XRD analysis in Fig. 3 and Table 1, it can be concluded that the electrochemical reduction of ilmenite is a stepwise process; particularly when concerning the reduction of perovskite, which is a definite intermediate product during the electrolysis of ilmenite in CaCl2
-NaCl eutectic, three main complex procedures containing Fe2Ti, FeTi and Ti formed take place at 3.0V
of electrolysis at 973K. The result is in good agreement with the electrochemical analysis in Fig. 2, that the reduction of ilmenite undergoes four intermediate procedures and thus, the recorded four peaks C1 (-0.72V vs Ag), C2 (-1.15V), C3 (-1.4V) and C4 (-1.58V) can be referred to the formation of Fe/CaTiO3, Fe2Ti, FeTi, and Ti, respectively.
3.3 Electron microscopy
Figure 4. SEM images in partially reduced FeTiO3 particles removed at specific intervals during the
[image:7.596.149.443.264.702.2]
The mixtures partially reduced for different electrolytic time with cell voltage of 3.0V at 973K were washed, grinded and then examined with SEM and EDS. The corresponding secondary electron images and EDS identified results of the samples are shown in Fig. 4 and Table 2. It can be seen from Fig. 4a that the new mixtures partially reduced for just 5 minutes are found to be agglomerated outside the dark gray ilmenite phase.
By EDS analysis, the composition of the new mixtures is 25.06 mass% Fe, 22.91 mass% Ti, 14.11 mass% Ca and 37.92 mass% O; and that of the dark gray ilmenite phase is 14.43 mass% Fe, 33.80 mass% Ti, 5.13 mass% Ca and 45.02 mass% O. This result demonstrates that the electrochemical reduction takes place first at the interface between the ilmenite pellet and the electrolyte. In the mixture reduced for 1h, the particle size of the reduced sample is observed to decrease to less than 10 micrometers, as seen in Fig. 4b. EDS analysis shows a mixture of 80.18 mass% of Fe and 6.6 mass% of Ti on the surface of the reduced particle, thus this mixture can be regarded as Fe2Ti and Fe enriched phases. Table 2 lists the detailed data by EDS analysis. The 6.6
mass% of titanium embraced in the iron enriched phase implies that the perovskite is reduced to form Fe2Ti on the basis of iron substrate via reaction 2, while the rest of perovskite phase is found to
disperse with cubic crystal structures in the pellet, which is shown in Fig. 4b. As prolonging the electrolysis time for 2h, some dense structures containing 41.66 mass% Fe, 24.69 mass% Ti in fine particles and 25.49 mass% Ti, 31.88 mass% Ca, 33.42 mass% O in larger bulk are found in Fig. 4c. The dense structures, however, are not easily decomposed in spite of the large overpotentials versus Ag.
Table 2. XRD phases detected at various electrolysis periods and the corresponding elemental compositions from Fig. 2.
Sample number Electrolysis time Detected area EDS analysis
Fe mass% Ti mass% Ca mass% O mass%
a 5min a1 25.06 22.91 14.11 37.92
a2 14.43 33.80 5.13 45.02
b 1h b1 80.18 6.60 8.44 3.41
b2 20.20 26.6 28.44 23.41
c 2h c1 41.66 24.69 15.49 8.78
c2 9.91 25.49 31.88 33.42
d 8h
d1 42.44 41.94 9.95 9.33
d2 36.57 24.19 15.49 12.41
d3 1.37 40.70 33.37 13.76
e 16h full area 49.27 46.88 0.2 3.85
f 20h full area 50.77 48.38 undetected 0.84
According the XRD analysis in Fig. 3, the decomposition of CaTiO3 are occurred in the
presence of Fe phases, indicating the pre-formed Fe actually decrease the decomposition of CaTiO3, as
a result, Fe2Ti and FeTi are directly produced. After electrolyzed for 8h, more ferrotitanium alloy
[image:8.596.24.573.480.637.2]
porous particles to be FeTi with 3.43 mass% O. Comparing the oxygen content after reduced for 8h and 16h, the furthering 8h of electrolysis results in the removal of very little oxygen content. This demonstrates the slow reduction kinetics during the deoxidization process, that is, the diffusion of O 2-would be a limiting step in the reduction process. When reduction time reaches to 20h, the SEM image in Fig. 4f shows a porous structure of FeTi with 0.17 mass% O in 20 micrometers particle size, indicating a complete reduction of ilmenite via the heterogeneous reactions 2-5 by electrochemical deoxidization method.
4. CONCLUSIONS
(1) Ferrotitanium alloys have been successfully prepared from ilmenite by the electrochemical reduction process, using equal-molar CaCl2-NaCl metls as electrolyte, ilmenite pellet tied by
molybdenum rod as cathode and graphite as anode at 973K with cell voltage of 3.0V that is below the decomposition of molten salt.
(2) Cyclic voltammetry and constant cell voltage electrolysis in the two electrodes system together with XRD, EDS analysis and SEM observation suggest that the electrochemical reduction of ilmenite is a stepwise process rather than a single one. During the reduction, FeTiO3 is first
electrochemically reduced to Fe/CaTiO3 mixtures. The intermediate CaTiO3 is further reduced
preferentially in the presence of solid Fe to form ferrotitanium alloys (Fe2Ti and FeTi) as well as
directly deoxidized to titanium metal, which is then combined with Fe2Ti to form ferrotitanium.
(3) The micromorphology evolutions of the reduced samples have been addressed. From the SEM observation, it can be seen that the electrochemical reduction takes place first at the interface between ilmenite and the electrolyte. As the electrolysis process inward, fine but dense structures containing Fe2Ti and CaTiO3 mixtures have been found. The dense particles could block the diffusion
path of O2- and eventually decrease the deoxidization rate. Thus, the pores presented in the reduced particles play an important role for the transport of O2- in the deoxidization process.
(4) The removal value of oxygen shows a slow deoxidization rate in the whole process. This demonstrates that the reduction kinetics is strongly depended on the O2- diffusion rate.
ACKNOWLEDGEMENTS
The authors acknowledge the financial support of the National Natural Science Foundation of China (Project Nos.51274108, 21263007) and Talents Cultivation Foundation of Kunming University of Science and Technology (KKSY201252081).
References
1. M. Panigrahi, R.K. Paramguru, R.C. Gupta, E. Shibata and T. Nakamura, High Temp. Mat. Pr-Isr.
29 (2010) 495-514.
2. B. Sakintuna, F. Lamari-Darkrim and M. Hirscher, Int. J. Hydrogen Energy 32 (2007) 1121-1140.
3. M. Panigrahi, E. Shibata, A. Iizuka and T. Nakamura, Electrochim. Acta 93 (2013) 143-151.
4. M. Panigrahi, A. Iizuka, E. Shibata and T. Nakamura, J. Alloy. Compd. 550 (2013) 545
(1973).
6. A.M. Abdelkader, K. Tripuraneni Kilby and A. Cox, D.J. Fray, Chem. Rev. 113 (2013) 2863-2886.
7. W. Xiao, X. Jin, Y. Deng, D. Wang, X. Hu and G.Z. Chen, Chemphyschem 7 (2006) 1750-1758.
8. X. Shi, X. Jin, W. Xiao, X. Hou, H. Chen and G.Z. Chen, Chem-Eur. J. 17 (2011) 8562-8567.
9. Y. Xu, H. Jiang, X. Li, H. Xiao, W. Xiao and T. Wu, J. Mater. Chem. A 2 (2014) 13345-13351.
10. K. Chen, Y. Hua, C. Xu, Q. Zhang, C. Qi and Y. Jie, Ceram. Int. (2015).
11. L. Dai, S. Wang, Y. Li, L.Wang and G. Shao, T. Nonferr. Metal. Soc. 22 (2012) 2007-2013.
12. B.A. Glowacki, D.J. Fray, X.Y. Yan and G.Z. Chen, Physica. C 387 (2003) 242-246.
13. X.Y. Yan, M.I. Pownceby, M.A. Cooksey and M.R. Lanyon, Miner. Process. Extr. M. 118 (2009)
23-24.
14. G.Z. Chen, Proc. Third Int. Slag Valorization Symp., Leuven, Belgium, (2013), 217-233.
15. B. Jackson, M. Jackson, D. Dye, D. Inman and R. Dashwood, J. Electrochem. Soc. 155 (2008)
E171-E177.
16. R. Bhagat. M. Jackson, D. Inman and R. Dashwood, J. Electrochem. Soc. 155 (2008) E63-E69.
17. Q. Wang, J. Song, G. Hu, X. Zhu, J. Hou, S. Jiao and H. Zhu, Metall. Mater. Trans. B 44 (2013)
906-913.
18. K.T. Kilby, S. Jiao and D.J. Fray, Electrochim. Acta 55 (2010) 7126-7133.
19. G.Z. Chen. D.J. Fray and T.W. Farthing, Metall. Mater. Trans. B 32 (2001) 1041-1052.
20. B.A. Glowacki, D.J. Fray, X.Y. Yan and G.Z. Chen, Physica. C 387 (2003) 242-246.
21. G.Z. Chen and D.J. Fray, Miner. Precess. Extr. M. 115 (2006) 49-54.
22. X.Y. Yan and D.J. Fray, Metall. Mater. Trans. B 33 (2002) 685-693.
23. C. Schwandt, D.T.L. Alexander and D.J. Fray, Electrochim. Acta 54 (2009) 3819-3829.
24. G. Qiu, D. Wang, M. Ma, X. Jin and G.Z. Chen, J. Electroanal. Chem. 589 (2006) 139-147.
25. M. Ma, D. Wang, X. Hu, X. Jin and G.Z. Chen, Chem-Eur. J. 12 (2006) 5075-5081.
26. D. Wang, G. Qiu, X. Jin, X. Hu and G.Z. Chen, Angew. Chem. Int. Edit. 45 (2006) 2384-2388.
27. J, Peng, K. Jiang, W. Xiao, D. Wang, X. Jin and G.Z. Chen, Chem. Mater. 20 (2008) 7274-7280.
28. L. Rong, R. He, Z. Wang, J. Peng, X. Jin and G.Z. Chen, Electrochim. Acta 147 (2014) 352-359.
29. X. Kang, Q. Xu, X. Yang and Q. Song, Mater. Lett. 64 (2010) 2258-2260.
30. M. Lee, J. Noh, K. Kim and J. Lee, Phys. Met. Metallogr. 115 (2014) 1356-1361.
31. J. Song, Q. Wang, M. Kang and S. Jiao, Novel Synthesis of High Pure Titanium Trichloride in
Molten CaCl2, Int. J. Electrochem. Sci, 10 (2015) 919-930.
32. T.J. Kim, D.H. Ahn, S.W. Paek and Y. Jung, Int. J. Electrochem. Sci, 8 (2013) 9180.
33. C.H. Lee, D.Y. Kang and M.K. Jeon, ddition Effect of Fluoride Compounds for Zr Electrorefining
in LiCl-KCl Molten Salts, Int. J. Electrochem. Sci, 11 (2016) 566-576.
34. Y. Cai, H. Liu, Q. Xu, Q. Song, H. Liu and L. Xu, Electrochemical Behavior of Zirconium in an
in-situ Preparing LiCl−KCl−ZrCl4 Molten Slat, Int. J. Electrochem. Sci, 10 (2015) 4324-4334.
35. Q. Song, Q. Xu, S. Li, Y. Qi, Z. Ni and K. Yu, Direct Electrolytic Preparation of RENi5-xAlx
(RE=La, Ce, Pr, and Nd) from Rare-Earth Oxides in Molten CaCl2-NaCl, Int. J. Electrochem. Sci,
10 (2015) 175-184.
36. P. Gao, X. Jin, D. Wang, X. Hu and G.Z. Chen, J.Electroanal. Chem. 579 (2005) 321-328.
37. W. Xiao, X. Jin, Y. Deng, D. Wang and G.Z. Chen, J. Electroanal. Chem. 639 (2010) 130-140.
38. X. Liu, M. Hu, C. Bai and X. Lv, High. Temp. Mater-Isr. 33 (2014) 377-383.
39. X.L. Zou, X.G. Lu, W. Xiao and C.Y. Lu, Adv. Mater. Res. 937 (2014) 58-63.
40. M. Hu, C. Bai. X. Liu, X.I. Lv and J. Du, J. Min. Metall. B 47 (2011) 193-198.
41. X.L. Zou, X.G. Lu, W. Xiao, S.L. Gu and B. Shen, Appl. Mech. Mater. 548 (2014) 172-176.
42. K. Jiang, X. Hu, M. Ma, D. Wang, G. Qiu, X. Jin and G.Z. Chen, Angew. Chem. Int. Ed. 45 (2006)
428-432.
43. X.Y. Yan and D.J. Fray, J. Electrochem. Soc. 152 (2005) D12-D21.
44. W. Xiao, X. Jin and G.Z. Chen, J. Mater. Chem. A 1 (2013) 10243-10250.
1495.
46. T. Wu, W. Xiao, X. Jin, C. Liu, D. Wang and G.Z. Chen, Phys. Chem. Chem. Phys. 10 (2008)
1809-1818.
47. K. Dring, R. Dashwodd and D. Inman, J. Electrochem. Soc. 152 (2005) E104-E113.
48. W. Xiao and D. Wang, Chem. Soc. Rev. 43 (2014) 3215-3228.
49. J. Ru, Y. Hua, C. X, J. Li, Y. Li, D. Wang, K. Gong, R. Wang and Z. Zhou, Ceram. Int. 40 (2014)
6799-6805.