This is a repository copy of
Processing Parameter Effects on Residual Stress and
Mechanical Properties of Selective Laser Melted Ti6Al4V
.
White Rose Research Online URL for this paper:
http://eprints.whiterose.ac.uk/132136/
Version: Published Version
Article:
Ali, H., Ghadbeigi, H. and Mumtaz, K.A. orcid.org/0000-0001-8083-1661 (2018)
Processing Parameter Effects on Residual Stress and Mechanical Properties of Selective
Laser Melted Ti6Al4V. Journal of Materials Engineering and Performance, 27 (8). pp.
4059-4068. ISSN 1059-9495
https://doi.org/10.1007/s11665-018-3477-5
[email protected] https://eprints.whiterose.ac.uk/ Reuse
This article is distributed under the terms of the Creative Commons Attribution (CC BY) licence. This licence allows you to distribute, remix, tweak, and build upon the work, even commercially, as long as you credit the authors for the original work. More information and the full terms of the licence here:
https://creativecommons.org/licenses/
Takedown
If you consider content in White Rose Research Online to be in breach of UK law, please notify us by
Processing Parameter Effects on Residual Stress
and Mechanical Properties of Selective Laser Melted
Ti6Al4V
Haider Ali, Hassan Ghadbeigi, and Kamran Mumtaz
(Submitted December 14, 2017; in revised form April 24, 2018; published online July 17, 2018)
Selective laser melting (SLM) process is characterized by large temperature gradients resulting in high levels of residual stress within the additively manufactured metallic structure. SLM-processed Ti6Al4V yields a martensitic microstructure due to the rapid solidification and results in a ductility generally lower than a hot working equivalent. Post-process heat treatments can be applied to SLM components to remove in-built residual stress and improve ductility. Residual stress buildup and the mechanical properties of SLM parts can be controlled by varying the SLM process parameters. This investigation studies the effect of layer thickness on residual stress and mechanical properties of SLM Ti6Al4V parts. This is the first-of-its kind study on the effect of varying power and exposure in conjunction with keeping the energy density constant on residual stress and mechanical properties of SLM Ti6Al4V components. It was found that decreasing power and increasing exposure for the same energy density lowered the residual stress and improved the % elongation of SLM Ti6Al4V parts. Increasing layer thickness resulted in lowering the residual stress at the detriment of mechanical properties. The study is based on detailed experimental analysis along with finite element simulation of the process using ABAQUS to understand the underlying physics of the process.
Keywords additive manufacturing, cooling rate, finite element, residual stress, layer thickness, mechanical properties, selective laser melting, Ti6Al4V
1. Introduction
Considerable research has focused on the effect of in-process parameters on residual stress buildup in SLM compo-nents (Ref1-22). SLM process can be approximated by stacking of thousands of welds together; therefore, it is really important to understand the dynamics of a single weld or in the terminology of SLM a single melt pool. Melt-pool size increases with increasing energy input (Ref23). Laser power has a more pronounced effect on the maximum temperature than exposure time (Ref23). The maximum power depends on the laser hardware. Lowering the laser power reduces the maximum temperature of a melt pool (Ref23-25) and also leads to a smaller melt pool, which results in higher cooling rates (Ref24). High laser power results in lower deformation due to residual stress (Ref11), while Alimardani et al. (Ref25) reported lower residual stresses for lower laser power.
The effect of scan speed is the opposite of power. Reducing scan speed leads to lower temperature gradients (Ref7), lower cooling rates (Ref24), lower residual stresses (Ref26) and reduced deformation, while higher scan speeds produce increased cooling rate and leads to increased cracking (Ref27). Pohl et al. (Ref10) reported lower deformation for higher scan speed. Combined effect of varying power and
exposure together keeping energy density constant on porosity and in turn on mechanical properties was studied by Andrei et al. (Ref28). For a constant energy density, lower power and higher exposure combination led to an increase in porosity and thus reduction in yield strength of 316L SLM samples (Ref28). To date no prior study has reported the effect of constant energy density with varying power and exposure together on residual stress and mechanical properties in SLM Ti6Al4V parts. This study investigates the effect of varying power and exposure while keeping energy density constant on residual stress and mechanical properties of SLM Ti6Al4V components. Powder particle size determines the lower limit of the layer thickness, while the need for melt-pool penetration into underlying layers determines the upper limit. Larger layer thicknesses can increase productivity at the detriment of geometrical resolution, as well as roughness of side surfaces. It has been reported (Ref 12, 14, 18) that increasing layer thickness results in reduced residual stresses due to the reduction in cooling rate. According to Kruth et al. (Ref18), for the same energy density doubling the layer thickness reduced the curling angle of a bridge geometry by 6%. According to Roberts et al. (Ref17), doubling the layer thickness reduced the residual stress by 5%. According to Zaeh et al. (Ref14), increasing the layer thickness by 2.5 times decreased the deformation of the ends of a T-shaped cantilever by 82%. Sufiiarov et al. (Ref29) reported an increase in yield strength and a decrease in elongation for decreasing layer thickness in IN718 SLM parts. Guan et al. (Ref30) reported that layer thickness had no effect on the mechanical properties of 304 stainless steel SLM components. Delgado et al. (Ref31) reported that increasing layer thickness had a negative effect on the mechanical properties of AISI 316L SLM components. Parts were created with different layer thicknesses using the same parameters (Ref12,14,17,18,29-31), optimized for one
Haider Ali, Hassan Ghadbeigi,andKamran Mumtaz, Department of Mechanical Engineering, University of Sheffield, Sheffield, UK. Contact e-mail: [email protected].
JMEPEG (2018) 27:4059–4068 ÓThe Author(s)
layer thickness. From the published work, the effect of layer thickness on residual stress and mechanical properties is not well understood.
This work presents a comprehensive study on the effect of varying power and exposure in conjunction with maintaining energy density constant on residual stress buildup and mechan-ical properties of SLM Ti6Al4V parts. This work studies the effect of layer thickness on residual stress and mechanical properties by individually optimizing the process parameters for each layer thickness. FEA simulation is used in combination with experimental trials to understand the underlying phenom-ena associated with the residual stress buildup and the trend in mechanical properties of SLM Ti6Al4V samples.
2. Experimental Methodology
2.1 Material and Processing Parameters
The composition of Ti6Al4V-ELI powder from Technik Spezialpulver (TLS) used in this work can be found in the work by Ali et al. (Ref21). This work was carried out on the Renishaw AM250 machine using the process parameters presented in Table1.
2.2 Density and Microstructure
Density and microstructure for all test cases shown in Table2 and 3 were analyzed based on the methodology presented in the work by Ali et al. (Ref21).
2.3 Mechanical Properties and Residual Stress
Three tensile test specimens and three 30930910 mm residual stress measurement blocks shown in Fig.1(a) with strain gage attached to top surface were manufactured for each test case. Residual stress, mechanical properties and hardness (indentation locations shown in Fig.1b) were tested based on the methodology presented in the work by Ali et al. (Ref21). 2.4 Varying Power and Exposure Combinations at Constant
Energy Density
Test specimens were manufactured using 50lm layer thickness for all test cases shown in Table2. Power and exposure time were varied, such that the energy density for each build remained constant at 76.92 J
mm3as calculated from
the optimum combination of parameters for 50-l m-layer-thickness density optimization trials presented in the work by Ali et al. (Ref22). using ED¼ Pt
pdhlt. where Pis power in
watts,tis exposure inls, pd is point distance inlm,his hatch spacing inlm, and lt is layer thickness inlm.
2.5 Layer Thickness
Table3 shows different layer thickness test cases with optimum power and exposure (determined from density
optimization trials for each layer thickness) used for producing test specimens.
2.6 Finite Element Simulation
The melting behavior of a single line containing 14 laser spots assigning powder properties to the top layer and solid properties to the substrate was simulated for all the cases shown in Tables2 and 3. The modeling approach used within this work is based upon the work by Ali et al. (Ref21).
3. Results and Discussion
3.1 Effect of Varying Power and Exposure with Constant Energy Density on Melt-Pool Size and Cooling Rate
FEA simulation with different combinations of power and exposure was used to estimate equivalent melt pool and cooling rates.
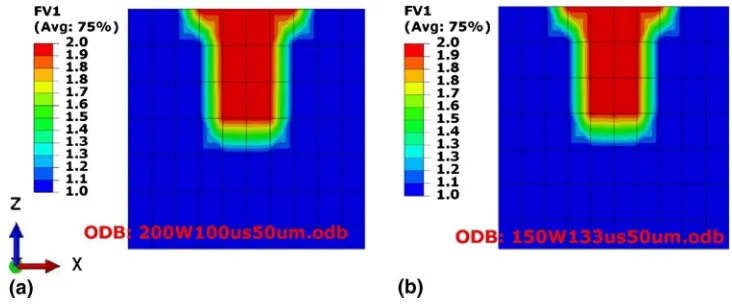
Figure2(a) shows melt-pool dimensions for 200 W and 100ls, while Fig.2(b) shows CED-4 manufactured with the lowest power of 150 W and highest exposure of 133 ls tested in this work. Figure 2shows that for constant energy density any combination of power and exposure resulted in the same melt-pool size.
Figure3shows that for constant energy density, decreasing power and increasing exposure leads to a decrease in cooling rate. Figure4 shows the temperature distribution across the depth of the melt pool, where Fig.4(b) shows that adding the same energy at a slower rate provides time for heat flow to the surrounding material and raises its temperature. This heating of the surrounding material is responsible for the decrease in cooling rates depicted in Fig.3.
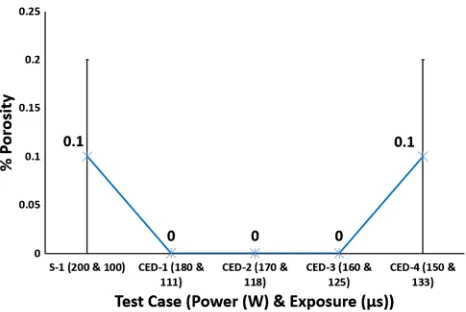
3.1.1 Effect of Laser Power and Exposure with Constant Energy Density on Porosity and Microstructure. Figure5
shows that for a constant energy density all test cases achieved nearly fully dense SLM Ti6Al4V parts.
No variation in % porosity is consistent with the findings of Fig.2showing same melt-pool dimensions for all test cases.
According to Ahmed et al. (Ref32), cooling rates higher than 410 C
s lead to fully martensitic microstructure for Ti6Al4V. Therefore, according to the cooling rates shown in Fig.3, irrespective of the power and exposure combinations all test cases resulted in fully martensitic microstructure with martensitic a0 laths growing inside prior b columnar grains shown in Fig.6.
[image:3.594.48.548.682.721.2]3.1.2 Effect of Laser Power and Exposure with Constant Energy Density on Residual Stress. For constant energy density, Fig.6 shows that decreasing power and increasing exposure results in lowering the highest temperature in the melt pool which is consistent with the findings of Ref24, 25). Studying the effect of decreasing power individually Manvatkar et al. (Ref24) reported decreased melt-pool size and increased cooling rate. Since the current study varied both power and
Table 1 SLM process parameters
Focus offset Hatch spacing,lm Contour spacing, mm Point distance,lm Scanning strategy
exposure proportionally for keeping energy density constant, reducing power did not affect melt-pool size (see Fig.2) while cooling rate decreased (see Fig.3). Figure7shows a decrease in temperature gradient between the top and 250lm depth across a melt pool, as illustrated by the slope of the line equations which is consistent with the findings of Vasinonta et al. (Ref7), reporting lower thermal gradients for slower scanning.
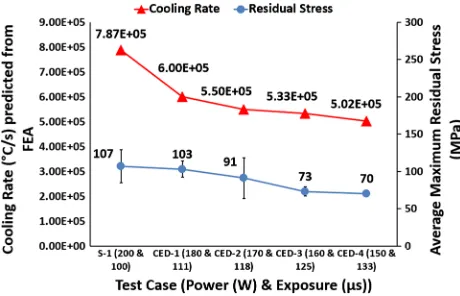
For constant energy density, Fig.8shows a decreasing trend in residual stress and cooling rates with decreasing power and increasing exposure. Figure8 shows test case S-1, manufac-tured with optimum combination of power (200 W) and exposure (100ls), resulted in 107 MPa residual stress. CED-1 resulted in 3.7% reduction in residual stress compared with
S-1. CED-2 resulted in 15% reduction in residual stress compared with S-1. CED-3 resulted in 19.8% decrease in residual stress compared with CED-2 and 31.8% compared with S-1. CED-4 resulted in 4.1% decrease in residual stress compared with CED-3 and 34.6% compared with S-1.
The decreasing trend in cooling rate is consistent with the work by Manvatkar et al. (Ref24), reporting decreased cooling rate for slower scanning. This decrease in cooling rate leads to a decrease in residual stress in samples made with lower power and higher exposure. Bru¨ckner et al. (Ref26) reported slower scan speed led to reducing residual stress in a single track. Therefore, it is valid to suggest that maintaining the energy density constant, the trend in cooling rate and residual stress follows the same trend as when the effect of exposure time on
Table 2 Constant energy density test cases
Test case S-1 CED-1 CED-2 CED-3 CED-4
[image:4.594.54.528.96.317.2]Power, W and exposure,ls 200 and 100 180 and 111 170 and 118 160 and 125 150 and 133
Table 3 Layer thickness test cases
Test case LT-1 LT-2 LT-3
Layer thickness,lm 25 50 75
Power, W 170 200 200
Exposure,ls 80 100 120
Fig. 1 (a) 30930910 residual stress block showing hole drilled in the center of the strain gage rosette attached on top surface. (b) Cross-sectioned 30930910 residual stress block showing the locations of the Vickers hardness indentations
[image:4.594.113.479.361.513.2]residual stress is studied individually. The correlation of cooling rate and residual stress with power is the opposite of when power is varied individually. Decreased power and increased exposure combination leads to lower temperature gradients (see Fig.7) and lower cooling rates (see Fig.8). Thus, according to the temperature gradient mechanism (Ref33) and cool-down phase model (Ref16,33), decreasing power and increasing exposure keeping energy density constant should lead to a decrease in residual stress.
3.1.3 Effect of Laser Power and Exposure with Constant Energy Density on Mechanical Properties. Figure9shows decreasing power and increasing exposure leads to a slight increase in yield strength, while there is a considerable improvement in % elongation of SLM samples while % porosity remains consistent.
Figure3shows that for constant energy density, decreasing power and increasing exposure leads to reduction in cooling rates. According to effective slip length and dislocation movement theories (Ref34, 35), decreasing power and increasing exposure should lead to a decrease in yield strength, as it decreases the cooling rate. According to Leuders et al. (Ref36), process-induced porosity acts as a stress concentrator and leads to a reduction in mechanical properties. Figure9
shows that for test cases CED-1 to CED-3 there is no porosity which might be the reason for 1.6% increase in yield strength of CED-3 compared with S-1. CED-4 shows 0.1% porosity,
similar to S-1, and much lower cooling rate, but resulted in 3.9% increase in yield strength compared to S-1. Varying combinations of power and exposure keeping energy density constant affect the yield strength of the samples in the range of 1-3%.
Figure9 shows an increasing trend in ductility with decreasing power and increasing exposure keeping energy density constant. The sudden increase in the elongation of CED-1 is not clear as it has cooling rates higher than that of test cases CED-2 to CED-4. Overall Fig.9shows that lower power and higher exposure combinations leads to an increase in elongation. According to effective slip length and dislocation movement theories (Ref34, 35), ductility increases with increasing cooling rate up to a certain point (around 500-600
C
s ), and beyond this point of maximum ductility, it decreases sharply with a further increase in the cooling rate. This intermediate optimum cooling rate for maximum ductility (Ref34,35) is much lower than SLM cooling rates. The SLM cooling rate decreases with decreasing power and increasing exposure which leads to an increase in ductility as the cooling rate is moving toward the intermediate optimum cooling rate for maximized ductility.
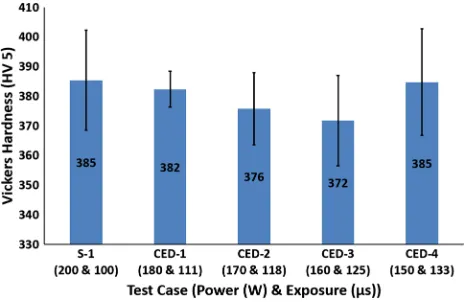
All the test cases had a totally martensitic microstructure (see Fig.3for cooling rates); therefore, Fig.10shows no major variation in Vickers hardness.
Fig. 3 Effect of varying power and exposure time combination for a constant energy density on cooling rates
Fig. 4 Effect of varying power and exposure time combination for a constant energy density on melt-pool temperature distribution. (a) Test case S-1 (200 W power and 100ls exposure). (b) Test case CED-4 (150 W power and 133ls exposure)
[image:5.594.313.546.327.483.2] [image:5.594.49.281.331.484.2] [image:5.594.116.481.539.690.2]Fig. 6 Martensitica¢laths in priorbcolumnar grains. (a) Test case S-1, 90°alternating scanning strategy with optimum combination of power (200 W) and exposure (100ls). (b) Test case CED-1, power (180 W) and exposure (111ls). (c) Test case CED-4, power (150 W) and exposure (133ls)
Fig. 7 Effect of varying power and exposure time combination for a constant energy density on temperature gradient
Fig. 8 Effect of varying power and exposure time combination for a constant energy density on cooling rate and residual stress
[image:6.594.57.540.33.157.2] [image:6.594.114.482.214.475.2] [image:6.594.312.544.510.660.2] [image:6.594.50.280.523.671.2]3.2 Effect of Layer Thickness
FEA simulation with different layer thicknesses was used to estimate the effect of layer thickness on cooling rates and temperature gradients.
Figure11shows a direct relationship between layer thick-ness and melt-pool size.
A larger melt pool contains a higher volume of processed material that will cool at reduced cooling rate; therefore, Fig.12shows an inverse relationship between layer thickness and cooling rates.
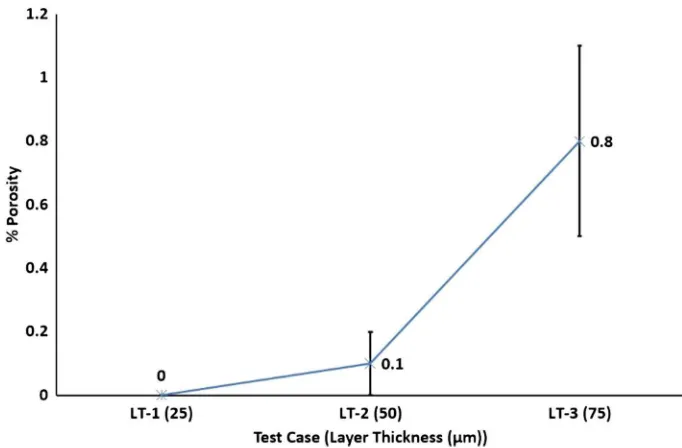
3.2.1 Effect of Layer Thickness on Porosity and Mi-crostructure. Increasing layer thickness resulted in an increase in porosity even though the parameters were optimized for each layer thickness.
Figure13shows an increase in inter layer defects which led to an increase in % porosity with increasing layer thickness. Figure14 shows LT-1 resulted in 0% porosity, increasing to 0.1% for LT-2 and 0.8% for LT-3.
Figure12 shows increasing layer thickness led to reduced cooling rates but still much higher than the cooling rate required for a fully martensitic microstructure in Ti6Al4V. Ahmed et al. (Ref32) reported cooling rates higher than 410C
s leads to fully martensitic microstructure for Ti6Al4V. There-fore, irrespective of the layer thickness all test cases resulted in fully martensitic microstructure with martensitic a0 laths growing inside prior columnarbgrains as shown in Fig.15.
3.2.2 Effect of Layer Thickness on Residual Stress. Figure16 shows that increasing layer thickness results in increasing the peak temperature in the melt pool. Test case LT-1 was built with 170 W and 80ls, resulting in an energy density of 104.62 J
mm3. LT-2 was built with 200 W and
100ls, resulting in an energy density of 76.92 J
mm3. LT-3 was
built with 200 W and 120ls, resulting in an energy density of 61.54 J
mm3. This shows that the required energy density for
fully dense parts decreased with increasing layer thickness. The only probable explanation for this behavior is that increasing powder layer thickness hinders the conduction of heat away to the substrate, and thus, more energy is retained in the powder. This leads to higher peak temperatures (see Fig.16) and larger melt-pool size (see Fig.11). Another important feature from Fig.16is the decrease in temperature gradient with increasing layer thickness between the top and 200lm depth across a melt pool, as illustrated by the slope of the line equations. Thus, according to the temperature gradient mechanism (Ref33) and cool-down phase model (Ref 16,33), increasing layer thickness should lead to a decrease in residual stress.
Figure17shows an inverse relation between residual stress and layer thickness. Test case LT-1 resulted in 190 MPa residual stress. LT-2 showed a decrease of 43.7% in residual stress, compared to LT-1. LT-3 resulted in a further decrease of 27.1% compared to LT-2 and 58.9% compared to LT-1. A decrease in residual stress with increasing layer thickness is consistent with the findings of Zaeh et al. (Ref14), reporting a reduction in deformation of cantilever specimens with increas-ing layer thickness. Kruth et al. (Ref18) also reported a decreasing trend in the deformation of bridge-shaped specimens with increasing layer thickness. Van Belle et al. (Ref 12) also reported a reduction in deformation of thin plates onto which powder layers were deposited with increasing layer thickness. Figure16 shows a decrease in thermal gradient, and Fig.17
shows a reduction in cooling rates with increasing layer thickness; therefore, according to the temperature gradient mechanism (Ref33) and cool-down phase model (Ref16,33), increasing layer thickness leads to a decrease in residual stress.
3.2.3 Effect of Layer Thickness on Mechanical Proper-ties. Figure18shows a decreasing trend in % elongation and yield strength with increasing layer thickness, while % porosity increases.
[image:7.594.50.284.355.506.2]LT-1 showed a yield strength of 1092 MPa. LT-2 resulted in a decrease of 1.2% in yield strength, compared to LT-1. LT-3 resulted in a further decrease of 3.9% compared to LT-2 and 5% compared to LT-1. It is therefore clear from the results shown in
[image:7.594.54.542.573.689.2]Fig. 10 Effect of varying power and exposure time combination for a constant energy density on Vickers hardness
Fig. 12 Effect of layer thickness on cooling rates
Fig. 13 Interlayer defects (a) LT-1, (b) LT-2 and (c) LT-3
[image:8.594.125.466.459.683.2]Fig.18 that increasing layer thickness resulted in under 5% reduction in yield strength.
Figure12 shows increasing layer thickness led to a reduc-tion in cooling rates. For lamellar microstructure, the mechan-ical properties are greatly affected by theacolony size (Ref34,
35). Colony size determines the effective slip length and is inversely proportional to the cooling rate from thebphase field. According to Ref34, 35), yield strength is inversely propor-tional to slip length and yield strength grows exponentially with cooling rate, over 1000 C
min (air cooling). Manikandakumar et al. (Ref37) reported mechanical properties of SLM Ti6Al4V parts depend on theacolony andalath size. Thealath anda
colony sizes are equal to single martensitic a0 laths for a martensitic microstructure. The movement of dislocations is restricted due to the smaller a colony sizes in martensitic microstructures for SLM Ti6Al4V, which leads to limited plastic deformation in SLM Ti6Al4V components. Limited plastic deformation of SLM parts leads to higher yield strength and UTS. According to effective slip length and dislocation movement theories (Ref34, 35), increasing layer thickness should lead to a decrease in yield strength as increased layer
thickness means slower cooling rate and thus lower yield strength. According to Leuders et al. (Ref 36), specimens can fail prematurely due to process-induced porosity acting as stress concentrators. Figure18shows that increasing layer thickness leads to an increase in porosity. Therefore, the increase in inter layer porosity with increasing layer thickness is another factor contributing to the reduction in yield strength with increasing layer thickness.
Figure18shows inverse relationship between % elongation and layer thickness. Test case LT-1 resulted in 11% elongation. LT-2 resulted in a decrease of 37.3% in elongation, compared to LT-1. LT-3 resulted in a further decrease of 20.9% compared to LT-2 and 50.2% compared to LT-1. It is therefore clear from the results shown in Fig.18 that increasing the layer thickness resulted in a significant reduction in the elongation of the samples.
The relationship between cooling rates and ductility is more complex (Ref34, 35). Decrease in slip length leads to an increase in ductility (Ref34, 35). Ductility increases with increasing cooling rate up to a certain point (500-600 C
[image:9.594.55.543.285.413.2]s ), and beyond this point of maximum ductility, it decreases sharply
[image:9.594.112.481.473.697.2]Fig. 15 Martensitica0 laths in priorbcolumnar grains. (a) Test case LT-1, 25lm layer thickness. (b) Test case LT-2, 50lm layer thickness. (c) Test case LT-3, 75lm layer thickness
with further increase in the cooling rate (Ref34, 35). The intermediate cooling rate resulting in maximum ductility is much lower than the SLM cooling rates. The cooling rate decreases with increasing layer thickness which should lead to an increase in ductility as the cooling rate is moving toward the intermediate optimum cooling rate for maximized ductility.
Since the ductility is decreasing despite the cooling rates moving toward the optimum, the only explanation for this decrease can be attributed to the increase in inter layer porosity with increasing layer thickness. Therefore, it is valid to say that porosity defects act as stress concentrators, which leads to premature failure of tensile specimens and thus results in the deterioration of mechanical properties.
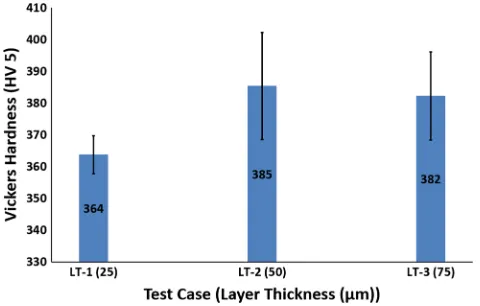
All the test cases had a totally martensitic microstructure (see Fig.12 for cooling rates); therefore, Fig.19 shows no major variation in Vickers hardness.
4. Conclusions
Keeping energy density constant (optimum energy density determined from parameter optimization), the effect of varying power and exposure combination on residual stress and mechanical properties was investigated. For constant energy density, the FEA model predicted a direct relationship between power, cooling rates and temperature gradients and an inverse relationship between exposure, cooling rates and temperature gradients. All samples resulted in fully martensitic microstruc-ture with prior columnar beta grains irrespective of the power and exposure combination as the cooling rates were much higher than 410 C
s . For constant energy density, lower power and higher exposure combination resulted in lower residual stress in SLM Ti6Al4V components. 150 W and 133ls combination resulted in lowest residual stress due to lower cooling rate and lower temperature gradient. For constant energy density, the yield strength did not show any consider-able variation with power and exposure. The % elongation showed an increasing trend with decreasing power and increasing exposure resulting from increase in alath size due to a decrease in cooling rate.
Three different layer thicknesses (25, 50 and 75lm) were investigated to understand the effect on residual stress, microstructure and mechanical properties of SLM Ti6Al4V components. FEA model predicted an inverse relationship between layer thickness and cooling rates because of the increase in melt-pool size with layer thickness. Layer thickness and temperature gradients are also inversely related. All samples resulted in fully martensitic microstructure with prior columnar beta grains irrespective of the layer thickness as the cooling rates were much higher than 410 C
s . Layer thickness showed an inverse relationship with experimentally measured residual stress. Layer thickness of 75lm resulted in the lowest residual stress due to lower cooling rate and lower temperature gradients. Yield strength and elongation showed an inverse relationship with layer thickness. Layer thickness of 25lm resulted in the highest yield strength and elongation values for SLM Ti6Al4V components as the samples had no visible interlayer defects.
Acknowledgments
[image:10.594.49.282.33.182.2]The author would like to thank TWI and the EPSRC Future Manufacturing Hub in Manufacture using Advanced Powder Processes (MAPP)(EP/P006566/1) for their support during this investigation.
[image:10.594.49.282.230.380.2]Fig. 17 Effect of layer thickness on cooling rate and residual stress
Fig. 18 Relationship between layer thickness, % porosity, % elon-gation and yield strength
[image:10.594.47.287.435.588.2]Open Access
This article is distributed under the terms of the Creative Commons Attribution 4.0 International License (http://creativecommons.org/ licenses/by/4.0/), which permits unrestricted use, distribution, and reproduction in any medium, provided you give appropriate credit to the original author(s) and the source, provide a link to the Creative Commons license, and indicate if changes were made.
References
1. Y. Lu et al., Study on the Microstructure, Mechanical Property and Residual Stress of SLM Inconel-718 Alloy Manufactured by Differing
Island Scanning Strategy,Opt. Laser Technol., 2015,75, p 197–206
2. A.J. Dunbar et al., Development of Experimental Method for In Situ Distortion and Temperature Measurements During the Laser Powder
Bed Fusion Additive Manufacturing Process, Addit. Manuf., 2016,
12(Part A), p 25–30
3. A.H. Nickel, D.M. Barnett, and F.B. Prinz, Thermal Stresses and
Deposition Patterns in Layered Manufacturing, Mater. Sci. Eng. A,
2001,317(1–2), p 59–64
4. A.V. Gusarov, M. Pavlov, and I. Smurov, Residual Stresses at Laser
Surface Remelting and Additive Manufacturing,Phys. Procedia, 2011,
12, p 248–254
5. B. Cheng, S. Shrestha, and K. Chou, Stress and Deformation Evaluations of Scanning Strategy Effect in Selective Laser Melting,
Addit. Manuf., 2016,12(Part B), p 240–251
6. S. Safdar et al., An Anisotropic Enhanced Thermal Conductivity Approach for Modelling Laser Melt Pools for Ni-Base Super Alloys,
Appl. Math. Model., 2013,37(3), p 1187–1195
7. A. Vasinonta, J.L. Beuth, and M. Griffith, Process Maps for Predicting Residual Stress and Melt Pool Size in the Laser-Based Fabrication of
Thin-Walled Structures,J. Manuf. Sci. Eng., 2006,129(1), p 101–109
8. I. Van Zyl, I. Yadroitsev, and I. Yadroitsava, Residual Stresses in Direct
Metal Laser Sintered Parts,Interdiscip. J., 2015,14, p 110–123
9. L. Parry, I.A. Ashcroft, and R.D. Wildman, Understanding the Effect of Laser Scan Strategy on Residual Stress in Selective Laser Melting
Through Thermo-Mechanical Simulation,Addit. Manuf., 2016,12(Part
A), p 1–15
10. Pohl, H., et al. Thermal Stresses in Direct Metal Laser Sintering, in
Proceedings of the 12th Solid Freeform Fabrication Symposium, Austin, TX, 2001
11. A.S. Wu et al., An Experimental Investigation into Additive
Manu-facturing-Induced Residual Stresses in 316L Stainless Steel, Metall.
Mater. Trans. A, 2014,45(13), p 6260–6270
12. L.V. Van Belle and J.C. Boyer, Investigation of Residual Stresses
Induced during the Selective Laser Melting Process,Key Eng. Mater.,
2013,554–557, p 1828–1834
13. J.-P. Kruth, M.B., E.Yasa, J. Deckers, L. Thijs, J. Van Humbeeck.Part
and Material Properties in Selective Laser Melting of Metals, in 16th International Symposium on Electromachining (ISEM XVI) (Shang-hai-China, 2010)
14. M.F. Zaeh and G. Branner, Investigations on Residual Stresses and
Deformations in Selective Laser Melting, Prod. Eng. Res. Dev.
Germany, 2010,4(1), p 35–45
15. P. Mercelis and J.-P. Kruth, Residual Stresses in Selective Laser
Sintering and Selective Laser Melting,Rapid Prototyp. J., 2006,12(5),
p 254–265
16. M. Shiomi et al., Residual Stress Within Metallic Model Made by
Selective Laser Melting Process,CIRP Ann. Manuf. Technol., 2004,
53(1), p 195–198
17. I.A. Roberts,Investigation of Residual Stresses in the Laser Melting of
Metal Powders in Additive Layer Manufacturing, University of Wolverhampton, Wolverhampton, 2012, p 246
18. J.-P. Kruth et al., Assessing and Comparing Influencing Factors of Residual Stresses in Selective Laser Melting Using a Novel Analysis
Method,Proc. Inst. Mech. Eng. Part B J. Eng. Manuf., 2012,226(6), p
980–991
19. C. Casavola, S.L. Campanelli, C. Pappalettere,Experimental Analysis
of Residual Stresses in the Selective Laser Melting Process, in Proceedings of the XIth International Congress and Exposition (Orlando, Florida USA, 2008)
20. Ali, H., Evolution of Residual Stress in Ti6Al4V Components Fabricated using Selective Laser Melting. Mechanical Engineering, The University of Sheffield, 2017
21. H. Ali, H. Ghadbeigi, and K. Mumtaz, Effect of Scanning Strategies on Residual Stress and Mechanical Properties of Selective Laser Melted
Ti6Al4V,Mater. Sci. Eng. A, 2018,712, p 175–187
22. H. Ali et al., In-Situ Residual Stress Reduction, Martensitic Decom-position and Mechanical Properties Enhancement Through High Temperature Powder Bed Pre-heating of SELECTIVE Laser Melted
Ti6Al4V,Mater. Sci. Eng. A, 2017,695, p 211–220
23. I. Yadroitsev, P. Krakhmalev, and I. Yadroitsava, Selective Laser Melting of Ti6Al4V Alloy for Biomedical Applications: Temperature
Monitoring and Microstructural Evolution, J. Alloy. Compd., 2014,
583, p 404–409
24. V. Manvatkar, A. De, and T. DebRoy, Spatial Variation of Melt Pool Geometry, Peak Temperature and Solidification Parameters During
Laser Assisted Additive Manufacturing Process,Mater. Sci. Technol.,
2015,31(8), p 924–930
25. M. Alimardani et al., On the Delamination and Crack Formation in a Thin Wall Fabricated Using Laser Solid Freeform Fabrication Process:
An Experimental–Numerical Investigation, Opt. Lasers Eng., 2009,
47(11), p 1160–1168
26. F. Bru¨ckner, D. Lepski, and E. Beyer, Modeling the Influence of Process Parameters and Additional Heat Sources on Residual Stresses
in Laser Cladding,J. Therm. Spray Technol., 2007,16(3), p 355–373
27. M.A. Taha et al., On Selective Laser Melting of Ultra High Carbon Steel: Effect of Scan Speed and Post Heat Treatment (Selektives Laserschmelzen von hoch kohlenstoffhaltigen Sta¨hlen: Einfluss der
Abtastgeschwindigkeit und der Wa¨rmenachbehandlung), Mater.
Werkst., 2012,43, p 913–923
28. A. Ilie, H. Ali, and K. Mumtaz, In-Built Customised Mechanical Failure of 316L Components Fabricated Using Selective Laser
Melting,Technologies, 2017,5(1), p 9
29. V.S. Sufiiarov et al., The Effect of Layer Thickness at Selective Laser
Melting,Procedia Eng., 2017,174, p 126–134
30. K. Guan et al., Effects of Processing Parameters on Tensile Properties
of Selective Laser Melted 304 Stainless Steel,Mater. Des., 2013,50, p
581–586
31. J. Delgado, J. Ciurana, and C.A. Rodrı´guez, Influence of Process Parameters on Part Quality and Mechanical Properties for DMLS and
SLM with Iron-Based Materials,Int. J. Adv. Manuf. Technol., 2012,
60(5), p 601–610
32. T. Ahmed and H.J. Rack, Phase Transformations During Cooling in
a+bTitanium Alloys, Mater. Sci. Eng. A, 1998,243(1–2), p 206–
211
33. P. Mercelis,Control of Selective Laser Sintering and Selective Laser
Melting Processes, KU Leuven, Leuven, 2007
34. G. Lu¨tjering, Influence of Processing on Microstructure and
Mechan-ical Properties of (a+b) Titanium Alloys,Mater. Sci. Eng. A, 1998,
243(1–2), p 32–45
35. G. Lu¨tjering and J.C. Williams,Titanium, Springer, Berlin, 2003
36. S. Leuders et al., On the Mechanical Behaviour of Titanium Alloy TiAl6V4 Manufactured by Selective Laser Melting: Fatigue Resistance
and Crack Growth Performance, Int. J. Fatigue, 2013, 48, p 300–
307
37. M. Shunmugavel, A. Polishetty, and G. Littlefair, Microstructure and Mechanical Properties of Wrought and Additive Manufactured