Int. J. Electrochem. Sci., 8 (2013) 9449 - 9458
International Journal of
ELECTROCHEMICAL
SCIENCE
www.electrochemsci.org
Mesoporous Spinel LiMn
2O
4Nanomaterial as a Cathode for
High-Performance Lithium Ion Batteries
Bo-Mi Hwang1, Si-Jin Kim1, Young-Woo Lee1, Biao Han1,2, Seong-Bae Kim1,2, Woo-Seong Kim2, and Kyung-Won Park1,*
1
Department of Chemical Engineering, Soongsil University, Seoul 156-743, Republic of Korea
2
Daejung Energy Materials, 740-49, Sinheung-dong, Iksan, Jeonbuk 570-140, Republic of Korea
*
E-mail: [email protected]
Received: 8 May 2013 / Accepted: 29 May 2013 / Published: 1 July 2013
We demonstrate mesoporous spinel LiMn2O4 nanomaterial (NS-LMO) synthesized by polymer
template method for high-performance lithium ion batteries. The as-synthesized NS-LMO exhibits complete spinel LMO structure with dominant {111} surfaces, nanocrystalline of ~30 nm in size, and relatively high surface area (~13.8 m2 g-1) with mesoporous characteristics. In contrast, the LMO (SS-LMO) prepared by the solid state reaction method consists of a spinel structure of LMO and an extra phase of Mn2O3. The NS-LMO displays much higher capacity of ~96.19 mAh g-1 at 1 C compared to
the SS-LMO (~57.03 mAh g-1) and improved rate cycling performance with the complete capacity retention.
Keywords: LiMn2O4; Nanostructure; Polymer template method; Cathode; Lithium ion batteries
1. INTRODUCTION
Lithium ion batteries (LIBs) have attracted much attention as power sources for various portable electronic devices because of their high energy density [1-4]. Most widely used cathode material is LiCoO2. However, many researchers investigated on several other materials such as
LiNiO2, LiMnO2, LiMn2O4 and LiFePO4 [5]. Moreover, the cubic spinel lithium manganese oxide
(LiMn2O4, LMO) is the promising candidate as a cathode capable of replacing LiCoO2 in LIBs
discharge rate capabilities [8]. Bruce and co-workers synthesized a stoichiometric LMO nanostructured cathode synthesized by a one-pot resorcinol-formaldehyde route with a high initial capacity, excellent rate capacity, and stable cycling performance [9]. Sun et al. suggested spinel LMO powders as a cathode with submicron, monodispersed, and highly homogeneous particles for lithium polymer batteries [10].
The electrochemical performances of electrode materials are highly influenced by the particle size, morphology, phase crystallinity, and distribution. In particular, nanostructured electrode materials shorten lithium ion diffusion path and improve a cycling performance of LIBs [11-14]. In general, the spinel LMO has been synthesized by traditional solid-state reaction method that involves mechanical lithium and manganese salts followed by high-temperature calcination owing to the low reactivity of the starting materials. Also, the as-synthesized particles might have impurity phases, inhomogeneity, irregular morphology large particle size and broad particle size distribution [15,16]. In order to overcome these disadvantages and prepare the complete LMO for LIBs, several soft chemical approaches have been performed using sol-gel method [17-19], combustion process [20,21], chemical precipitation [22], and hydrothermal method [23,24], Navulla et al. prepared a lithium-manganese cathode material by simple one-step solid-state reactions at 600 oC using single-source precursor [25]. Ding et al. demonstrated single-crystalline spinel LMO nanotubes synthesized via template-engaged reaction at 700 oC for high-power LIBs [26]. Patey et al. produced LMO nanoparticles by a one-step flame spray pyrolysis process [27]. Luo et al. demonstrated well-ordered mesoporous spinel LMO prepared by annealing the lithiated mesoporous MnO2 at a low temperature of 350 oC [28]. Recently, a
polymer template method using the triblock copolymer as a soft template has been used for preparing a variety of mesoporous oxide nanomaterials [29,30]. However, there are few reports on the synthesis of nanostructure electrodes for LIBs using the polymer template method.
In general, conventional LMO that prepared at low-temperature has almost polycrystalline or low crystalline with impurity. The excellent crystallinity of the LMO could improve the electrochemical performance by impeding manganese dissolution from the spinel material into the electrolyte [31]. Herein, we synthesized mesoporous LMO cathode nanomaterials with a complete spinel structure for LIBs using a polymer template method at a relatively low temperature of 500 oC (Scheme 1). The structural characterization of the LMO was carried out using wide-angle X-ray diffraction (WA-XRD), field emission scanning electron microscopy (FE-SEM), and field emission transmission electron microscopy (FE-TEM). The surface area of the electrodes was analyzed by a nitrogen sorption measurement. To evaluate the performance for LIBs, charge-discharge, rate cycling, and electrochemical impedance spectroscopy (EIS) curves of the electrodes and were obtained using a lithium coin cell.
2. EXPERIMENTAL
Nanostructured LiMn2O4 (NS-LMO) was synthesized by the polymer template (PT) method
(99.5%, Aldrich) and 12.4 ml of 1-butanol (99.4%, Aldrich) until perfectly transparent. Aqueous solutions of lithium nitrate (LiNO3, 99%, Aldrich) and manganese nitrate (Mn(NO3)2, 99.99%,
Aldrich) were prepared using distilled water as a solvent and 10 ml of 1 M LiNO3 and 2 M Mn(NO3)2
was added to non-aqueous polymer medium. After stirring for 24 h, the solution became a white emulsion and the emulsion was evaporated at 125 oC in silicon oil bath for 8 h until a black gel was obtained. The obtained gel was heated at 300 oC in air for 6 h to get the precursor. The precursor was ground to a fine powder and calcined at 500 oC in air for 6 h to obtain final product.
Bulk-type LiMn2O4 (SS-LMO) was synthesized by the conventional solid-state reaction (SSR)
method (Scheme 1(b)). 0.9 g of lithium acetate dehydrate (63%, Aldrich) and 3.9 g of manganese(II) acetate tetrahydrate (99%, Aldrich) were mixed in stoichiometric amount after physical grinding. The starting materials of lithium and manganese salts as solid–state powders were physically mixed using mortar and pestle. The mixed powder was heated at 300 oC in air for 6 h and then kept at 500 oC in air for 6 h.
Scheme 1. Schematic representation of synthsis of NS-LMO using PT method and SS-LMO using SSR method.
The samples were characterized by XRD using a D2 phase system with a Cu Kα radiation
source of λ = 0.15418 nm at 30 kV and 10 mA. The XRD data was collected in the 2θ between 10° and 80° with scan rate 4° min-1
system and FE-TEM using a Tecnai G2 F30 system operating at 300 kV. Nitrogen adsorption and desorption isotherms were measured at 77 K using a Micromeritics ASAP 2020. Before the adsorption measurements, all samples were outgassed at 473 K for 6 h in the port of the adsorption analyzer. The starting relative pressure was 0.995 P/Po and ending relative pressure was 0.01 P/Po.
The electrochemical performance of the electrodes was determined with 2032 coin-type cells. For preparing working electrodes, a mixture of the active material, acetylene black, and polyvinylidene fluoride binder at a weight ratio of 7:1:2 was pasted on aluminum foil. After vacuum drying at 100 oC for 12 h, the foil was cut into circular disk with a diameter of 13 mm. The counter electrode was used pure lithium foil which was cut into ϕ16 mm round disk. The electrolyte was 1 M LiPF6 dissolved in a
1:1 (v/v) mixture of ethylene carbonate and diethyl carbonate. The cell was assembled in an argon-filled glove box and tested using charge-discharge system in the voltage range of 3.0-4.3 V vs. Li+/Li at different current density. For EIS analysis, the excitation potential applied to the cells was 5 mV in the frequency ranged between 100 kHz and 10 mHz at full charge at 1 C. All the electrochemical measurements were carried out at 25 oC.
3. RESULTS AND DISCUSSION
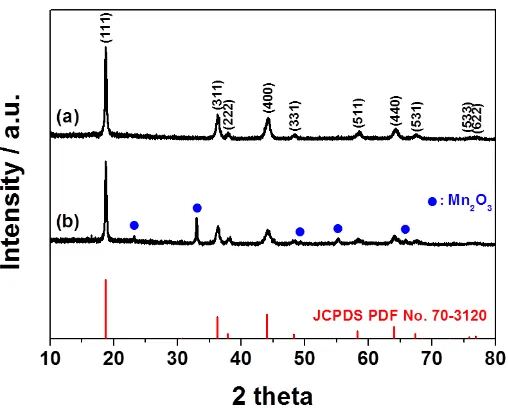
Figure 1. XRD patterns of (a) NS-LMO and (b) SS-LMO.
Fig. 1 shows XRD patterns of the NS-LMO synthesized by the PT method and the SS-LMO prepared by the SSR method. The diffraction peaks of the NS-LMO at 18.7°, 36.2°, 44.0° and 64.0° correspond to (111), (311), (400), and (411), respectively, which is in exact agreement with those of a single-phase spinel LMO material with Fd3m space group (JCPDS No. 70-3120) with no peaks of the Mn2O3 phase detected. In contrast, the SS-LMO consists of main LMO phase and Mn2O3 as an
[image:4.596.168.422.385.589.2]
plane of (111). Based on the Scherrer equation, the average particle sizes of NS-LMO and SS-LMO are ~29.4 and ~33.5 nm, respectively. This represents that the present synthesis route (PT method) is considerably suitable for preparing a complete LMO nanostructure at low temperature [32].
Figure 2. XRD patterns of FE-SEM images [The inset indicates FE-TEM images] of (a) NS-LMO and (b) SS-LMO. HR-TEM images of (c) LMO and (d) SS-LMO. Size distributions of (e) NS-LMO and (f) SS-NS-LMO.
[image:5.596.127.454.147.611.2]
crystalline structure with dominant {111} surfaces having a lattice distance of 0.475 nm. The HR-TEM image (Fig. 2(d)) of the SS-LMO shows {111} surfaces having a lattice distance of 0.475 nm. Sun et al. suggested the formation of a solid electrolyte interface on the surface of {111} planes of LMO is critical for stabilizing its crystal structure during lithium ion insertion/desertion process compared to other facets [33]. Also, Kim et al. reported the dominant {111} surfaces to minimize the Mn dissolution, exhibiting a superior cycle life and facilitating high discharge rate capabilities [8]. The NS-LMO holds ~31.0 nm in an average size according to the size distribution of the Fig. 2(e), which is in a good agreement with that measured by XRD analysis. The close agreement exhibits that single, non-aggregated, crystalline, pure LMO nanoparticles can be produced by the PT method. In contrast, the SS-LMO exhibits much larger particle size of ~302.1 nm than that of the NS-LMO (Fig. 2(f)). The large difference of the measured particle size of the SS-LMO indicates that aggregated LMO particles with impurities might be obtained by the SSR method.
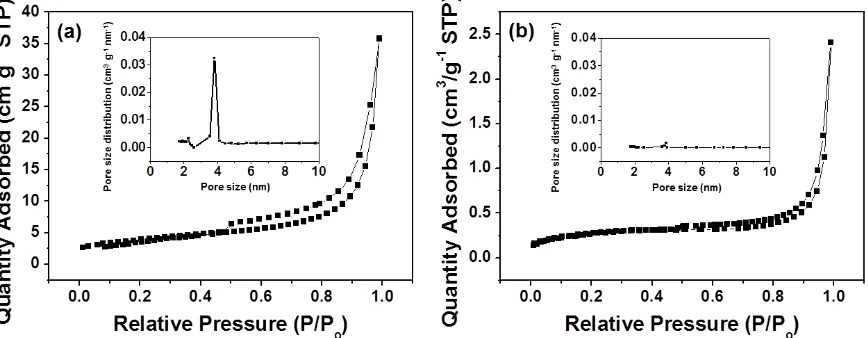
Figure 3. Nitrogen adsorption/desorption isotherms for (a) NS-LMO and (b) SS-LMO. The insets are pore size distributions of the samples.
The nitrogen-adsorption isotherms of the as-prepared LMOs are shown in Fig.3. The LS-LMO exhibits mesoporous structure with ~13.8 m2 g-1 in Brunauer-Emmett-Teller (BET) specific surface area and ~3.8 nm in pore size (Fig. 3(a)). The isotherm curve of the NS-LMO displays a well-defined step for the relative pressure P/Po ranging from 0.6 to 0.8 as a typical IV classification with a clear
H1-type hysteretic loop, which is characteristic of mesoporous materials [28]. The SS-LMO exhibits much smaller BET surface area of ~1.0 m2 g-1 and no pore size distribution (Fig. 3(b)), as compared to the NS-LMO, resulting from particle agglomeration.
[image:6.596.75.509.307.476.2]
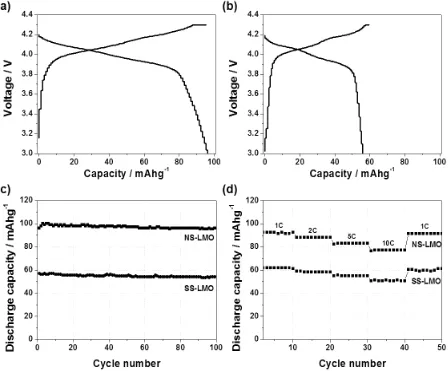
Figure 4. Charge-discharge curves of (a) NS-LMO and (b) SS-LMO at 1 C. (c) Cycle performance of NS-LMO and SS-LMO at 1 C for 100 cycles. (d) Rate cycling performance of NS-LMO and SS-LMO from 1 C to 10 C.
The discharge curve of the NS-LMO displays a smooth slope between 4.0 and 3.8 V whereas the SS-LMO displays a bent discharged region between 4.0 and 3.9 V, which might be mainly attributed to the lithium intercalation behavior of Mn2O3 as an impurity. The cycling performance of
[image:7.596.64.512.78.449.2]
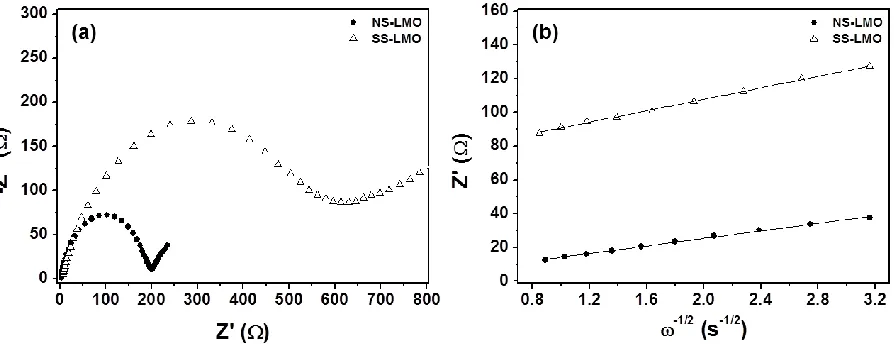
Nyquist plots of the NS-LMO and SS-LMO in the range between 100 kHz and 10 mHz are shown in Fig. 5(a). The value of the diameter of the semicircle on the Zreal axis is related to the charge
transfer resistance (Rct). The values of Rct of the NS-LMO and SS-LMO are 200.5 and 629.5 ,
respectively, representing much improved charge transport of the NS-LMO (Table 1). As indicated in Fig. 5(b), using the relationship between ZRe and square root of frequency (-1/2) in the low frequency
range (Eq. (1)) [34], the Warburg impedance coefficients (W) of the NS-LMO and SS-LMO can be calculated to be 11.16 and 16.94 cm2 s-1/2, respectively.
Figure 5. (a) Nyquist plots of NS-LMO and SS-LMO at 1 C in the frequency ranged between 100 kHz and 10 mHz.
Table 1. Comparison of charge transfer resistance (Rct), Warburg impedance coefficient (W), and
diffusion coefficient (D) of the cathodes.
Rct / Ω W / Ω cm2 s-1/2 D / cm2 s-1
NS-LMO 200.5 11.16 2.7310-12
SS-LMO 629.5 16.94 1.1810-12
ZRe = Re + Rct + W-1/2 (1)
D = R2T2 / 2A2n4F4C2W2 (2)
[image:8.596.70.517.224.397.2]
4. CONCLUSIONS
We have successfully synthesized the mesoporous NS-LMO nanostructured cathode material for high-performance lithium ion batteries using the PT method at relatively low reaction temperature. The NS-LMO prepared by the PT method with much higher surface area and mesoporous properties shows complete spinel LMO structure without any other phases, whereas the SS-LMO prepared by the SSR method consists of main LMO and extra phase of Mn2O3. The complete spinel structure,
relatively large specific surface area, low transport resistance, and high lithium ion diffusion coefficient of the NS-LMO might lead to much higher capacity and improved cycling performance with complete retention compared to the SS-LMO.
ACKNOWLEDGMENTS
This work was supported by the Ministry of Knowledge Economy(MKE) and Korea Industrial Technology Foundation (KOTEF) through the Human Resource Training Project for Strategic Technology and IT R&D program of MKE/KEIT [KI002176, Development of 3.6Ah Class Cylindrical Type Lithium Secondary Battery].
References
1. B. Scrosati, Nature, 373 (1995) 557
2. J.-M. Tarascon and M. Armand, Nature, 414 (2001) 359 3. M. S. Whittingham, MRS Bull., 33 (2008) 411
4. K. Kang, Y. S. Meng, J. Bréger, C. P. Grey and G. Ceder, Science, 311 (2006) 977 5. M. S. Whittingham, Chem. Rev., 104 (2004) 4271
6. M. M. Thackeray, W. I. F. David, P. G. Bruce and J. B. Goodenough, Mater. Res. Bull., 18 (1983) 461
7. E. Hosono, T. Kudo, I. Honma, H. Matsuda and H. Zhou, Nano Lett., 9 (2009) 1045
8. J.-S. Kim, K. S. Kim, W. Cho, W. H. Shin, R. Kanno and J. W. Choi, Nano Lett., 12 (2012) 6358 9. K. M. Shaju and P. G. Bruce, Chem. Mater., 20 (2008) 5557
10. Y.-K. Sun and S.-H. Jin, J. Mater. Chem., 8 (1998) 2399
11. A. S. Aricò, P. Bruce, B. Scrosati, J.-M. Tarascon and W. Van Schalkwijk, Nat. Mater., 4 (2005) 366
12. C. Jiang, E. Hosono and H. Zhou, Nano Today, 1 (2006) 28
13. N. Kamarulzaman, R. Yusoff, N. Kamarudin, N. H. Shaari, N. A. Abdul Aziz, M. A. Bustam, N. Blagojevic, M. Elcombe, M. Blackford, M. Avdeev and A. K. Arof, J. Power Sources, 188 (2009) 274
14. W. Tang, X. J. Wang, Y. Y. Hou, L. L. Li, H. Sun, Y. S. Zhu, Y. Bai, Y. P. Wu, K. Zhu and T. Van Ree, J. Power Sources, 198 (2012) 308
15. J. Guan and M. Liu, Solid State Ion., 110 (1998) 21
16. J.-H. Choy, D.-H. Kim, C.-W Kwon, S.-J. Hwang and Y.-I. Kim, J. Power Sources, 77 (1999) 1 17. B. J. Hwang, R. Santhanam and D. G. Liu, J. Power Sources, 97 (2001) 443
18. Y.-K. Sun, I.-H. Oh and K. Y. Kim, Ind. Eng. Chem. Res., 36 (1997) 4839
19. M. Michalska, L. Lipińska, M. Mirkowska, M. Aksienionek, R. Diduszko and M. Wasiucionek, Solid State Ion., 188 (2011) 160
20. Y. Zhang, H.-C. Shin, J. Dong and M. Liu, Solid State Ion., 171 (2004) 25 21. C.-Z. Lu and T.-K. Fey, J. Phys. Chem. Solids, 67 (2006) 756
23. W. Tang, L. L. Liu, S. Tian, L. Li, L. L. Li, Y. B. Yue, Y. Bai, Y. P. Wu, K. Zhu and R. Holze, Electrochem. Commun., 13 (2011) 1159
24. R. Jiang, C. Cui and H. Ma, Mater. Lett., 91 (2013) 12
25. A. Navulla, L. Huynh, Z. Wei, A. S. Filatov and E. V. Dikarev, J. Am. Chem. Soc., 134 (2012) 5762
26. Y.-L. Ding, J. Xie, G.-S. Cao, T.-J. Zhu, H.-M. Yu and X.-B. Zhao, Adv. Funct. Mater., 21 (2011) 348
27. T. J. Patey, R. Büchel, M. Nakayama and P. Novák, Phys. Chem. Chem. Phys., 11 (2009) 3756 28. J.-Y Luo, Y. Wang, H.-M. Xiong, and Y.-Y Xia, Chem. Mater., 19 (2007) 4791
29. M. B. Zakaria, N. Suzuki, N. L. Torad, M. Matsuura, K. Maekawa, H. Tanabe and Y. Yamauchi, Eur. J. Inorg. Chem., 13 (2013) 2330
30. G. J. Soler-Illia, A. A. De, C. Sachez, B. Lebeau, and J. Patarin, Chem. Rev., 102 (2002) 4093 31. M. W. Raja, S. Mahanty and R. N. Basu, Solid State Ion., 180 (2009) 1261
32. H. W Chan, J. G. Duh and S. R. Sheen, J. Power Sources, 115 (2003) 110
33. W. Sun, F. Cao, Y. Liu, X. Zhao, X. Liu and J. Yuan, J. Mater. Chem., 22 (2012) 20952 34. B. Pei, H. Yao, W. Zhang and Z. Yang, J. Power Sources, 220 (2012) 317
35. D. Aurbach, M. D. Levi, E. Levi, H. Teller, B. Markovsky and G. Salitra, J. Electrochem. Soc., 145 (1998) 3024
![Figure 2. XRD patterns of FE-SEM images [The inset indicates FE-TEM images] of (a) NS-LMO and (b) SS-LMO](https://thumb-us.123doks.com/thumbv2/123dok_us/1914404.150169/5.596.127.454.147.611/figure-xrd-patterns-sem-images-inset-indicates-images.webp)