This is a repository copy of Sensing, measuring and modelling the mechanical properties of sandstone.
White Rose Research Online URL for this paper: http://eprints.whiterose.ac.uk/122676/
Version: Accepted Version
Article:
Antony, SJ orcid.org/0000-0003-1761-6306, Olugbenga, A and Ozerkan, N (2018) Sensing, measuring and modelling the mechanical properties of sandstone. Rock Mechanics and Rock Engineering, 51 (2). pp. 451-464. ISSN 0723-2632
https://doi.org/10.1007/s00603-017-1347-3
© Springer-Verlag GmbH Austria 2017. This is an author produced version of a paper published in Rock Mechanics and Rock Engineering. Uploaded in accordance with the publisher's self-archiving policy.
[email protected] Reuse
Items deposited in White Rose Research Online are protected by copyright, with all rights reserved unless indicated otherwise. They may be downloaded and/or printed for private study, or other acts as permitted by national copyright laws. The publisher or other rights holders may allow further reproduction and re-use of the full text version. This is indicated by the licence information on the White Rose Research Online record for the item.
Takedown
If you consider content in White Rose Research Online to be in breach of UK law, please notify us by
Accepted for publication in Rock Mechanics and Rock Engineering journal.
Sensing, measuring and modelling the mechanical properties of sandstone
S. J. Antony*1, A. Olugbenga1 and N.G. Ozerkan2
1 School of Chemical and Process Engineering, University of Leeds, LS2 9JT, UK
2Center for Advanced Materials, P. O. Box: 2713 Qatar University, Qatar
* Corresponding author: [email protected]
ABSTRACT
We present a hybrid framework for simulating the strength and dilation characteristics of sandstone. Where possible, the grain-scale properties of sandstone are evaluated experimentally in detail. Also, using photo-stress analysis, we sense the deviator stress (/strain) distribution at the microscale and its components along the orthogonal directions on the surface of a V-notch sandstone sample under mechanical loading. Based on this measurement and applying a grain-scale model, the optical anisotropy index K0 is inferred at the grain scale. This
Key words: Micromechanics, rock mechanics, mechanical properties, optical stress analysis, DEM
1. INTRODUCTION
Fundamental level understandings on the strength and fracture properties of opaque and heterogeneous materials such as sandstone rock require accounting for realistic characteristics, from the single-grain scale to the bulk scale. This task remains as a stiff challenge in a wide range of science and engineering fields including geotechnical, petroleum, mining, minerals, advanced materials and chemical engineering. Rocks have inherent granular arrangement and bonding at grain level (Burnley 2013). A common feature of a fractured rock is the discontinuity of fracture path within its structure induced by shear localisation (Burnley 2013). Fracture path within the sedimentary rock are identified by irregular interlocking pegs and sockets (de Andrade and Stylolites 2000). Mineral sorting of rock samples have shown compositional differences at the grain scale, identified by irregular interlocking pegs and sockets where insoluble minerals concentrate (de Andrade and Stylolites 2000). As a result, they display non-homogeneous material properties at bulk scale (Amadei 1983). Fracture in rock occurs along weaker stress planes (Park 2013). The grains are displaced in directions perpendicular to the least principal stress under external loading (Secor 1965; Nikitin and Odintsev 1999; van der Pluijm and Marshak 2004; Singhal and Gupta, 2010).
easy to pre-locate the weak positions of the strain (or stress) propagation paths in the rock samples (Lawn 1993). Furthermore, their outputs are limited to bulk data (Fairhurst and Hudson 1999), for example the results are averaged over several orders of grain size (gauge length). Ideally one would like to track the distribution of stresses and strains inside three-dimensional rock samples under mechanical loading, but the scientific community is still far away from accomplishing this task more easily. This could be responsible for the lack of accurate theories for defining the strength distribution in deformed complex materials. The relative displacement of the grains in them culminates into crack propagation under mechanical loading and accounting for such micro effects in predicting their bulk strength is not yet well established. Attempts to track the fracturing process by visualising whole-field strain or stress distribution patterns, and linking the grain-scale and micro scale measurements to the bulk scale strength characteristics of heterogeneous materials (Lawn 1993) are generally scarce in the literature. This aspect is addressed in the current work.
samples (Holt at al. 2005). However, stress (/strain) measurements on real sandstone material are required at grain-scale to understand realistic micromechanical features, which is one of the ambitions of the current work.
tuned to suitable micro-properties (normal/shear stiffness, normal/shear bonds, and frictional coefÞcient) during the calibration procedure. Micro-properties were evaluated using a slightly overlapped circular particle interaction (SOCPI) (Fakhimi and Villegas 2004) to work out the ratio of the unconÞned compressive strength to the tensile strength as well as the failure envelope. However, the resulting macroscopic strength was less in magnitude when compared to the real rock sample. Fakhimi and Villegas improved on the overlap technique (Fakhimi and Villegas 2004, 2007) using dimensional analysis to calibrate the particle assembly for the Pennsylvania blue sandstone. In this, the micro-properties resulted underestimates of the macro-properties of the real rock sample using theoretical contact models. Some theoretical and DEM modelling studies of rock materials (Shen et al. 2016) consider the stiffness ratio of the grains as analogues to the ratio between the bulk shear modulus and elastic modulus of the granular bonds. Although previous iterative approaches have provided new insights on the internal behaviour of rock samples under mechanical loading, it would be desirable at first to evaluate the grain-scale input parameters of advanced simulation tools such as DEM using experimental characterisation tools as much as possible, and then to use them to simulate their strength and dilation characteristics of rock samples in a more realistic manner using DEM. This has formed the motivation of the current research using sandstone as a test material.
2. Experiments and Modelling
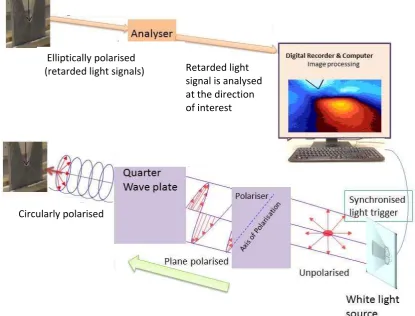
experimental reflective photo stress analysis (PSA) (Antony 2015; Antony et al. 2017) is also used to visualise shear strain (/stress) distribution on sandstone sample under mechanical loading. In PSA, the measurement of deviator strain (/stress) levels as presented later, could be made at or greater than 2nm scale. Hence the method is ideally suited to understand on how stress propagation occurs at microscale on the surfaces of cementitious materials such as sandstone rock under external loading environments. Different experimentally characterised material parameters are used as input into the DEM modelling for simulating its bulk strength and dilation characteristics here.
Before detailing the different methods involved, the key steps of the present study are summarised progressively as follows: Chemical and physical analysis of the sandstone sample (obtained from Niger Delta) was performed to get grain-scale chemo-physical properties. A Chevron sandstone sample (V-notched, Fig.1) was applied with a birefringent uniform coating on its surface. The V-notched sample was subjected to axial line-loading across its thickness in stages. Using PSA and considering that the material is elastic, the whole-field shear strain (/stress) distribution profile was tracked at suitable points close to the tip of the notch and where the optical response is maximum. Using this information and image analysis, the load-displacement of the grains along vertical and horizontal directions at the selected points are inferred for different loading increments. Assuming that the contiguous grains experience these inferred stress (/stain) components along orthogonal directions, and using a well-known inter-granular model (methods section), the incremental force and displacement components were computed. From this, the optical anisotropy index Ko of the sandstone was obtained.
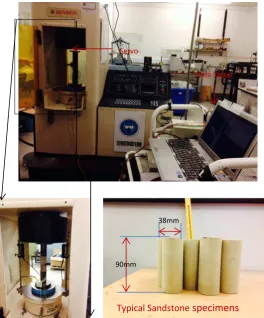
K=1, pertaining to an isotropic and homogeneous material) and using clumped-spheres to reflect the size and coordination number of the grains of sandstone. Discrete element modelling (DEM) is performed to simulate the bulk stress-strain relation and dilation for a cylindrical sample subjected to quasi-static uniaxial compression and tri-axial compression loading conditions (strain rate ~ 2.5x10⁻⁴/s). Evolution of some internal parameters such as the velocity distribution of grains is also done to understand its discontinuities and the evolution of the fracture plane. Finally physical experiments were also done for the sandstone cylindrical samples (90mm height and 38mm diameter) pertaining to both the loading condition of the DEM simulations mentioned above to compare the bulk stress-strain relations and dilation, and a good level of agreement is obtained between the experimental and simulation results to validate the present approach, which links experimentally measured point-scale information to bulk scale strength characteristics of opaque complex materials, in this case sandstone. To substantiate this further, DEM simulations for the above said loading environments were also performed for the case of K=1 for the purpose of comparisons.
2.1.Methods
2.1.1 Experiments: The elemental composition of sandstone was performed using SEM and
and Hudson 2007), and correlated with the optical anisotropy K0 from the current PSA
methodology as described below.
2.1.1.1 Photo-Stress Analysis (PSA)
For understanding the ability of the rock material to deform and distribute strain (/stress) at different directions under external loading environments, conventionally electrical strain gauge rosettes are used (Lawn 1993). The implication is that the strain measurements are averaged over the gauge lengths much longer than the size of the individual rock grains. Most recently, whole-field techniques such as digital image correlation is widely applied for axial strain measurements and strain localisation in rocks (Zhang et al. 2013). However, DIC does not directly measure the deviator strain at the point of interest, but it could be estimated from the displacement measurements of the artificial or natural speckle patterns on the samples. Acoustic emission (Baud et al. 2004), and its combination with DIC, ultrasound tomography and X-ray tomography (Charalampidou et al. 2010,2011) have been also applied to understand the role of bulk deviator stress and its links to the shear and compaction bands in sandstone. PSA is capable of measuring the deviator stress (/strain) to characterise stress anisotropy in materials directly when subjected to external loading (Dally and Riley 1991).
Riley 1991). For interpreting optical anisotropy index Ko, the traces (slopes) of the grain scale
force-retardation curve is used. Reflective photoelastic studies have helped to evaluate the individual principal strain components in materials under external loading with some simplifications (Caputo and Giudice 1983). Some photoelastic studies (Raghuwanshi and Parey 2015) considered that, for an uniaxial normal loading applied along the crack tip, the
major principal stress is far greater than the minor principal stresses ) in the direction of loading at regions close to the crack tip. This scenario is analogues to the current study along the normal direction of loading of the V-notch. However, due to the recent advancement in the optical stress analysis (Donne et al. 2008), we need not assume that the above said condition is applicable at all regions in front of the crack tip in bonded grains, rather the experiments could provide clues on where 11 >> 22 and vice-versa at grain-scale level by
individually examining the distribution of
,
(Fig. 4) together with the distribution ofprincipal strain directions dominantly both along and orthogonal to the direction of loading. This simplification is applied in the well-known strain (or stress)-optic law (Dally and Riley
1991) to obtain the stress increments in the orthogonal components and (or corresponding strain components). Furthermore, the direction of the major principal strain (/stress) components in the positive and negative regions pertaining to the vertical ( ) and
horizontal ( ) planes respectively as illustrated using the Mohr’s circle in Fig.4 (Dally and Riley
software, the vertical and horizontal components of the retardation vector could be inferred for the above mentioned points of interest (ignoring the effect of the minor component), and used to estimate the optical anisotropy index K0. The granular stress ( ij)-force (Fij)-fabric relation
of cemented grains could be represented as (Mavko et al. 2009)Fij= ij in which
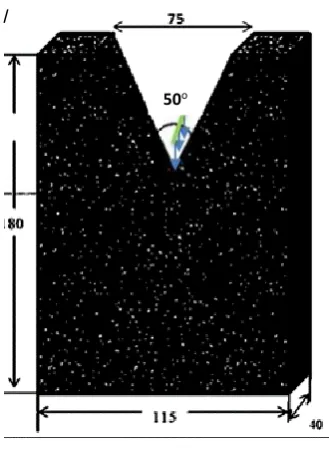
= co-ordination number of the grains (average value of sandstone used) and = porosity of sandstone. This relation has been used to infer the analogous intergranular force and to plot the corresponding force-retardation characteristics (Fig.5). In the current study, the notch angle (Fig.1) is kept as 50o to get a better opto-mechanical response of the V-notch sandstone
samples. This is because, based on Infra-red thermography measurements, our earlier investigations on the grain-level temperature distribution in sandstone samples have shown maximum temperature concentration factor (TOC) (Antony at al. 2016) in the regions close to the notch tip for the notch angle of about 50o. The grain-level displacements occurred
dominantly in the grains experiencing the maximum TOC.
accounting for their standard deviation by distributing it randomly to the grains (Table 1). The three stages of the loading illustrated in Fig.6 are as follows (Li and Fjær 2012); Stage1: This corresponds to the initial stages of the loading where the load level is low. Cementitious bond and spheres could sustain tension. Stage 2: For further increase in the load at this intermediate stage, the overlapped-grain tries to separate. The grains are still bonded. Stage3: At the verge of the grain separation. The grain contact is defined here by a linear spring-dashpot sphere model (Li et al. 2012) with a parallel bond strength (Shen et al. 2016) simulating the cementitious materials between the grains of sandstone (Holt at al. 2005; Cundall and Strack 1979; Hunt et al. 2003; Fakhimi and Villegas 2007; Shen et al. 2016), stiffness ratio of the springs and friction coefficient to govern the sliding of the grains. The stiffness ratio K of the sandstone was assigned in the DEM simulations corresponding to the evaluations using the conventional ultrasound method (Aydin 2014), and correlated with the current PSA methodology in the following section. The DEM simulations are performed primarily to assess the bulk strength measures such as the compressive and deviator strength (deviator stress) of sandstone subjected to the uni-axial compressive strength test and confined tri-axial strength test (Ulusay and Hudson 2007) under different levels of confining pressure. The outputs also include some information on the force distribution and velocity distribution of grains. However an extensive level of DEM analysis of strain localisation in sandstone (Charalampidou et al. 2011) is outside the scope of the current investigations.
3. Results and discussion
This is within the range of other studies reported, for example 16.5GPa obtained experimentally for the Berea sandstone (Ord et al. 1991) and 20GPa used in the simulations for China sandstone (Rong et al. 2013).
The distribution of retardation of light between the major and minor optical axis on the V-notch sample (which is proportional to maximum shear strain (Dally and Riley 1991)is visualised using reflective PSA (Fig.3) for different axial load levels. Using the point-scale measurement of orthogonal stress (/strain) components, assuming that the point is represented by contiguous spheres in contacts using the sphere model (Li and Fjær 2012, Fig.6) and the approximation between stress-force at grain contact as used by Mavko (Mavko et al. 2009), the granular force can be inferred for different loading increments as presented in Fig.5. From this, the optical anisotropy index K0 is inferred as 2.5. The standard deviation in K was ±0.21 from a large
number of repeated tests (about 50 samples). We also evaluated the stiffness ratio of the grains contact independently using the conventional ultrasound sensing methodology (Aydin 2014) which resulted the stiffness ratio K = 2.5±0.18. Based on this, K of sandstone is assigned as 2.5 in the DEM simulations, which is also comparable to K0 characterised using PSA. It is
worth pointing out that the K measured from the ultrasound method is based on the average response due to the contributions of all contacts in the experimental sample whereas the measurement of K0 is point based. Henceforth, K is used as an input parameter into DEM
modelling of the bulk strength of cylindrical sandstone sample at the later stage. Though not presented here, we had verified that the difference in results of DEM simulations by considering K0 and K as the input of stiffness ratio was negligible. However further studies are
required to establish the theoretical basis and exact correlations between K0 and K for
et al. 2013, Tang et al. 2013, Wang 2014). However, unlike measuring K in the current research, most of the above mentioned DEM studies calibrated the value of K (trial and error) by matching the simulation response to the experimental bulk strength of sandstone. Also the optical output presented in Fig.5 result the individual values of k1 and k2 as 6MN/m and 2.4MN/m. This can be compared reasonably well with the values of normal and shear stiffness of sandstone reported earlier in the literature, for example 7.1MN/m and 2.9MN/m respectively for Berea sandstone tested using ultrasound sensor under a confining pressure of 17MPa (Winkler 1983). Further investigations are needed to reveal the precise relations between K0
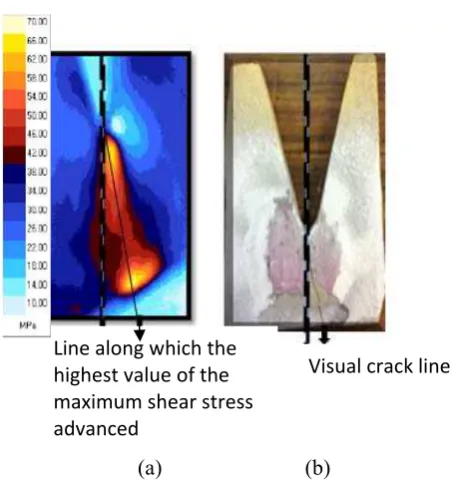
and K, which is outside the scope of the current paper. However, the significance of utilising the distribution of shear stress (/strain) on sandstone is emphasised further in Fig.8 for a typical sandstone V- notch sample under the vertical line loading (Fig.1) at the verge of its failure. In this, we observed that the path of propagation front of the maximum shear stress coincided well with the physical advancement of the major crack line. Hence the maximum shear stress (/strain) distribution (which can be visualised on the whole surface of sandstone) could be utilised well to probe the micromechanical properties of rock materials at both local and global scales in future. The input parameter used in the DEM simulations (including from the experimental characterisation results) are summarised in Table-1.
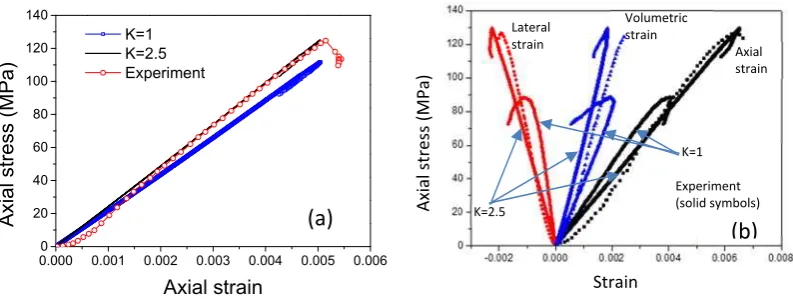
from both the DEM simulations (K=1, 2.5) and experiments under the UCS test condition discussed earlier. It shows the variation of the volumetric strain together with the axial and lateral strain measured simultaneously using conventional electrical strain gauges (Lawn 1993) mounted on the experimental samples under different levels of axial stress levels. A good level of agreement is obtained between the results of the simulations using measured K (=2.5) as input, and the experiments. Though the current study does not focus on other transport properties of sandstone, the dilation characteristics of rock samples are known to correlate to their permeability characteristics (Wang et al. 2016). The current modelling approach helps to obtain reliable measures of the dilation characteristics, hence enhancing its usefulness for such heterogeneous rock engineering research in future.
representation of the corresponding experimental data. A detailed investigation on the DEM results of internal characteristics of sandstone including strain localisation could be reported in future. However, having validated the DEM simulations with experiments here, the variation of the resultant velocity of the grains obtained from the DEM simulations are presented in Fig.11. In this, the visual image of the failed sandstone sample is also inserted for the comparison. It is quite interesting to note that the failure plane of the experimental and simulation samples agree fairly well (~45O) and this further confirms the validity of the
simulations and experiments reported in this research programme.
4. Conclusions
could also help to capture the post-peak strength predictions of the experiments, for example to examine in detail the snap-back behaviour of some of the bulk compressive strength and bulk deviator stress results presented in the current work. Another possibility to improve the
input to the DEM simulations is with regard to the approximation of considering the microscopic friction angle measured from the bulk friction test (using the bulk sample). However, measuring the microscopic friction for cementitious (/rock) materials in the true sense at grain scale is still not easy. Hence, in the present study, we had assumed it as same as from the bulk experimental test. It is shown here that K is shown to be more influential for the DEM simulations of sandstone than the effects of any potential difference between these two frictional values. This aspect needs further research to confirm.
REFERENCES
Adeyanju, OA, Olafuyi, OA (2012) Experimental studies of sand production from unconsolidated sandstone petroleum reservoirs in Niger-delta. Nijotech 30, 18-30
Amadei, B (1983) Rock anisotropy and the theory of stress measurements. Lecture notes in engineering 2, Springer-Verlag, New York
Antony, SJ (2015) Imaging shear stress distribution and evaluating the stress concentration factor of the human eye. Sci. Rep. 5:8899
Antony, SJ, Okeke, G, Tokgöz, D, Ozerkan, N (2017) Photonics and fracture toughness of heterogeneous composite materials. Sci. Rep. 7: 4539
Antony, SJ, Olugbenga, A, Ozerkan, N, Marumoame, O, Okeke, G (2016) Sensing temperature and stress distributions on rock samples under mechanical loading. ASCE Earth. Spa. Conf. Proc 1570207489
Appoloni, CR, Fernandes, CP, Rodrigues, CO (2007) X-ray microtomography study of a sandstone reservoir rock. Nucl. Instrum. Meth. 1:629-632
Baud, P, Klein, E, Wong, T (2004) Compaction localisation in porous sandstones: spatial evolution of damage and acoustic emission activity. Jl. Struc.Geol. 26: 603-624
Burnley, PC (2013) The importance of stress percolation patterns in rocks and other polycrystalline materials. Nat. Commun. 4:2117
Caputo, F, Giudice, G (1983) Photoelastic coating method approach to the study of stress distribution in composite materials. Fib. Sci.Tech.18:255-264
Charalampidou, E-M, Hall, SA, Stanchits, S, Viggiani, G, Lewis, H (2010) Experimental characterization of shear and compaction band mechanisms in porous sandstone by a combination of AE and 3D-DIC. EPJ Web.Conf. 6:22009
Charalampidou, E-M, Hall, SA, Stanchits, S, Lewis, H, Viggiani, G (2011) Characterization of shear and compaction bands in a porous sandstone deformed under triaxial compression. Technophy. 503: 8-17
Cundall, PA, Strack, ODL (1979) A discrete numerical model for granular assemblies. Geotechnique 29:47-65
Dally, JW, Riley, WF (1991) Experimental Stress Analysis, McGraw-Hill Inc, New York de Andrade, R, Stylolites, JR (2000): measurement of rock loss. Braz. J. Geol30.3:432-435 Donne, K et al (2008), Photoelastic stress and thermographic measurements of automotive windscreen defects generated by projectile impact. Qual. Reliab. Engng. Int 24:897–902 Dvorkin, J, Nur, A (1996) Elasticity of high-porosity sandstones: Theory for two North Sea data sets. Geophysics 5:1363-1370
Fairhurst, CE, Hudson, JA (1999) Draft ISRM suggested method for the complete stress-strain curve for intact rock in uniaxial compression. Int. J. Rock Mech. Min. Sci. 36:279-289
Fakhimi, A, Villegas, T (2004) Calibration of a discrete element model for rock failure envelope and tensile strength. In Shimizu, Y, Cundall, P (eds.) Numerical Modelling in Micromechanics via Particle Methods, 383-390
Fakhimi, A, Villegas, T (2007) Application of dimensional analysis in calibration of a discrete element model for rock deformation and fracture. Rock Mech Rock Eng 40:193–211
Hoek, E, Franklin, JA (1967) A simple triaxial cell for field or laboratory testing of rock, ICST, University of London, London
Hossain, Z, Mukerji, T, Dvorkin, J, Fabricius, I.L (2011) Rock physics model of glauconitic greensand from the North Sea. Geophysics 6:E199-E209
Hunt, SP, Meyers, AG, Louchnikov, V (2003) Modelling the Kaiser effect and deformation rate analysis in sandstone using the discrete element method. Comput Geotech 7:611-621 Lambert-Aikhionbare, DO, Shaw, HF (1982) Significance of clays in the petroleum geology of the Niger Delta. Clay Miner 17:91-103
Lawn, BR (1993) Fracture of brittle solids, Cambridge university press, Cambridge
Lesniak, JR, Zickel, MJ, Welch, CS, Johnson, DF (1997) An innovative polariscope for photoelastic stress analysis. Proc. SEM Spring conf. Exp. Mech., Bellevue, USA, 219-224 Li, L, Fjær, E (2012) Modeling of stress dependent static and dynamic moduli of weak sandstones. J Geophys Res: Solid Earth 117:WA103-WA112
Mavko, G, Mukerji, T, Dvorkin, J (2009) Tools for seismic analysis of porous media. The rock physics handbook, Cambridge university press, Cambridge
Nikitin, LV, Odintsev, VN (1999) A dilatancy model of tensile macrocracks in compressed rock. Fatigue Fract Eng M. 11:1003-1009
Ord, A, Vardoulakis, I, Kajewski, R (1991) Shear band formation in Gosford sandstone. Int. J. Rock Mech. Min. Sci. 28:397-409
Park, RG (2013) Foundation of structural geology, Routledge, Abingdon
Raghuwanshi, N, Parey, A (2015) Mesh stiffness measurement of cracked spur gear by photoelasticity technique, Measure 73:439–452
Razumovsky, IA (2011) Interference-optical methods of solid mechanics, Springer-Verlag, Berlin
Ren, XH, Wang, HJ, Zhang, JX (2012). Numerical study of AE and DRA methods in sandstone and granite in orthogonal loading directions. Water Sci. Eng 5:93-104
Rong, G, Liu, G, Hou, D, Zhou, CB (2013) Effect of particle shape on mechanical behaviors of rocks: A numerical study using clumped particle model. Scientific World J, 589215
Secor, DT (1965) Role of fluid pressure in jointing. Am. J. Sci 8:633-646
Shen, Z, Jiang, M and Thornton, C (2016) DEM simulation of bonded granular material. Part I: Contact model and application to cemented sand, Compu. Geotec. 75: 192–209
Tang, CL, Hu, JC, Lin, ML, Yuan, RM, Cheng, CC (2013) The mechanism of the 1941 Tsaoling landslide, Taiwan: insight from a 2D discrete element simulation. Environ. Earth Sci. 70, 1005-1019
Timoshenko, SP, Goodier, JN (1970) Theory of Elasticity, McGraw-Hill, New York
Towhata, I (2008) Prediction of permanent displacement due to liquefaction. Springer Series in Geomech Geoengg 537-587, Berlin, Heidelberg
Ulusay R., Hudson, J.A (2007). The complete ISRM suggested methods for rock characterization, testing and monitoring: ISRM Commission on Testing Methods, 1974-2006, ISRM Turkish National Group, Turkey
van der Pluijm, BA, Marshak, S (2004) Earth Structure, Second Edition, W.W. Norton & Company Inc, London
Waltham, T (2001) Foundations of engineering geology, CRC Press, London
Wang, H, Xu, W, Jia, C, Cai, M, Meng, Q (2016) Experimental research on permeability evolution with microcrack development in sandstone under different fluid pressures. J. Geotech. Geoenviron. Eng. 142, 04016014
Wang, S, et al (2014) Rock-arch instability characteristics of the sandstone plate under different loading conditions. Adv. Mater Sci. Eng 950870
Winkler, KW (1983) Contact stiffness in granular porous materials: comparison between theory and experiment. Geophys. Res. 11:1073-1076
Yoon, J (2007) Application of experimental design and optimization to PFC model calibration in uniaxial compression simulation. Int. J. Rock Mech. Min. Sci. 6: 871-889
Zang, A, Stephansson, O (2009) Stress Field of the Earth, Springer-Netherland, Netherlands Zhang, H, Huang, G, Song, H, Kang, Y (2013) Experimental characterization of strain localization in rock. Geophys. J. Int. 194:1554-1558
ACKNOWLEDGEMENT
Figure captions:
Figure 1: Schematic diagram of the V-notch sandstone sample subjected to an axial line-loading (quasi-static) across its thickness (all dimensions are in mm).
Figure 2: Experimental set ups: (a) uni-axial compression machine and (b) tri-axial compression machine, also with the facility of ultrasound sensing of the samples.
Figure 3: Basic optical elements of reflective PSA setup for sensing retardation of principal components of light and maximum shear stress distribution on the surface of sandstone under axial loading. The contours pertain to different order of the fringes.
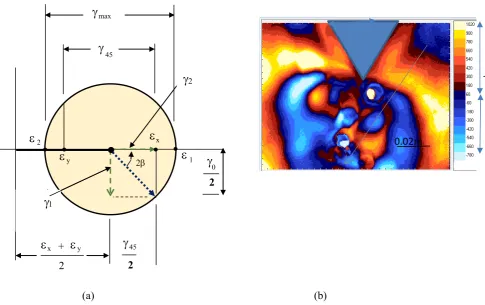
Figure 4: (a) Illustrative diagram of strain (/stress) components using Mohr’s circleand (b) A typical image (magnified) of maximum shear strain distribution in the V-notch sample under the external normal loading (in PSA camera micro strain unit for illustration purpose of the heterogeneous distribution of shear beneath the notch tip under loading). The red and blue regions depicts the corresponding strains: in the dominantly positive ( ) and negative regions ( ) (default arrow seen in the image could be ignored).
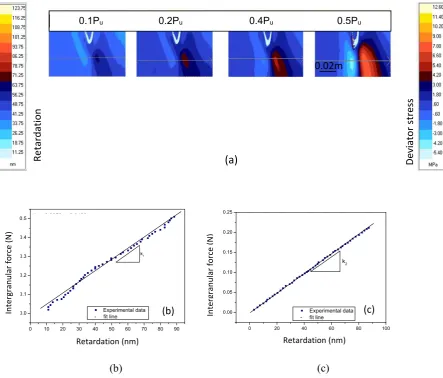
Figure 5: (a) Typical evolution of retardation (nm) and deviator stress (MPa) of the sample for an increase in external load level P (presented in fractions of the ultimate load Pu). Such maps are generated for a number of incremental loads and the outputs are analysed to interpret k (methods section): (b) k1 (c) k2 (For the fit line of both plots, R2>0.95. The data for the initial stages are only plotted here as the primary purpose is to get the slope of these variations).
Figure 6: (a)Illustration of a typical neighbouring grains. Later in the DEM simulations, the contiguous grains’ contact is modelled using spheres with bond strength pertaining to the cementitious bond between the grains. The grains experience the loading broadly in three stages (stages 1-3) (b) basic grain elements used in the DEM simulations. Values shown within the brackets are the proportion of particles used in the simulation sample to achieve the required average coordination number and porosity of the initial sandstone assembly.
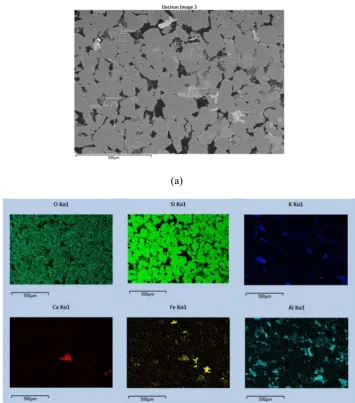
Figure 7: Scanning Electron Microscope (SEM) Image of Niger Delta sandstone. (a) Grain-scale image of sandstone (b) Map of elemental composition in the SEM image of sandstone
Figure 8: (a) The variation of maximum shear stress in the V-notch sandstone rock sample at the verge of failure load (b) for the same sample, the visual crack path is provided. We observed that the advancement of the major crack line (/crack path) coincided with the path of maximum shear stress propagation.
Figure 9: (a) Variation of the compressive strength of sandstone obtained from the UCS test (b) Variation of volumetric, axial and lateral strains of the sandstone during loading. In these plots, the DEM results for the cases of K=1 and 2.5 are compared with the experimental result.
Figure 10: Variation of the macroscopic deviator stress during the tri-axial loading under different levels of confining pressure: (a) 5MPa (b) 10MPa (c) 15MPa and (d) 20 MPa. In these plots, the DEM results for the case of K=1 and 2.5 are compared with corresponding experimental results.
below the respective images in metre. The thickness of the arrows is proportional to the magnitude of the respective measures and (c) a typical visual image of the experimental sample at failure. The failure plane is similar to that of displacement (/velocity) discontinuities in the simulation samples at the verge of failure (~45o).
Table caption
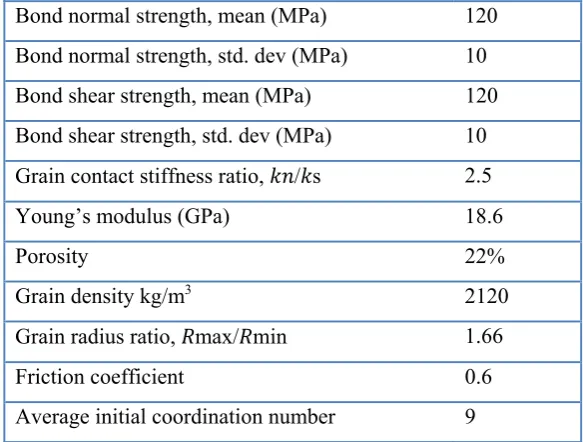
Table 1: Grain Contact parameters used in the DEM simulations to analyse the mechanical properties of Niger Delta sandstone
Bond normal strength, mean (MPa) 120
Bond normal strength, std. dev (MPa) 10
Bond shear strength, mean (MPa) 120
Bond shear strength, std. dev (MPa) 10
Grain contact stiffness ratio, / s 2.5
Young’s modulus (GPa) 18.6
Porosity 22%
Grain density kg/m3 2120
Grain radius ratio, max/ min 1.66
Friction coefficient 0.6
[image:26.595.218.383.93.318.2]
Figure 1: Schematic diagram of the V-notch sandstone sample subjected to an axial line-loading (quasi-static) across its thickness (all dimensions are in mm).
(a)
[image:27.595.168.433.70.389.2]
(b)
Figure 2: Experimental set ups: (a) uni-axial compression machine and (b) tri-axial compression machine, also with the facility of ultrasound sensing of the samples.
Servo
Data logger
Typical Sandstonespecimens
90mm
38mm
Pulse generator
Transmitter & receiver Kit
Confined
Pressure
Figure 3: Basic optical elements of reflective PSA setup for sensing retardation of principal components of light and maximum shear stress distribution on the surface of sandstone under axial loading. The contours pertain to different order of the fringes.
Elliptically polarised
(retarded light signals) Retarded light signal is analysed at the direction of interest
Circularly polarised
(raw camera unit) 1 x 0 2 45 2
max 45 2 y y
x +
2
Shear / 0
Shear 45 (a) (b)
Figure 4: (a) Illustrative diagram of strain (/stress) components using Mohr’s circleand (b) A typical image (magnified) of maximum shear strain distribution in the V-notch sample under the external normal loading (in PSA camera micro strain unit for illustration purpose of the heterogeneous distribution of shear beneath the notch tip under loading). The red and blue regions depicts the corresponding strains: in the dominantly positive ( ) and negative regions ( ) (default arrow seen in the image could be ignored).
[image:29.595.75.561.76.381.2]
(b) (c)
Figure 5: (a) Typical evolution of retardation (nm) and deviator stress (MPa) of the sample for an increase in external load level P (presented in fractions of the ultimate load Pu). Such maps are generated for a number of incremental loads and the outputs are analysed to interpret k (methods section): (b) k1 (c) k2 (For the fit line of the plots, R2≈0.99. The data for the initial stages are only plotted here as the primary purpose is to get the slope of these variations).
(b) (c)
0 10 20 30 40 50 60 70 80 90 0.0 0.1 0.2 0.3 0.4 0.5 Experimental data - fit line
F o rc e , P n (N )
Optical retardation, (nm)
k1
Pn = 0.0059 - 0.0189
R2
= 0.9923
Retardation (nm)
In te rg ran u lar fo rc e (N )
0 20 40 60 80 100
0.00 0.05 0.10 0.15 0.20 0.25 Experimental data - fit line
F o rc e , P s (N )
Optical retardation, (nm) k2
Ps = 0.0024 - 0.0004 R2
= 0.9997
Retardation (nm)
In te rg ran u lar fo rc e (N ) (a) 0.02m
0.1Pu 0.2Pu 0.4Pu 0.5Pu
[image:30.595.75.519.95.473.2](a)
[image:31.595.102.503.72.333.2]
(b)
Figure 6: (a)Illustration of a typical neighbouring grains. Later in the DEM simulations, the contiguous grains’ contact is modelled using spheres with bond strength pertaining to the cementitious bond between the grains. The grains experience the loading broadly in three stages (stages 1-3) (b) basic grain elements used in the DEM simulations. Values shown within the brackets are the proportion of particles used in the simulation sample to achieve the required average coordination number and porosity of the initial sandstone assembly.
Grain 1
Grain 2
(a)
[image:32.595.118.474.70.474.2](b)
Figure 7: Scanning Electron Microscope (SEM) Image of Niger Delta sandstone. (a) Grain-scale image of sandstone (b) Map of elemental composition in the SEM image of sandstone
(a) (b)
Figure 8: (a) The variation of maximum shear stress in the V-notch sandstone rock sample at the verge of failure load (b) for the same sample, the visual crack path is provided. We observed that the advancement of the major crack line (/crack path) coincided with the path of maximum shear stress propagation.
Line along which the highest value of the maximum shear stress
advanced
[image:33.595.255.483.108.352.2]
Figure 9: (a) Variation of the compressive strength of sandstone obtained from the UCS test (b) Variation of volumetric, axial and lateral strains of the sandstone during loading. In these plots, the DEM results for the cases of K=1 and 2.5 are compared with the experimental result.
0.0000 0.001 0.002 0.003 0.004 0.005 0.006
20 40 60 80 100 120 140 A x ia l st re ss (MP a ) Axial strain K=1 K=2.5 Experiment
(a) A
x ial str e ss (MP a) Strain Lateral strain Volumetric strain Axial strain
K=1
Experiment
(solid symbols) K=2.5
[image:34.595.113.510.162.314.2]
Figure 10: Variation of the macroscopic deviator stress during the tri-axial loading under different levels of confining pressure: (a) 5MPa (b) 10MPa (c) 15MPa and (d) 20 MPa. In these plots, the DEM results for the case of K=1 and 2.5 are compared with corresponding experimental results.
0.000 0.002 0.004 0.006 0.008
0 50 100 150 K=1 K=2.5 Experiment D e vi a to r st re ss (MPa ) Axial strain (a)
0.000 0.002 0.004 0.006 0.008
0 50 100 150 (b) K=1 K=2.5 Experiment D e vi a to r st re ss (MPa ) Axial strain
0.000 0.002 0.004 0.006 0.008 0.010
0 50 100 150 (c) K=1 K=2.5 Experiment D e vi a to r st re ss (MPa ) Axial strain
0.000 0.002 0.004 0.006 0.008
(a)
1.028e-7 4.217e-7 2.438e-5 9.043e-2
[image:36.595.110.384.70.339.2](b) (c)
Figure 11: Typical variation of the (a) resultant velocity of grains and plots are presented for a vertical section passing through the middle of the sample (front view): (i) initial state (ii-iii) intermediate states (iv) at the verge of failure (b) resultant displacement of the grains at different stages of loading (confining pressure 15MPa). However the maximum value of the resultant displacement is entered below the respective images in metre. The thickness of the arrows is proportional to the magnitude of the respective measures and (c) a typical visual image of the experimental sample at failure. The failure plane is similar to that of displacement (/velocity) discontinuities in the simulation samples at the verge of failure (~45o).