Open Access
Research article
Cohort effects in dynamic models and their impact on vaccination
programmes: an example from Hepatitis A
Arni SR Srinivasa Rao
1, Maggie H Chen
2, Ba' Z Pham
5, Andrea C Tricco
5,
Vladimir Gilca
4, Bernard Duval
4, Murray D Krahn
3and Chris T Bauch*
1Address: 1Department of Mathematics and Statistics, University of Guelph, Guelph, Canada, 2Toronto General Hospital and University Health Network, Toronto, Canada, 3Department of Health Policy, Management and Evaluation, University of Toronto and University Health Network, Toronto, Canada, 4Institut national de santé publique Québec, Québec City, Canada, and Research Centre, Centre hospitalier universitaire de Québec, Québec City, Canada and 5BioMedical Data Sciences, GlaxoSmithKline, Toronto, Canada
Email: Arni SR Srinivasa Rao - [email protected]; Maggie H Chen - [email protected]; Ba' Z Pham - [email protected]; Andrea C Tricco - [email protected]; Vladimir Gilca - [email protected]; Bernard Duval - [email protected]; Murray D Krahn - [email protected]; Chris T Bauch* - [email protected]
* Corresponding author
Abstract
Background: Infection rates for many infectious diseases have declined over the past century. This has created a cohort effect, whereby older individuals experienced a higher infection rate in their past than younger individuals do now. As a result, age-stratified seroprevalence profiles often differ from what would be expected from constant infection rates.
Methods: Here, we account for the cohort effect by fitting an age-structured compartmental model with declining transmission rates to Hepatitis A seroprevalence data for Canadian-born individuals. We compare the predicted impact of universal vaccination with and without including the cohort effect in the dynamic model.
Results: We find that Hepatitis A transmissibility has declined by a factor of 2.8 since the early twentieth century. When the cohort effect is not included in the model, incidence and mortality both with and without vaccination are significantly over-predicted. Incidence (respectively mortality) over a 20 year period of universal vaccination is 34% (respectively 90%) higher than if the cohort effect is included. The percentage reduction in incidence and mortality due to vaccination are also over-predicted when the cohort effect is not included. Similar effects are likely for many other infectious diseases where infection rates have declined significantly over past decades and where immunity is lifelong.
Conclusion: Failure to account for cohort effects has implications for interpreting seroprevalence data and predicting the impact of vaccination programmes with dynamic models. Cohort effects should be included in dynamic modelling studies whenever applicable.
Published: 05 December 2006
BMC Infectious Diseases 2006, 6:174 doi:10.1186/1471-2334-6-174
Received: 14 July 2006 Accepted: 05 December 2006
This article is available from: http://www.biomedcentral.com/1471-2334/6/174
© 2006 Srinivasa Rao et al; licensee BioMed Central Ltd.
Background
Hepatitis AHepatitis A virus (HAV) is endemic in most countries [1-4], although infection rates continue to decline as hygiene and sanitation improve [5]. Infection is often subclinical in children but the majority of infected adults develop clinical symptoms, and often do not seek medical atten-tion [5,6]. The severity of HAV infecatten-tion increases with age and is particularly severe for those with underlying chronic liver disease [7-10]. The rate of mortality attribut-able to HAV increases by age from a 0.2% in symptomatic young adults to 3.9% in symptomatic adults over the age of 80 [11]. The clinical illness usually lasts 4 weeks and symptoms include nausea, loss of appetite, fatigue, fever, abdominal pain and jaundice [6].
HAV is transmitted by the fecal-oral route. Chronic infec-tion does not occur [12], and immunity appears to be life-long [7]. Traditionally, children have played a prominent role in transmission due to poor hygiene and the high probability of subclinical infection [13]. The reported incidence in Canada from 1980–1994 was twice as high in the 5–9 age groups as in other age groups [14], and once the reduced probablility of clinical infection in chil-dren is taken into account [6,15-19], true infection rates in children are seen to be significantly higher than in adoles-cents and adults. Approximately 25–50% of clinical cases have unidentified risk factors [20]. Many of these may have been contacts of children with subclinical infection.
In Canada, HAV is not endemic and transmission is pri-marily person-to-person [5] with rare foodborne out-breaks [21]. Risk factors for contracting HAV are often unidentified [20,21], but known risk factors include membership in high risk groups (including men who have sex with men, injection drug users and the home-less), low socioeconomic conditions [22], membership in socially-contained religious communities [23-25], and travel to endemic areas [26,27]. The latter is a particularly significant risk factor in Canada. Secondary infections from index cases infected abroad [25,28,29] and intra-household transmission [30] are also significant. From 1980 to 1994 (the year of vaccine licensure in Canada), the average incidence of reported cases was 6.3 per 100,000 per year [14] (Figure 1).
Case reports reveal when clinical infections occur, but they do not account for subclinical infection and under-reporting [1,5]. By comparison, seroprevalence data can accurately determine what proportion of individuals have been infected by a given time, but cannot say when the infection occurred. Estimates of true infection rates usu-ally rely upon seroprevalence surveys and/or case report-ing data. Catalytic modellreport-ing uses integral equations to reconcile case reporting and seroprevalence data via
statis-tical regression, yielding estimates of the true infection rates and how they have evolved over time. According to estimates from catalytic modelling, infections are under-reported by a factor of 10 in the United States [31,32].
Cohort effects
To date, there is no representative national seroprevalence survey for HAV in Canada. However, an approximate age-stratified seroprevalence profile has recently been synthe-sized from various independent surveys by the method of systematic review [33]. The resulting profile is both rea-sonable and consistent with the profile observed in the NHANES (National Health and Nutrition Examination Survey) II and III surveys in the United States [31]. The observed seroprevalence in Canada and the United States is too low in the youngest age classes and too high in older age classes to be consistent with the assumption of con-stant infection rates over time. Instead, it is necessary to posit that infection rates were higher in past decades due to a lower level of sanitation and hygiene [34]. This is usu-ally described as a cohort effect [5]. Cohort effects have also been observed in other populations [34,35].
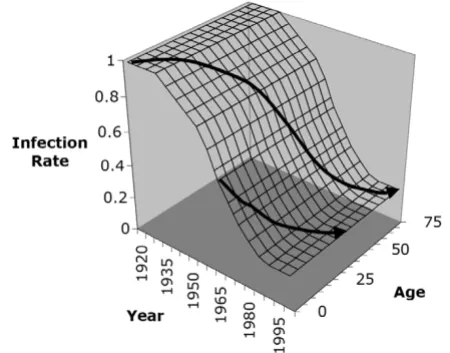
The presence of cohort effects in seroprevalence data is widely recognized. However it is difficult to characterize cohort effects without a mathematical model since the two dimensions involved – age class and calendar year – are easily confounded. Figure 2 illustrates how two cohorts born at different times experience different infec-tion rate histories, when infecinfec-tion rates decline over time. The expected seroprevalence for a given cohort can be thought of as an integration of the infection rate history over the cohort's life history path in Figure 2. When infec-tion rates have been constant over time, age-stratified
Hepatitis A incidence in Canada (number of cases per 100,000 per year), 1978–2003
Figure 1
seroprevalence profiles have a convex shape, increasingly monotonically with age but with progressively smaller increases for increasing age. However, when a strong cohort effect is present due to rapidly declining infection rates, an S-shaped age-stratified seroprevalence profile should be observed.
Goals of study
Few dynamic models have been developed for HAV, com-pared to other common infectious diseases [34,36-38]. Dynamic modelling studies and other studies which esti-mate infection rates for many diseases often do not take the cohort effect into account, resulting in inaccurate pre-dictions. Here we develop and analyze a dynamic model for Hepatitis A in Canada. Our goal is to quantify how infection rates have declined over the past century, to illustrate how dynamic models which include the cohort effect can reconcile case reporting data and seroprevalence data, and to illustrate how the predicted impact of vacci-nation on incidence and mortality varies depending on whether the cohort effect is accounted for in the dynamic model.
Methods
Compartmental model
We develop an age-structured compartmental model to study HAV transmission and vaccination in Canada. The literature on age-structured compartmental models is well-established and has developed extensively since the
mid-1980s [39]. Such models have long been applied to infectious diseases where natural immunity is lifelong and transmission is primarily person-to-person, as is the case for HAV in Canada. They have been validated against epi-demiologic data [39-42] and have been used by health authorities in decision making processes for vacination policy [43]. Our SEIRV (Susceptible-Exposed-Infectious-Recovered-Vaccinated) compartmental model allocates all members of the population into mutually exclusive compartments according to age class and epidemiologic status: the number susceptible (Si), exposed (infected but not yet infectious, Ei), infectious (Ii), recovered (Ri), and vaccinated (Vi) in each age class i. The age classes are 0–4, 5–9, 10–19, 20–29, 30–39, 40–59 and 60+, chosen to reflect age categories in available sources of demographic and epidemiologic data.
Flow rates between compartments are defined by model parameters. Exposed individuals enter the infectious com-partment at rate δ, and infectious individuals enter the recovered compartment at rate γi, thereafter retaining life-long immunity. Individuals in age class i are vaccinated at per capita rate gi thereby entering the vaccinated compart-ment, and vaccinated individuals lose their immunity at per capita rate f, re-entering the susceptible compartment. Individuals are born susceptible at rate b, and when a given birth cohort enters the next highest age class, a pro-portion di of them die. Maternal immunity is short-lived and affects relatively few individuals in a non-endemic country such as Canada, so we do not include it [5]. HAV in Canada is spread primarily person-to-person [5]. Hence we do not model foodborne or waterborne outbreaks. The transmission rates and the model for the cohort effect are described in the following subsections. The model is parameterized using data from the clinical literature [44-50], demographic [51] and travel data [26,52-55], case reports [14], and seroprevalence suveys [33]. Model equa-tions appear in Additional File 1 and the parameterization is described in Additional File 2. A diagram of the model appears in Figure 3.
Travel transmission rates
Estimates of the proportion of HAV cases attributable to travel in endemic countries range from 26% to 40%, depending upon the year and location [26,53-55]. A con-siderably higher proportion of cases are attributable to travel in younger age classes than in older age classes [55]. The predicted impact of vaccination, and the fit of the model to the data, can vary significantly depending on whether travel-related incidence is accounted for. Here we include travel-related incidence in our model.
If λi denotes the total infection rate in age class i (the rate at which a susceptible individual in age class i becomes
[image:3.612.60.285.444.621.2]Illustration of the cohort effect for an idealized situation of no age dependence in infection rates
Figure 2
Illustration of the cohort effect for an idealized
situa-tion of no age dependence in infecsitua-tion rates. The top
infected), and if κi denotes the proportion of infections in age class i attributable to travel in endemic countries, then clearly τi = κi λi where τi is the travel transmission rate, ie, the rate at which a susceptible person in age class i becomes infected due to travel in an endemic country. Let
i be the average travel transmission rate for 1980–1994. We estimate i from the average force of infection λi from 1980–1994 as estimated by catalytic modelling, and from average κi values for 1980–1994, estimated from surveys on HAV risk factors (Additional File 2) [26,53-55].
Domestic transmission rates
Since the contribution to the infection rate from travel-related transmission is κi λi, the remainder (1 - κi)λi is the contribution from domestic transmission. The domestic transmission rate βij is the rate at which a susceptible indi-vidual of age class i in Canada is infected by infectious individuals of age class j in Canada. The resulting matrix of 7 × 7 domestic transmission rates form a WAIFW (Who Acquires Infection From Whom) matrix. By specifying a
structure for the WAIFW matrix, the average values of λi
and κi for 1980–1994 can be used along with estimated true incidence Ii and data from seroprevalence surveys
[33] to determine the domestic transmission rates ij for
1980–1994 by solving the equation
(Additional File 2).
Modelling the cohort effect
We have estimated the average travel transmission rate i
and the average domestic transmission rate ij for the years 1980–1994. The model could be simulated without including the cohort effect by assuming constant values βij
= ij and τi = i for all time. To include the cohort effect,
these constant values must be replaced by time-varying values βi = βi (t) and τi = τi (t).
To a good approximation, the per capita annual volume of travel by Canadian residents to HAV-endemic countries τ
τ
β
(1−κ λi) i =
∑
7j=1βijIj/Njτ β
β τ
Diagram of the SEIRV model
Figure 3
has increased quadratically since 1952, following the regression y = 2.38 × 10⁻⁵ t2 + 1.52 × 10⁻³ t + 2.98 × 10⁻³ (R2
= 0.98) [52]. Hence, it is possible to estimate a time-vary-ing travel transmission rate, τi (t), by assuming that τi (t) increased over the past half century according to the same quadratic regression, rescaled to match the known average value i for 1980–1994 (Additional File 2).
Additionally, the domestic transmission rate βi (t) can be
assumed to obey βij (t) = ij F (t) = ij [L + H (1 - tanh(A(t - T)))], where tanh(t) = (exp(2t) - 1)/(exp(2t) + 1) is the hyperbolic tangent function. The function F(t) describes a continuous decline from an upper bound to a lower bound. The parameter L determines the lower bound attained for sufficiently large time t, L+H determines the upper bound attained for sufficiently small t, T deter-mines the timing of the transition between these upper and lower bounds, and A controls how abrupt the transi-tion is.
We estimated L, H, T and A by exploring a plausible region of LHTA parameter space with fine resolution and mini-mizing the least-squares error between predicted seroprev-alence values and the observed values from the 11 seroprevalence surveys for Canadian-born individuals of distinct age classes and survey years, between 1980 and 1994 [27,33,56-58]. It was assumed that τi = τi (t) as esti-mated above. With this method we obtained L = 0.73, H = 0.84, A = 0.038, T = 1960.
A previous study has also captured cohort effects by fitting a function for declining infection rates to age-stratified seroprevalence data [34]. The main differences with the previous study are that the current study includes infec-tion due to travel in endemic countries and also explores how including the cohort effect changes the predicted impact of vaccination.
Uncertainty analysis
To derive uncertainty intervals we applied the Latin hyper-cube method [59] to those parameters with the least cer-tain values: the infection rates as estimated from catalytic modelling (λi), the duration of infectiousness (γi) and the proportion of travel-related incidence (κi). For each sam-pled parameter set, the model was fitted as before to the seroprevalence data to obtain values for L, H, T, and A and then seroprevalence and incidence were computed. Details appear in Additional File 3.
Results
Declining transmissibility
If infection rates are assumed to be unchanged over the
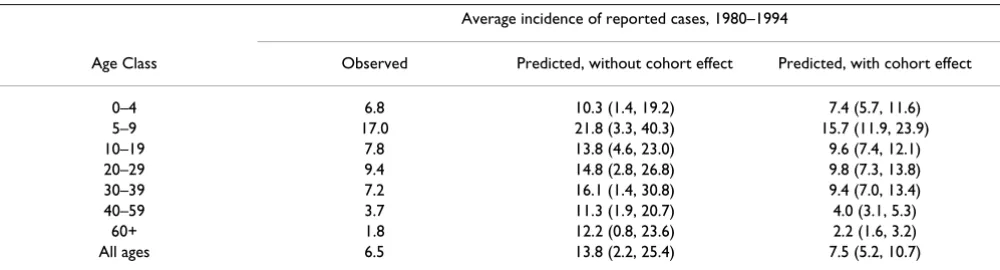
past century (ie, constant transmission rates ij and i are assumed) then the modelled seroprevalence profile exhibits a large error relative to the observed data from the 11 seroprevalence surveys for Canadian-born individuals (Table 1) [27,33,56-58]. The predicted seroprevalence is too large in the youngest age classes and too small in the oldest age classes. The predicted incidence is significantly larger than observed incidence for all age classes (Table 2).
By comparison, there is good agreement between fitted and observed seroprevalence when infection rates βij (t) and τi (t) evolve over time as described in Methods (Table 1). Accounting for the cohort effect through a declining transmissibility function explains most of the difference between fitted and observed seroprevalence (R2 = 0.97).
The remaining discrepancies may partly be due to other heterogeneities not accounted for, such as outbreaks in high risk groups during specific periods, or constraints inherent to the hyperbolic tangent model. The fitted sero-prevalence remains somewhat high in the younger age classes and somewhat low in the older age classes. The agreement between predicted and observed incidence also improves dramatically once the cohort effect is included (Table 2). Observed incidence values fall within 96% uncertainty intervals of the predicted values. A piecewise exponential function for F(t) yields similar results.
Figure 4 illustrates the time evolution of transmissibility F(t) over the past century from the fitted model. Transmis-sibility has dropped by a factor of 2.8 since the 1920s. The period of most rapid change was from 1950 to 1970, which is consistent with an era of rapid improvements in hygiene and sanitation in Canada, due ultimately to post-war economic growth.
Universal vaccination
Here we compare the predicted effects of universal vacci-nation in Canada over 20-year and 50-year periods start-ing in 2006, with and without inclusion of the cohort effect in the dynamic model. For the case of constant transmissibility (cohort effect is not included), transmis-sion rates in the vaccine era are assumed to be constant (βij
= ij τi = i, as in Methods). For the case of declining transmissibility (cohort effect is included), transmission rates in the vaccine era are given by βij = βij (t), τi = τi (t), the same functions used to fit the model to the seropreva-lence surveys but extrapolated to the vaccine era. The effects of the targeted policy in place from 1995 to the τ
β β
β τ
present are accounted for by reducing the travel transmis-sion rate until the reported age-specific incidence from 1995–2005 is recovered, and thereafter the targeted policy is discontinued. Other parameters are unchanged from 1980–1994 values. Vaccination is applied to 4-year-olds and calls for two doses of vaccine with 70% compliance and 97% vaccine efficacy [49,50]. Vaccination occurs at age 4 because this would allow Hepatitis A vaccination to be efficiently scheduled along with other currently-administered vaccines in Canada. The assumed rate of waning of vaccine-derived immunity was 1.65% per year [47], which is a conservative assumption since cell-medi-ated immunity may actually result in lifetime protection.
Over both 20- and 50-year periods, failure to include the cohort effect over-estimates incidence and mortality, both
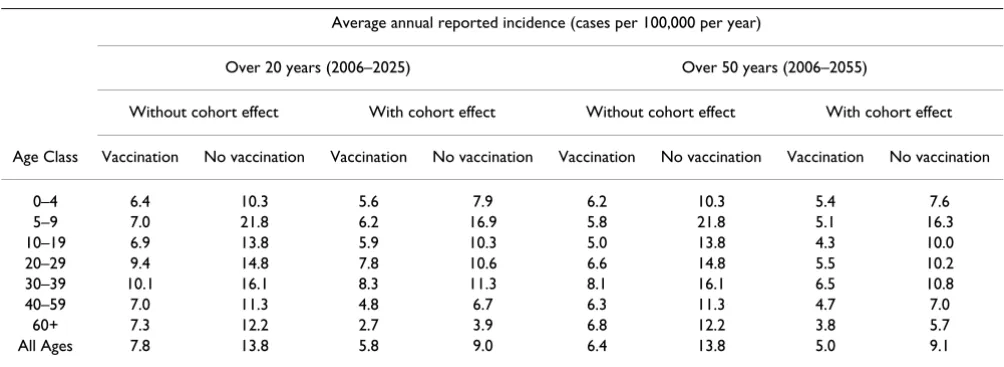
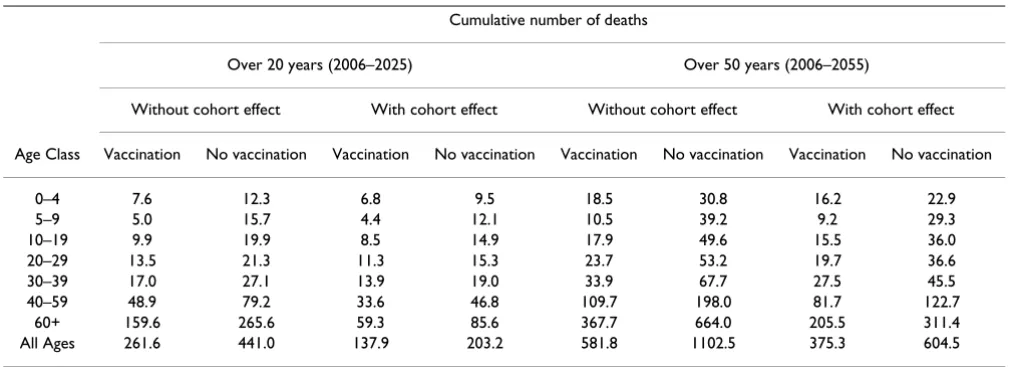
with and without vaccination (Tables 3, 4). If the cohort effect is not included, the average reported incidence over 20 years is predicted to be 7.8 per 100,000 per year. If the cohort effect is included, it is 5.8 per 100,000 per year. Likewise, the cumulative number of deaths attributable to HAV over 20 years is predicted to be 262 instead of 138. Hence, from the perspective of absolute incidence in the vaccine era, not including the cohort effect will under-esti-mate the effectiveness of vaccination.
[image:6.612.59.550.121.289.2]On the other hand, from the perspective of percentage reductions in incidence and mortality brought on by vac-cination, the effectiveness of vaccination can be signifi-cantly over-estimated if the cohort effect is not included. In this case the percentage reduction in incidence (respec-tively mortality) due to vaccination is 43% (respec(respec-tively
Table 2: Average observed incidence of reported cases (per 100,000 per year) versus predicted incidence of reported cases for the case of constant domestic (βij = ij) and travel (τi = i) transmission rates, and for the case of time-varying domestic (βij = βij (t)) and travel (τi = τi (t)) transmission rates, from 1980–1994.
Average incidence of reported cases, 1980–1994
Age Class Observed Predicted, without cohort effect Predicted, with cohort effect
0–4 6.8 10.3 (1.4, 19.2) 7.4 (5.7, 11.6)
5–9 17.0 21.8 (3.3, 40.3) 15.7 (11.9, 23.9)
10–19 7.8 13.8 (4.6, 23.0) 9.6 (7.4, 12.1)
20–29 9.4 14.8 (2.8, 26.8) 9.8 (7.3, 13.8)
30–39 7.2 16.1 (1.4, 30.8) 9.4 (7.0, 13.4)
40–59 3.7 11.3 (1.9, 20.7) 4.0 (3.1, 5.3)
60+ 1.8 12.2 (0.8, 23.6) 2.2 (1.6, 3.2)
All ages 6.5 13.8 (2.2, 25.4) 7.5 (5.2, 10.7)
The quantities in brackets represent 96% uncertainty intervals (see Methods).
[image:6.612.55.555.583.718.2]β τ
Table 1: Observed seroprevalence versus fitted seroprevalence for the the case of constant domestic (βij = ij) and travel (τi = i) transmission rates, and for the case of time-varying domestic (βij = βij (t)) and travel (τi = τi (t)) transmission rates.
Seroprevalence
Age class, year, survey Observed Fitted, without cohort effect Fitted, with cohort effect
0–4, 1981, Ref. 58 0.0024 0.014 0.009
5–9, 1981, Ref. 58 0.0024 0.047 0.030
10–19, 1988, Ref. 59 0.0063 0.068 0.046
10–19, 1995, Ref. 27 0.0299 0.068 0.048
10–19, 1981, Ref. 57 0.0632 0.068 0.049
20–29, 1988, Ref. 59 0.103 0.082 0.064
20–29, 1980, Ref. 57 0.114 0.082 0.129
30–39, 1988, Ref. 59 0.287 0.097 0.171
40–59, 1980, Ref. 57 0.599 0.115 0.618
40–59, 1988, Ref. 59 0.550 0.115 0.491
60+, 1988, Ref. 59 0.820 0.137 0.745
The seroprevalence values listed under "Observed", "Without cohort effect" (fitted model, constant case) and "With cohort effect" (fitted model, time-varying case) are for the timepoints specified in the first column.
83%) over a 20-year period if the cohort effect is not included. These figures are 23% (respectively 73%) when the cohort effect is included. Patterns are similar over 50 years. The drop in mortality brought on by vaccination is largest in the oldest age classes since older individuals tend to be at a higher risk for mortality attributable to HAV.
The absolute and relative differences between incidence and mortality with and without vaccination, over 20-year and 50-year periods, are also larger when the cohort effect is not included.
We note that the average annual reported cases and deaths are somewhat higher over the 50-year period than the 20-year period (Tables 3 and 4). This occurs because the travel transmission rate after 2006 continues to climb according to our fitted function τi = τi (t) that reflects long-term historical trends in travel. Hence, the number of individuals infected through travel to HAV-endemic countries continues to rise, while the fall in the domestic transmission rate βij = βij (t) after 2006 is much more mod-erate. Another possible reason for this effect is that a decrease in incidence in the younger, recently-vaccinated age classes is offset by an increase in incidence in the older age classes, who are increasingly susceptible as more time passes since the cessation of the (all-ages) targeted policy in 2006. We have assumed that vaccine-derived immunity wanes, and so not all individuals vaccinated as children retain their immunity when older. Older age classes also experience higher rates of mortality attributable to HAV, so the net number of deaths can increase over time.
Discussion
These results indicate that the presence of a cohort effect can significantly alter the impact of vaccination. The implicit assumption that infection rates have always been constant is frequently made in modelling studies, but it is incorrect for many common infectious diseases. Failure to include the cohort effect overestimates incidence and mortality both before and after introduction of universal vaccination, as well as the percentage reduction achieved by universal vaccination.
[image:7.612.61.280.110.267.2]Cohort effects are not immediately obvious in case report-ing data or seroprevalence survey data. In seroprevalence data, it is often difficult to disentangle the two dimensions – calendar year and age – that are present in any set of seroprevalence surveys (Figure 2). In case reporting data, there is not a simple one-to-one relationship between
Table 3: Predicted annual incidence of reported cases, with and without including the cohort effect in the dynamic model.
Average annual reported incidence (cases per 100,000 per year)
Over 20 years (2006–2025) Over 50 years (2006–2055)
Without cohort effect With cohort effect Without cohort effect With cohort effect
Age Class Vaccination No vaccination Vaccination No vaccination Vaccination No vaccination Vaccination No vaccination
0–4 6.4 10.3 5.6 7.9 6.2 10.3 5.4 7.6
5–9 7.0 21.8 6.2 16.9 5.8 21.8 5.1 16.3
10–19 6.9 13.8 5.9 10.3 5.0 13.8 4.3 10.0
20–29 9.4 14.8 7.8 10.6 6.6 14.8 5.5 10.2
30–39 10.1 16.1 8.3 11.3 8.1 16.1 6.5 10.8
40–59 7.0 11.3 4.8 6.7 6.3 11.3 4.7 7.0
60+ 7.3 12.2 2.7 3.9 6.8 12.2 3.8 5.7
All Ages 7.8 13.8 5.8 9.0 6.4 13.8 5.0 9.1
[image:7.612.54.556.547.730.2]HAV transmissibility over time, as determined from fitting the dynamic model to seroprevalence data
Figure 4
HAV transmissibility over time, as determined from
fitting the dynamic model to seroprevalence data.
reported incidence and true infection rates, particularly in cases where the probability of clinically apparent infec-tion varies with age. In some situainfec-tions, a rise in reported incidence may actually signal reduced infection rates in the general population or in certain age cohorts. This may have happened in Canada in the last decades of the twen-tieth century. Reported incidence in Hepatitis A in Canada exhibits an increasing trend between the years of 1980 and 1996 (linear regression: y = 0.21x + 4.61, R2 = 0.24;
the R2 value is low because of the recurrent outbreaks).
The dynamic model during this time predicts an increase in reported incidence (linear regression: y = 0.18x + 5.92, R2 = 0.99) while simultaneously predicting a decrease in
true (actual) incidence due to a declining transmission rate (Figure 4). This occurs because declining transmissi-bility yields a decrease in the infection rates and hence an increase in the mean age at infection. Because of age dependence in the probability of clinical infection, this translates into more reported HAV infections. However, in other situations, variation in reported incidence over time may also be due to changing case reporting methods.
Because of such subtleties, dynamic modelling provides a rigorous and transparent framework for the interpretation and synthesis of seroprevalence and case reporting, and especially the clarification of cohort effects (eg, Figure 4). Modelling is valuable not only for predicting the impact of proposed policies but also for understanding and inter-preting epidemiologic data. When developing dynamic models of disease transmission and vaccination, seroprev-alence data should be interpreted carefully and incorpo-rated into model parameterization whenever possible.
In our parameterization, some of the seroprevalence sur-vey data were used twice. Firstly, they were used in the
cat-alytic modelling to determine the proportion of seropositive individuals and hence the infection rates. Secondly, they were used to fit the function F(t) for declin-ing transmissibility. This two-step approach may intro-duce bias, since it assumes transmissibility has declined in each age class in the same way over the past century. An alternative approach might have been to fit functions for declining transmissibility for each age class separately. However, this would mean estimating 10 parameters using 11 data points, which constitutes a poorly deter-mined problem. In situations where more data points are available, this latter approach could be desirable.
In Canada, Hepatitis A transmission is primarily person-to-person. For other countries where environmental trans-mission is a significant source of Hepatitis A infection, the model would have to be modified to take environmental transmission into account [60].
Although this study addresses HAV specifically, the results should apply to any infectious disease in which there is lifelong immunity, person-to-person transmission, and where infection rates have changed significantly in past decades. Many pediatric infectious diseases fall into this category, with one difference being that disease severity declines with age instead of increasing, as with HAV. Hence, for many dynamic modelling studies, it may be necessary to account for cohort effects.
Conclusion
[image:8.612.53.560.108.291.2]Failure to account for cohort effects has implications for interpreting seroprevalence survey data and parameteriz-ing dynamic models. Moreover, for Hepatitis A, the pre-dicted impact of universal vaccination can vary widely depending on whether the cohort effect is included in the
Table 4: Predicted cumulative number of deaths attributable to HAV, with and without including the cohort effect in the dynamic model.
Cumulative number of deaths
Over 20 years (2006–2025) Over 50 years (2006–2055)
Without cohort effect With cohort effect Without cohort effect With cohort effect
Age Class Vaccination No vaccination Vaccination No vaccination Vaccination No vaccination Vaccination No vaccination
0–4 7.6 12.3 6.8 9.5 18.5 30.8 16.2 22.9
5–9 5.0 15.7 4.4 12.1 10.5 39.2 9.2 29.3
10–19 9.9 19.9 8.5 14.9 17.9 49.6 15.5 36.0
20–29 13.5 21.3 11.3 15.3 23.7 53.2 19.7 36.6
30–39 17.0 27.1 13.9 19.0 33.9 67.7 27.5 45.5
40–59 48.9 79.2 33.6 46.8 109.7 198.0 81.7 122.7
60+ 159.6 265.6 59.3 85.6 367.7 664.0 205.5 311.4
dynamic model. This is likely to be true for any infectious disease with lifelong immunity in populations with pro-nounced cohort effects. Hence, cohort effects should be accounted for in dynamic modelling studies whenever applicable.
Competing interests
This study was funded by a Canadian Institutes of Health Research Industry-Partnered Operating Grant in connec-tion with GlaxoSmithKline (GSK). BZP and ACT were employed by GSK. CTB was a consultant for GSK. CTB, BD and VG have received research funding from GSK.
Authors' contributions
All authors provided feedback on the modelling and the writing of manuscript as well as background to mathemat-ical, epidemiologmathemat-ical, clinical and/or public health litera-ture. ASRSR programmed and helped construct the dynamic model, and wrote early drafts of the manuscript; MHC conducted the catalytic modelling under supervi-sion of BZP; ACT reviewed the literature on Hepatitis A epidemiology; VG, BD and MDK provided guidance and feedback on epidemiological and public health aspects of HAV transmission and vaccination; CTB conceived of the study, constructed and analyzed the dynamic model, and completed the writing of the manuscript. All authors read and approved the final manuscript.
Additional material
Acknowledgements
This study was funded by a Canadian Institutes of Health Research Industry-Partnered Operating Grant in connection with GlaxoSmithKline. The fund-ing bodies had no role in the collection, analysis or interpretation of data, the dynamic modelling, the writing of the manuscript, or the decision to
submit the manuscript for publication. The authors are grateful to Heather Whitaker and Paolo Bonanni for acting as reviewers for the manuscript.
References
1. Tapia-Conyer R, Santos JI, Cavalcanti AM, Urdaneta E, Rivera L, Man-terola A, Potin M, Ruttiman R, Tanaka Kido J: Hepatitis A in Latin America: a changing epidemiologic pattern. Am J Trop Med Hyg
1999, 61:825-829.
2. Gust ID: Epidemiological patterns of hepatitis A in different parts of the world. Vaccine 1992, 10(Suppl 1):S56-S58. 3. Cuthbert JA: Hepatitis A: old and new. Clin Microbiol Rev 2001,
14:38-58.
4. Wasley A, Samandari T, Bell BP: Incidence of hepatitis A in the United States in the era of vaccination. J Am Med Soc 2005,
294(2):194-201.
5. Scheifele DW: Hepatitis A vaccines: the growing case for uni-versal immunisation of children. Expert Opin Pharmacother 2005,
6:157-164.
6. Lednar WM, Lemon SM, Kirkpatrick JW, Redfield RR, Fields ML, Kel-ley PW: Frequency of illness associated with epidemic hepati-tis A virus infection in adults. Am J Epidemiol 1985, 122:226-233. 7. Bell BP, Feinstone SM: Hepatitis A vaccine. In Vaccines 4th edition. Edited by: Plotkin SA, OWA. Philadelphia, PA: Saunders; 2004:269-298.
8. Koff RS: Seroepidemiology of hepatitis A in the United States.
J Infect Dis 1995, 171(Suppl 1):S19-23.
9. Almasio PL, Amoroso P: HAV infection in chronic liver disease: a rationale for vaccination. Vaccine 2003, 21:2238-2241. 10. Yao G: Clinical spectrum and natural history of viral hepatitis
A in a 1988 Shanghai epidemic. In Viral Hepatitis and Liver Disease
Edited by: Hollinger FB, Lemon SM, Margolis HS. Baltimore, MD, USA: Williams & Wilkins; 1991:76-78.
11. Jacobs RJ, Margolis HS, Coleman PJ: The cost-effectiveness of adolescent hepatitis A vaccination in states with the highest disease rates. Arch Pediatr Adolesc Med 2000, 154:763-770. 12. Glickson M, Galun E, Orun R, Tur-Kaspa R, Shouval D: Relapsing
hepatitis A. Review of 14 cases and literature survey. Medicine
1992, 71:14-23.
13. Advisory Committee on Immunization Practices (ACIP), Centers for Disease Control and Prevention: Prevention of hepatitis A through active or passive immunization. Morb Mort Wkly Rep: Recommendations and Reports 1999, 48:1-37.
14. Public Health Agency of Canada (PHAC): Notifiable Diseases Online. [http://dsol-smed.hc-sc.gc.ca/dsol-smed/ndis/ c_time_e.html].
15. Benenson MW, Takafuji ET, Bancroft WH, Lemon SM, Callahan MC, Leach DA: A military community outbreak of hepatitis type A related to transmission in a child care facility. Am J Epidemiol
1980, 112:471-481.
16. Hadler SC, Webster HM, Erben JJ, Swanson JE, Maynard JE: Hepati-tis A in day-care centers. A community-wide assessment. N Engl J Med 1980, 302:1222-1227.
17. Gingrich GA, Hadler SC, Elder HA, Ash KO: Serologic investiga-tion of an outbreak of hepatitis A in a rural day-care center.
Am J Public Health 1983, 73:1190-1193.
18. Pavia AT, Nielsen L, Armington L, Thurman DJ, Tierney E, Nichol CR:
A community-wide outbreak of hepatitis A in a religious community: impact of mass administration of immune glob-ulin. Am J Epidemiol 1990, 131:1085-1093.
19. Staes CJ, Schlenker TL, Risk I, Cannon KG, Harris H, Pavia AT, Sha-piro CN, Bell BP: Sources of infection among persons with acute hepatitis A and no identified risk factors during a sus-tained community-wide outbreak. Pediatrics 2000, 106(4):E54. 20. Centers for Disease Control and Prevention (CDC): Hepatitis
Surveil-lance Report 2000, 57:.
21. Public Health Agency of Canada (PHAC): Canadian Immunization Guide. 6th edition. 2000 [http://www.phac-aspc.gc.ca/publicat/cig-gci/].
22. Harb J, Lem M, Fyfe M, Patrick D, Ochnio J, Dobson S, Hockin J: Hep-atitis A in the Northern interior of British Columbia: An out-break among members of a first nations community. Health Canada Canada Comm Dis Rep26(19):. 1 October 2000
23. Hockin J: Hepatitis A outbreak in a socially-contained reli-gious community in rural southern Ontario. Health Canada Canada Comm Dis Rep23(21):. 1 November 1997
Additional File 1
Model Equations. This file defines the model equations, parameters and
variables. Click here for file
[http://www.biomedcentral.com/content/supplementary/1471-2334-6-174-S1.pdf]
Additional File 2
Parameter Estimation. This file describes the model parameterization.
Click here for file
[http://www.biomedcentral.com/content/supplementary/1471-2334-6-174-S2.pdf]
Additional File 3
Uncertainty Analysis. This file describes the methods of uncertainty anal-ysis.
Click here for file
Publish with BioMed Central and every scientist can read your work free of charge
"BioMed Central will be the most significant development for disseminating the results of biomedical researc h in our lifetime."
Sir Paul Nurse, Cancer Research UK
Your research papers will be:
available free of charge to the entire biomedical community
peer reviewed and published immediately upon acceptance
cited in PubMed and archived on PubMed Central
yours — you keep the copyright
Submit your manuscript here:
http://www.biomedcentral.com/info/publishing_adv.asp
BioMedcentral
24. Naus M, Everett W, Davies S, Coutts J: A school outbreak of hep-atitis A in southwestern Ontario. Can Dis Wkly Rep
15(45):225-228. 1 November 1989
25. Deshaies D: Immunization against Hepatitis A during an Out-break in a Jewish Orthodox Community-Quebec, 1997– 1998. Health Canada Canada Comm Dis Rep24(18):. 15 September 1998
26. De Serres G, Duval B, Shadmani R, Boulianne N, Pohani G, Naus M, Fradet MD, Rochette L, Ward BJ, Kain KC: Ineffectiveness of the current strategy to prevent hepatitis A in travelers. J Travel Med 2002, 9(1):10-16.
27. Ochnio JJ, Scheifele DW, Ho M: Hepatitis A virus in urban chil-dren – are preventative opportunities being missed? J Inf Dis
1997, 176:1610-1613.
28. Honish L: Hepatitis A Infected Food Handler at an Edmonton, Alberta Retail Food facility: Public Health Protection Strat-egies. Heath Canada CCDR27(21):. 1 November 2001
29. Thompson L, McArthur B, Dalich-Adair T, Bell A: Hepatitis A out-break in Grand Forks, British Columbia, 1990. Can Dis Wkly Rep17(37):201-204. 14 September 1991
30. Minuk GY, Ding LX, Hannon C, Sekla K: The risks of transmission of acute hepatitis A and B virus infection in an urban centre.
J Hepatol 1994, 21:118-121.
31. Armstrong GL, Bell BP: Hepatitis A virus infections in the United States: model-based estimates and implications for childhood immunization. Pediatrics 2002, 109:839-845. 32. Muensch H: Catalytic models in epidemiology Cambridge,
Massachus-setts: Harvard University Press; 1959.
33. Pham B, Duval B, DeSerres G, Gilca V, Tricco AC, Ochnio J, Scheifele DW: Seroprevalence of hepatitis A infection in a lower ende-micity country: a systematic review. BMC Inf Dis 2005, 5:56-67. 34. Jacobsen KJ, Koopman JS: The effects of socioeconomic devel-opment on worldwide hepatitis A virus seroprevalence pat-terns. Int J Epidem 2005, 34:600-609.
35. Wong KH, Liu YM, Ng PSP, Young BWY, Lee SS: Epidemiology of Hepatitis A and Hepatitis E infection and their determinants in adult Chinese community in Hong Kong. J Med Virology 2004,
72:538-544.
36. Sattenspiel L, Simon CP: The spread and persistence of disease in structured populations. Math Biosci 1998, 90:341-366. 37. Diel R, Rappenhoener B, Schneider S: Cost-effectiveness of
hepa-titis A immunization of children and adolescents in Ger-many. Health Econ in Prev and Care 2001, 2:96-103.
38. Samandari T, Bell BP, Armstrong GL: Quantifying the impact of hepatitis A immunization in the United States, 1995–2001.
Vaccine 2004, 22:4342-4350.
39. Anderson RM, May RM: Infectious diseases of humans: dynamics and con-trol Oxford: Oxford University press; 1991.
40. Bauch CT, Earn DJD: Transients and attractors in epidemics.
Proc R Soc Lond B 2003, 270:1573-1578.
41. Grassly NC, Fraser C, Garnett G: Host immunity and synchro-nized epidemics of syphilis across the United States. Nature
2005, 433:417-421.
42. Babad HR, Nokes DJ, Gay NJ, Miller E, Morgan-Capner P, Anderson RM: Predicting the impact of measles vaccination in England and Wales: model validation and analysis of policy options.
Epidemiol Infect 1995, 114(2):319-344.
43. Ministry of Health of New Zealand: Modelling Measles: Predicting and preventing measles epidemics in New Zealand. Application of a mathemat-ical model Wellington: Ministry of Health; 1998.
44. Goldrick BA: Another vaccine preventable disease continues to emerge. Am J Nursing 2004, 104:27-28.
45. Leach C: Hepatitis A in the United States. Pediatric Infec Dis J
2004, 23:551-2.
46. Craig AS, Schaffner W: Prevention of hepatitis A with the hep-atitis A vaccine. New Engl J Med 2004, 350:476-481.
47. Jacobs RJ, Gibson GA, Meyerhoff AS: Cost-effectiveness of Hepa-titis A-B Vaccine Versus HepaHepa-titis B Vaccine for Healthcare and Public Safety Workers in the Western United States. Inf Control and Hosp Epidem 2004, 25(7):563-569.
48. Centers for Disease Control and Prevention: Viral Hepatitis Surveil-lance Programme, 1983–1989 .
49. Innis BL, Snitbhan R, Kunasol P, Laorakpongse T, Poopatanakool W, Kozik CA, Suntayakorn S, Suknuntapong T, Safary A, Tang DB: Pro-tection against hepatitis A by an inactivated vaccine. J Am Med Assoc 1994, 271:1328-1334.
50. Werzberger A, Mensch B, Kuter B, Brown L, Lewis J, Sitrin R, Miller W, Shouval D, Wiens B, Calandra G: A controlled trial of a for-malin-inactivated hepatitis A vaccine in healthy children. N Engl J Med 1992, 327:453-457.
51. Statistics Canada: Canadian Statistics Section, Vital Statistics.
[http://www.statscan.ca].
52. Statistics Canada: CANSIM Table 427–0003 and historical sup-plement 66–201. [http://cansim2.statcan.ca].
53. Duval B, Boucher F, Dion J, Dupont M, Robinson E, Tremblay M, Venne S, Willems B: Controle de l'hépatite A par l'immunisa-tion au Quebec (Final Report, in French), Quebec Immuni-zation Committee, December 1997. .
54. el Saadany S, Gully P, Giulivi A: Hepatitis A, B, and C in Canada. Results from the National Sentinel Health Unit Surveillance System, 1993–1995. Can J Public Health 2002, 93(6):435-438. 55. Gosselin C, De Serres G, Rouleau I, Duval B, Shadmani R, Naus M,
Ward BJ: Comparison of trip characteristics of children and adults with travel-acquired Hepatitis A infection. Ped Inf Dis J
2006, 25(12):1184-1186.
56. McFarlane ES, Embil JA, Manuel FR, Gorelick M: Prevalence of anti-bodies to hepatitis A antigen in patients attending a clinic for treatment of sexually transmitted disease. Sex Trans Dis 1980,
7:87-89.
57. Crewe MD, Embil JA, Garner JB: Prevalence of antibodies to hep-atitis A virus in Nova Scotia children. Can Med Assoc J 1983,
25:1195-1197.
58. Payment P: Antibody levels to selected enteric virus in a French-Canadian population in the province of Quebec.
Immunology and Inf Dis 1991, 1:317-322.
59. Blower SM, Dowlatabadi H: Sensitivity and uncertainty analysis of complex models of disease transmission: an HIV model, as an example. International Statistical Review 1994, 62:229-243. 60. Golinski MR, Barany E, Ballyk M: Ecological conditions that favor
the evolution of intermediate-virulence in an environmen-tally transmitted parasite. Journal of Mathematical Biology 2005,
51:389-402.
Pre-publication history
The pre-publication history for this paper can be accessed here: