Rochester Institute of Technology
RIT Scholar Works
Theses
Thesis/Dissertation Collections
4-1-2002
An Investigation into the sources of vehicle tire
noise
John Paoff
Follow this and additional works at:
http://scholarworks.rit.edu/theses
This Thesis is brought to you for free and open access by the Thesis/Dissertation Collections at RIT Scholar Works. It has been accepted for inclusion in Theses by an authorized administrator of RIT Scholar Works. For more information, please contactritscholarworks@rit.edu.
Recommended Citation
An Investigation into the Sources of Vehicle
Tire Noise
By
John M. Paoff
A Thesis Submitted in
Partial Fulfillment of the
Requirements for the
Master of Science
In
Mechanical Engineering
Approved
by:
Dr. Josef S. Torok
Department of Mechanical Engineering
Dr. Ag Crassidis
Department of Mechanical Engineering
Dr. Alan Nye
Department of Mechanical Engineering
Dr. Ed Hensel
Department Head, Mechanical Engineering
(Thesis Advisor)
Department of Mechanical Engineering
Rochester Institute of Technology
Permission Granted
Investigation of Tire Noise
I, John Paoff, hereby grant permission to the Wallace Library of the Rochester Institute of
Technology to reproduce my thesis whole or in part. Any reproduction will not be for
commercial use or profit.
Date:
5
p/o
d-
Signature of Author:
_
Acknowledgments
Writing
this thesishas been avery challenging lifeexperienceforme,andthoughI almost gaveup and walkedaway from
it,
Ifelt Icould notlet downthose whohelpedme outalongtheway.
First,
Iwouldliketothankmyparentsfor supportingmethroughoutmy academic career. Inthemechanicalengineering department Iwantto
thankmythesis advisor,Dr.
Torok,
for stickingwithme onthis thesis andfor makinglearning
moreinteresting
thanIeverimagined itcouldbe. Iwould alsoliketo thankDr.Kempsifor
letting
meinfesttheGraduate Lab foraquarterorso.Iwouldliketo thankallthe teachers who putupwithcountlessvisitsto theirofficeand me askingamillion
questions (youknowwho youare!).I wouldalsoliketo thank thosewhoI hadthe
privilegetobecolleagues andfriends with eventhoughI probablyannoyed a-lot of you
(Big
Mike,
Bret,
andothers).Iwouldliketo give aspecialthanksto thosewho cametoRIT from Alfred State withme,itwasa
long
strangetrip, andthoughwehad ourdisagreements,
Iwill neverforgetthefuntimes.Thanks,
Abstract
Noiseproduced
by
arollingtireon pavementhasplagued automakersforyearsduetoits complexity.Tirenoiseis dependentonmanythingssuch astirematerial, tire
construction,road surfacetexture,etc. Inthis
investigation,
an acousticalapproachtomodelingtirenoiseispresented.Basedonthemechanicsof arotating tire, acoustical
modelscanbe developed.
This,
alongwith some acoustical analysis, leadstomathematicalmodels thatonecanutilizein ordertopredictthenoisethat the tirewill
produce.These models willprovide a goodbasisandstartingpointforreduction oftire
Table
of
contents
Chapter
PageChapter I Introduction
5
Chapter II General DiscussionofSound 7
Chapter III Sound Measure 1 1
Chapter IV Tire Construction 14
Chapter V Tiresand
Elasticity
17Chapter VI InfluenceofMaterial Properties onTire Noise 22
Chapter VII TireConstructionandNoise 35
Chapter VIII Section 1: Road Texture andTire/Road Noise 42
Chapter VIII Section 2: Air
Pumping
as aNoise Source 43Chapter IX Methodsof
Measuring
Tire Noise 44Chapter X Patch
Frequency
53Chapter XI TireBulge 56
Chapter XII The
Rubbing Theory
59ChapterXIII Conclusions andFuture Recommendations 69
Resources 74
Chapter 1
-Introduction
Inthelast
twenty
years orso,tire noise,has been modeledthroughmethods suchas: vibrationanalysis, acoustical
holography,
andothertechniques usingvariouslaboratory
set-ups.Ofallthemethods outthereisn't anyonetheory
thatcompletelycaptures
everything
thatis producingnoisedueto thecomplexityoftheautomobiletire.Basicacoustical principles andmeasuringtechniquesallowonetodeterminea
soundlevelof a source andtodistinguish it from backgroundorothersimultaneously
occurringnoises.This is done
by
anaddition and/or subtraction of sound pressure levels.Thegoal ofthisworkistoprovide abasic understandingofacoustics andapply
theprinciplesto aneverydayproblem, tirenoise.Thisobjectivewaschosenbecause
thereis nocompletemathematical or acoustical modelfortirenoise.This isnotan
attempttocreatetheperfectmodel,butthrough observations andbasic acoustical
principles,morepieces ofthetire noisepuzzlecanbeadded.
Chapter 2 begins
by
goingoverthebasicsofsound;whatitis,
how it ismeasured,and some acoustical terminology.Chapter 3 goesinto detail onhowtomanipulate, add,
and subtractsoundlevels. Chapter 4givesbasic information ontireconstruction.Chapter
5 isabouttiresand elasticity. Itcovershowtires react under aloadandits resulting
deformations. Chapter
6
looks at workdone in thepastby
M. Muthukrishnan[12]
forSAE in 1990titled"Effects ofMaterial Propertieson TireNoise." Theauthor shows
how noiselevels goupwith
increasing
speedandincreasing
weight.He alsodescribes
indetail howtirenoise is affected
by
tireproperties suchas modulus ofelasticityandTannoise
levels.
Chapter 7 isonthepaper"Investigation intotheInfluence of TireConstruction
onCoast-by
Noise"by
DonBrackin, Nishuhata,
andSauerZapf [18]. Themain points madeintheirinvestigation arethat tire treadvibrationis greatestnearthe
contact patch ofthetire. It isalso concludedthatshouldertreadvibrationis thenoise
sourcethatbestcorrelatestomeasuredtirenoise.
They
also statehowlowering
thecentercontact pressure and or
increasing
theshouldertreadbending
stiffness will decreasethetiretreadvibration and reducetirenoise generated. Chapter 8coverstherelationship
betweenroadtextureandtirenoise. Written ina conferencepaperfrom Noise-Con96
by
Yasuo OshinoandHideki Tachibana
[7], they
concludethat tire/roadnoiseincreaseswithanincreaseof roadtexturedepth. Chapter 9 ison
Plotkin,
Montroll,
andFuller's[4]
studyonnoise sourcesthatare consistentwith airpumping.
They
describe how sound pressuredueto airpumping is
directly
relatedto thesecondderivative ofthevolumeof airdisplaced fromtreadvoids.Chapter 10goesintothemethods ofmeasuringtirenoise that
arecommonlyused.Thesemethodsinclude "The
Coast
By
Method," "The TrailerMethod,"
and"The
Laboratory
DrumMethod."
Chapters 11-14arewherethe
mathematicalmodelingthrough observationand experimentationis presented.Chapter
1 1 discussestirepatch
frequency
and astire patchfrequency
increasessodoesthe soundlevel. Chapter 12 isabouttirebulge anditseffect on tirenoise. Chapter 13 takesyou
through thedevelopmentoftherubbing theory,whichis thenbacked upthrough
experimentation. Chapter 14concludesthisinvestigation and givesfuture
Chapter
II
-General
Discussion
of
Sound
Sound
canbedescribed
as adisturbance spreadingthrough aphysicalmedium,such as air. Theear perceivesitas a pressure wave superimposed upontheambientair
pressuretothe
listener.
Thesound pressureistherefore theincrementalvariation abouttheambient atmospheric pressure. Todescribethesepressurewaveswe callsound,
mathematically,it is besttolookattheattributesof a puretone. Apuretoneisa
sinusoidal pressurewave of aspecific
frequency
andamplitude,propagating at avelocitydetermined
by
thetemperatureand pressure of air.A hypothetical soundgenerator, asdescribed
by
IrwinandGraf,
in IndustrialNoiseandVibration
Control,
is shownbelow:o
Figure 1
-[17]
Thesourcemay bethoughtofas anelastic sphere,like a
balloon,
thatexpandsandcontracts sinusoi
dally
at afrequency
f.astheballoon expands, thesurroundingairmolecules arecompressed.Whentheballooncontracts, theair molecules spreadapart;
thegas israrefied.The sound wave generated willhave a
frequency
equalto thenumberoftimesper secondinwhichtheballoon expandsand contracts. The
Amplitude
oftheThe
frequency,
f,
of anoscillating disturbance isequal to thenumberoftimespersecondthat the
disturbance
passesthroughboth its positiveandnegativeexcursions.Thenumber of cyclespersecondis termed
Hertz
(cycles/sec). Thefrequency
of a simplepuretone sound waveis recognized asthepitch ofthe tone.
Theperiod,
T,
ofthesinusoidal waveisthe timerequiredforone completecycle,andis relatedtothe
frequency,/,
by:r=J_ [I7]pg.3
/
Thewavelength,
A,
is thedistance between likepoints ontwosuccessive waves.Thewavelengthisrelatedto the
frequency
andvelocityof propagationby:A
=- =cT [l7]Pg.3/
inwhich thevelocity ofpropagation, c,is inturn afunctionofthecharacteristics ofthe
propagation-supportingmedium.The velocityofpropagation or speed ofsoundinairis
given
by
theequationbelow:y*P
c=\- 2. [17]pg.3
Here y isspecificheatatconstant pressure over specific heatat constant volume.
specificheat
(c.p.)
Y
=[17]pg.3 specificheat
(c.v.)
Pa
=Ambientor equilibrium pressurep
=Ambientorequilibriumdensity
\Al/2.
c=
49.03*(R)
whereR is thetemperatureindegrees Rankin
or c =
20.05*(K)
whereK isthe temperaturein degrees KelvinThesound power
level
describestheacoustical power radiatedby
a givensourcewith respecttothe
international
referenceof 10A-12W. Thesound pressurelevel isproportional to the
logarithm
oftheratio ofpressures squared.This is important inthatthepressure squaredisproportionaltosomesoundpower;thus, boththesoundpower
level and sound pressurelevelare associatedwithpower. Soundpowersandsound
pressures are commonlyexpressedina
logarithmic,
ratherthanalinearscale calleddecibels. The decibel isthe
logarithm,
to thebase10,
oftheratioofthequantity inquestion,toan arbitrarilychosenreference quantity.Theargument ofthelogarithm is
dimensionless.
Level=10
log
<
Xs-KZ,
Z =
quantity inquestion
Z0
=chosenreferencequantity
Thesound power
level, Lw,
is definedas:[17]pg.6
'W\
*w=101og
W =powerinquestion
Wre
=10-12wattThesound pressure
level, Lp,
expressedin decibels is:[17]pg.6
LP
=10log
' p^
LP
=20log
P v reJ
f P\
[17]
pg.8P - Root
-mean
-square
(RMS)
sound pressurein
question (Pa.orN/m
2)
Pre
=InternationalReference Pressure ofThe
human
ear cannot respondtoallfrequencies
in anunbiased manner.Audiblerange of a
human
being
rangesfrom
20 Hzto20,000Hz,
whichinfactwill vary withage,
health,
past exposureto noises, and soforth.
Theear also actslikeafilterand willfavor
certainfrequencies
overtheothers. Theearis most sensitivetosounds attherangeof1,000to
5,000
Hz,
andparticularly
at about4,000 Hz. Theperceived sound pressurelevel or
loudness
isfrequency
dependent.
Figure2
-[19]
[image:12.557.32.534.223.697.2]Chapter
III
-Sound Measure
The
understanding
of noise problemscommonly demandsthatpressuresandpowersbemanipulated
by
means ofdecibel additions andsubtractions.Sound Pressurelevels
(indecibels)
are averagedinthecalculation ofsourcedirectivity. For adding andsubtractingandaveraging
decibels,
quantitative analysis areusedas well ascharts andapproximations.Inthis
investigation,
theappropriate quantitative analysis willbeconcentrated on.
Soundpowerlevels arecommonly addedwhen
determining
the total sound powerlevelofasource. Becausenoise canberandom withrespecttophasemeasurements, it is
added on an energy basis. Assumethesound pressurelevels
Lpl, Lp2, Lp3,
through Lpiaretobe added.The sound pressurelevel
by
definition,
is:'P*
yPreJ
[17]pg. 10
LPi=10Log
Where P istheroot meansquare
(rms)
sound pressureinquestion (PaorN/mA2)
andPreistheInternationalreference pressure of20*10A6 Paor.0002uBar
Thenextstep is todeterminethesquareofthepressureratio;
Thetotalsoundpressure
Lpt,
is simply(
V
P_
yPre J
fl \
=
antilog
v10,
Ln
=10
log
n1
[
"
)
2
"
i'=l
[p
Or intermsof sound pressure
levels,
Lpt
=10
log
X
antilog
1=1
Simplifying
further,
v10
;
LPt
=10
log
S10
101=1
[17]pg. 10
Theexpressionforsound powerlevels may beexpressedas
n Lwj
Lwt
= 10log
5>
10 i=i[17]pg. 10
Where
Lwt
=totalsound powerth
Lwi
=i sound powerlevelIn manycases,it isdesiredtosubtractbackgroundor ambient sound pressure
level from atotalmeasuredleveltoobtainthe sound pressurelevelproducedfroma
single source. Theprocedure for subtracting decibels issimilarto thatofaddition.
Thetotalsound pressureindecibels is
Lft=101og
Intermsofthemean-squarepressureratio,
f \2
__
yPre
j
[17]
pg. 13(
V
I _p_KPreJ
=antilog
(L
pt10
=
10
10The
background
or ambient noisemay berepresentedby
(
V
v
Pre
J-antilog
(\^.\
pBV
10
=10
upBLpB
=sound pressureleveloftheambient orbackground noise.The sought-after sound pressureleveloftheambient orbackgroundnoisein decibels is:
Lr
= psLPS
=10
log
j
P"2 ( p >
2
{Pre)
t KPre Jb10
log
10 10 - 10 10^
J
or
[17]pg. 13
When averaging decibels it follows
directly
fromthesummationthat,LPt
=10
log
10
101=1
[17]pg. 16
theaveragedecibel
level, Lp,
isdeterminedby dividing
thesumby
thenumber oflevels,
that
is,
LD
=10log
(
i ntlL\
-y
io
io
n /=1
[17]pg. 16
Chapter IV
-Tire
Construction
Pneumatic
tires servethreemain purposes.They
supporttheweight ofavehicle,absorb road surface
irregularities,
and providetraction ontheroad. Tires haveatoroidalshape and are usually
filled
with compressed air.Thecarcass ofthe tireprovidesthestructural supportforthetire.Thecarcassismade upofmany flexible filamentsofhigh
moduluscord,embeddedinandbondedtoa matrix oflowmodulus material,usually
[image:16.556.168.365.534.664.2]rubber.Thechordsofthetire are made ofnaturaltextile,syntheticpolymer,glass
fiber,
Figure 3 Filamentarrangementsthatareusedinpneumatictires, a)wovencord
b)
weftless cord c) Cordwith lightwefts[1]
pg.360orfine hard drawn steel.
Thechords areanchoredon thebeads ofthetire,whicharehightensile steelwiresthat
seatontherimofthe tire.Thebeadsserve as afoundation forthecarcass and provideit
(a)
(h)
(c)
Figure 4
Essentialsofbead construction(a)
Lowturn-up
construction(b)
highturn-up
construction(c)
Overlap
construction(d)
Detailoftypicalbead[1]
pg.361
with adequate
seating
ontherim. Thematerialin whichthebeads areincased in ispressed againstthe
flange
oftherimby
inflationpressure.Mostofthe tire'svibrations anddeformationoccurinthesidewalkThetreadof
thetireis made of various typesof rubber
depending
onthe tireapplication. Whenthetireis inflatedwithair, thepressure causestensioninthe chordswithinthecarcass.Load
fromtheweight oftheautomobile placedon therimto the wheel,hangs primarilyonthe
chordsinthesidewallsthrough thebeads. Thechords or plies runat an anglefromthe
centerline(circumfrentialcenterof
treads)
ofthe tire.Thenumber oflayers is determinedby
the tiretype,
the tiresize, andtheinflationpressuretobeused. Atypical tirewillhavefrom 2-20plies with each layer running inoppositedirections. This angleiscalledthe
crown angle.This angle playsaroleintherideand
handling
ofthe tire.There aretwobasic typesoftires, Bias plyandRadialply. InaBias ply tire, the
chords extend
diagonally
acrossthecarcassfrom beadto beadwithacrown angleofabout40 degrees. Whenthe tireisrolling, the diagonalpliesflex andrub,thiselongates
thediamondshapedelementsformed
by
thechords andtherubberfiller. Thisflexing
action producesawipingmotionbetweenthe tread andtheroad.
Figure
5 Conventionalcross-biastire.[1]
pg.369Ina radialply tire, thereisone ormore layersofchordsextending radiallyfrom
beadto
bead,
resulting in a crown angle of90 degrees. Underthetread,atalowcrownangle of about 20
degrees,
arefittedseverallayeredbeltsmadeofhighelasticitymaterial,usuallysteel. All together,there aretworadialpliesof rayonorpolyester, twoplies of
steelcords, andtwoplies of synthetic materiallikenylon. Aradial plytirehasarelatively
uniformground pressuredistributionunderthecontact patch (no wipingmotion).The
ground pressureforabias plytirevariesgreatly frompointtopoint astreadelements
passingthrough thecontact regiongothrough acomplexwipingmotion.
Chapter V Tires
andElasticity
In
Mechanics
ofPneumatic
Tires,
by
S K. Clark[1]
(section3.8),
themechanismofload
carrying
of atoroidalortire-likestructure ofaninfinitely
flexiblemembranewith arigidtubularrim forthecentral zone orboreofthe toroidis
discussed,
seefigure below.CZ)
[image:19.556.228.370.219.330.2]Co) bl
Figure 7 Toroidalmembrane on cylindrical rim
[1]
pg. 396It isassumedthat thejunction betweenthe thinflexiblemembrane andtherigid
tubularrimorbase haszero
bending
rigidity. Inflationofthestructure putstensionsinthemembrane andittakesa shape asdetermined
by
equilibrium andcompatibilityconditions.Themembranetensionsare resisted
by
reactions atthe edge ofthetubularrim. Forthepresentpurpose, thesecan be discussed interms oftwocomponents;
radiallyoutwardtension andtensionin an axialdirection (that isparalleledtotheaxis of
rotational symmetryorrotationofsurfacegenerators) at each point aroundtheedge of
therim.Ifaflatplateis pressed againstthemembrane whilethestructureis supported
by
therim areactionwill
develop
betweenmembrane and plate wheretheloadwillbeequalAs seeninthe
figure
below,
thecurvature ofthewallofthemembraneincreasesintheregion
between
theloading
plate andtheadjacentrim.i.J/'
Figure
8
Perspectivesketch oftoroidalshell contact[1]
pg.397Hence,
becauseofthe increasedcurvature, themembranestressesin thisregionarelowerthanelsewhereinthemembrane walls. The deflectionalso causes themembrane
todistort
locally,
increasing
theanglebetweenthedirection ofthewall and alinenormalto theplatefromthe
rim;
thisistruewhateverthecross sectionalshape, seefigure below.Figure
9
Crosssections ofFigure 7 showingdeflections
of sidewallswhich reducethe tension componentradially
outwardattheinnercylinder edge
[1]
pg.397This increaseof anglereducesalgebraicallythecosine ofthe angle
between
thewallandthelineof action oftheappliedloadontheplate.
Thenet effect ofthereducedtensionand reduced component atthedeflectedregion
isto
develop
therequired reaction. Ineffect, therimhangs inthe tensionsoftheundeflected walls as shown,see
figure below.
[image:21.556.195.351.148.297.2]TTTTT
Figure 10 Polarplot ofradiallyoutward component of
walltensionofmembranetoroidon innercylinder
[1]
pg.397
The radiallyoutward components ofthewalltensionsare greaterintheundeflected
regionsthaninthedeflectedregion.
Theusefulinformation wegetfromthis isthat thereducedtension inthe
deflectedregion causesthestiffnessintheshoulder regiontodrop.
Decreasing
pressureon atirewill increasetheamountthe tire
deflects,
this deflectionwill increasethebulgeof atire.Asaresult,tirebulge increaseswithtire
deflection,
which meanstherewillbelesstire stiffnessinthedeflectedregion (thetire shoulder)whichmeans therewillbe
morevibrationoftheshouldertreadsproducingmore noise. Theelastic effects ofthe tire
causethistohappen. The deflectedsidewallwill snap back intoshape upon
leaving
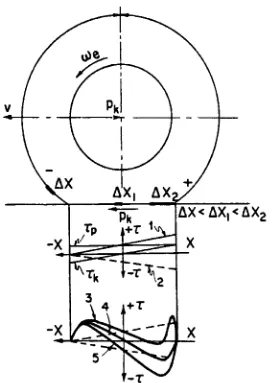
theFrom Samuel K.
Clark's,
Mechanics
of PneumaticTires,
November 1971[1],
Figure10,
showstherotation of a wheel
transmitting
torque, Mt. Asaresult ofthe torquetransmittedthrough thewheel,two sets offorcesact uponit. One isthereactionofthe
wheel axis
Pk,
and equaltoitandintheoppositedirection,
thereaction oftheroadactingin theplaneofcontact. Asafirstapproximation,it may beassumedthatthereactionof
theroad
Pk
is evenly distributed overthe areaof contact.The componentoftangentialstressfrom
Pk
isdenotedasxp.t-T
Figure
11
RotationofaDriving
Wheel (theDistributionofLongitudinal TangentialStress
in theContact
Region
ofDriven,
Driving
andBraked Wheels).[1]
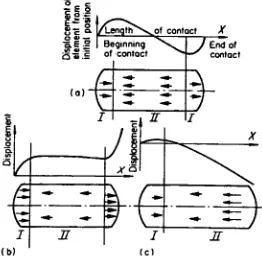
pg.490 [image:22.556.138.410.262.645.2]There isa certain amount of adhesion overthecontact region.Thetirepossesses
longitudinal
tangential elasticity, allowingthe torqueofthe tirewill compressthe treadelementsinthezone
immediately
beforethecontact region(-)
andatthesametimewillstretchtheelementsin theareajust afterthecontactregion (+). Again
looking
atFigure1
1,
aninitially
compressed elementAx,
ofthe treadisreleasedfrom longitudinalcompression asitpassesthrough thecontactarea, revertingtoits normalstate
Axi,
thenitundergoes
stretching
and emergesfromthecontact regionin astretchedstateAx2. Sincethe elements,as
they
passintothecontact area,are in directcontact withtheroad,anychange intheirdimensions isprevented
by
theforcewith whichelement gripstheroadsurface, andlongitudinal tangentialstressxkariseintheplane of contact. Thesestresses
causethere tobean area of slippage attherearofthecontactpatchdue to the tension
pullingthe treadsout ofthecontact patch.
Lenqtnsv^of contact X
Figure
12 Displacementoftreadelementsalongcontactlengthoftire:(a)
free
rolling,(b)
driving,
(c)
braked.
[1]
pg.465ZoneI Longitudinaltangentialstressactingfromtiretoroadway in directionof motion.
[image:23.556.126.388.388.644.2]Chapter
VI
-Influence
of
Material
Properties
onTire Noise
In thearticle
"Effects
of Material Propertieson TireNoise"
by
M. Muthukrishnan[12],
SAE, 1990,
theresults of an experimentalstudytodeterminetheeffectofmaterialproperties ontirenoise are
discussed.
Thepropertiesthey
usecoverawide rangeofmoduli andtandelta fortreadand sidewalkAn explanation oftan delta is locatedon page
25. Thetiresweretestedatdifferentspeeds,loads andinflationpressures.From this,
they
obtained overall noiselevels andfrequency
content.Thetestsindicatealargerinfluenceoftreadmodulusontirenoise, anditwas observedthat theinteractionbetween
treadand sidewallproperties affecttirenoise levelssignificantly.
Theresultsofthisreportare presentedin twoparts:
(1)
the effects ofload,
pressure,and speed on tire noise,and
(2)
Material propertyeffects ontirenoise.Theresultsofvaryingtheloadshowthatloadchangesdonotaffectnoiselevel in any
significant way.The
testing
wasdone atfive differentspeeds,andfive differentmicrophone locations.
ROADWHEEL.NOISETEST
TJE
f
si
I
I I \
^_
2,1m4
V
\ s
V
MlcrophuntLocation
"~" }
Figure 13 microphonelocationsaroundthetire
[12]
pg.3
Load EffectsonTire Noise
(dBA)
RoadwheelTesting
Inflation Pressure: 35psi.MicrophoneLocation 1 MicrophoneLocation 2 Microphone Location 3 Microphone Location 4 MicrophoneLocation 5 Speed
(MPH)
30636 Lbs. 1190 Lbs. 636 Lbs. 1190 Lbs. 636 Lbs. 1190 Lbs. 636 Lbs. 11 90 Lbs. 636 Lbs. 1190 Lbs.
76.6 77.2 74.5 75.2 74.5 76.2 74.6 76.2 74.2 74.5
40 80.9 81.4 79.4 79.3 79.2 79.5 78.2 78.4 76.5 75.6
45 83 83 81.4 80.5 81.3 79.6 80 79.2 78.5 76.6
50 84.4 83.9 82.4 81.4 81.7 80 80.5 79.5 79 77.5
60 83.6 85.3 82.4 83.4 82 82.4 81.3 82.1 78.8 80.5
Figure
14Load Effects
onTireNoise
(dBA) [12]
pg.3Thechanges innoiselevelswere atmost+- 2 dBA.
Next,
pressureeffectsontirenoise,were shown
by
comparingnoise levelsattwodifferentpressuresfor differentloadsand speeds. Atthelighter
load,
anincrease in 15 psiledtoan increase innoiselevelsofaboutoneto three dBA. Atthelarger
load,
thereis areversal andtheincrease in inflationpressureis accompanied
by
adecrease inthenoiselevelby
as much astwodBA.!1SfiLJ*OJSE
P^Ss.jEE CPF""? m M1
& Oll LoC-d; S-Ift *.. .i Si **,:
^s*kHi^
20**.5
K-UJ *t- ^^n * ^^^^^^ Ul flCM fa- *~*m. ^---****^^*^*^
E JO'?
*-.? TT' **
jr*J
**
U>flJ: 1ISC Dl.
a s 4
UlCA&PMOH'E lOCatiom
Figure 15 Pressure Effectson Tire Noise
[12]
pg.4
[image:25.576.147.395.380.651.2]Theeffect of speed on noise level isshownin thefigure below. With
increasing
speed, thenoiselevel
generally
increases. There isalarge increase from 30to40mphsatbothloads. After 40mph, theincrease isnot uniform andis even reducedatcertain
speed ranges.
S
IP -r"
-P
1J
T
UJ
5
8
GO
T1RE
NOISE
epeiici
Effects
4
ED [image:26.556.76.487.156.569.2]&PEEU
(MPHJ
Figure 16 Speed EffectonTire Noise
[12]
pg.5Forthematerialpropertyparametersontire/roadnoise, a widerangeof moduli
andtandeltaare used.Ninegroupsoftireswere
built,
thesegroups canbe seenintheTable below.
Experimental Design
(Fractional
Factorial)
4
Variables:
Tread Modulus
Tread Tan Delta
Sidewall Package Modulus
Sidewall Package
Tan Delta
The
Group
ID
Mod
ulusTan Delta
Tread
Sidewall
Package
Tread
Sidewall
Package
A
Control
Control
Control
Control
B
Low
Low
Control
Control
C
High
Low
Control
Control
D
Low
High
Control
Control
E
High
High
Control
Control
F
Control
Control
Low
Low
G
Control
Control
High
Low
H
Control
Control
Low
High
1
Control
Control
High
High
Figure 17 Tire
Groups
[12]
pg.2There isone control group,
A,
fourgroups(B, C, D,
andE)
with varyingmoduli,andfourmore groups
(F, G, H,
andJ)
withvaryingtan deltaandconstant moduli for boththe treadandsidewall.
Looking
attandelta,
theelasticmodulusisE',
andtheE" isthelossmodulus. Thetwocasescanbeseen in Figure 18.
[image:27.556.126.410.57.376.2]Varying
ElasticModulus/ConstantTan DeltaVarying
TanDelta/ Constant
ElasticModulus
Figure 18 Tan DeltaandElastic
Modulus
[12]
pg.225
i
H,
In Figure
18,
E' istheElasticModulus
orStorage
Modulus,
E"is theloss
modulus,E*isthecomplexmodulus,
5
is theloss
angle, and 1,2arethetwoconditions. Allmaterialshave aviscoelasticity,whichis a combination ofviscosityandelasticity in varying
amounts. When viscoelasticity ismeasured
dynamically,
thereis a phaseshiftbetweenthe
force
applied as stimulus(stress)
andthestrain(skew)
whichoccursinresponse.Generally,
themeasurement results are represented asa complexelasticitymodulus toinsure accurate expression.This relationship is shownbelow.
Iftherelationship betweenE* andTan5 isplotted, the result,isagraph liketheone
shown below.
E* = E'
+iE"
E"
tan
8
= E'[12]
pg.6E"
Figure 19
Fromtheresults ofthemodulus
testing
itcanbe seenthat treadmodulushasalargerinfluence
on overall noiselevels
than thesidewallmodulus. Anincrease in treadmoduluswhen averaged over allthevaryingconditions causednoise level increasesfrom 2to7
dBA,
and anincrease
insidewall modulus caused anoise level increasefrom 1 to3 dBA.Tread Modulus S.W. Modulus Interactions
Speed Mic. No. Low High Low High Extreme Gross
1 82.7 89.5 86.1 87.4 87.7 85.7
2 82 87.5 84.7 85.6 86.3 83.9
60MPH 3 82.3 87.2 84.2 86 86.1 84.1
4 80.7 84.5 81.3 84.1 83.8 81.7
5 80.1 82.6 80.7 82.1 82.2 80.5
1 80.1 85.9 82.4 84.4 84.6 82.2
2 78 84 80.8 82.7 82.9 80.4
45MPH 3 79.2 84.4 80.9 83.3 83.2 81
4 76.9 81.9 78.5 80.8 80.6 78.7
5 76 80.2 77.2 79.4 79.4 77.2
1 75.6 79.4 76.7 78.6 78.3 77.1
2 74.6 78.1 75.7 77.3 77.2 75.8
30MPH 3 74.8 79 75.7 78.4 78 76.2
4 73.9 77.3 74.4 76.9 76.6 74.8
5 73 76.4 74.1 75.5 75.7 73.8
avg.ofB&D avg.ofC&E avg. ofB&C avg. ofD&E avg. ofB&E avg. ofC&D
[image:29.556.52.509.204.427.2]Thisexperiment also shows that thereis a crosscoupling betweentreadandsidewall
effects. Forexample,
going from
low tohightreadmoduluswithlow sidewall modulusincreases noise
level
by
five
dBA. Whereasdoing
thesame with ahigh sidewall modulusproduces an increaseof
8.6
dBA. The influenceoftreadmodulus on sidewall moduluseffects are shownin thelasttwocolumns ofFigure 17:
Low to High Tread Modulus Lowto HighSidewall Modulus
Speed Mic. No. LowS.W. High S.W. Low TR. High TR.
1 5.0 8.6 -1.1 2.5
2 3.2 7.9 -2.2 2.5
60MPH 3 3.1 6.2 -0.1 3.0
4 2.0 5.2 0.9 4.1
5 0.8 3.9 -0.4 2.7
1 3.8 7.6 -0.5 3.3
2 2.9 7.1 -0.8 3.4
45MPH 3 3.3 6.7 0.2 3.6
4 3.5 6.3 0.5 3.3
5 2.3 5.8 0.0 3.5
1 2.9 4.6 0.9 2.6
2 2.2 4.6 0.2 2.6
30MPH 3 2.8 5.4 1.1 3.7
4 1.8 4.7 0.7 3.6
[image:30.556.66.498.207.434.2]5 1.6 5.0 -0.7 2.7
Figure 21 Interaction Effects
Change
in Noise Level(dBA) [12]
pg.7Thenoiselevel spectrum wasthenintegratedand plottedit as afunctionof
frequency.
[image:31.556.134.415.192.401.2]qooo 1CHXS
Figure 22 IntegratedSpectrum
[12]
pg.8The integratedspectrum at agiven
frequency
givesthe totalnoisecontributionuptothatfrequency
starting fromthefrequency
ofinterest. This is donefor differentmoduliMV
Tire Noise
(moduluseffects)
Speed=60mph
J
Tread Modulus Sidewall Modulus
B Low Low
c High Low
D Low High
E High High
itto 2000
Frequency
(Hz)Figure
23 Integrated NoiseSpectra
[12]
pg.8
icfe*
Itcanbeseenfromthis thatinthe
frequency
rangefrom 750to 1500Hz,
thecontributions vary significantly
depending
ontheparticulartread/sidewallmoduluscombination.In this
frequency
range, many noise-generatingmechanisms areinvolved.Themajorsourcesof noise are saidtobe
(a)
tread patterns, and(b)
radial andtangentialvibrationsofthe treadelements atthe entryand exit ofthe contact patch.It is also
described inthisreportthatvibrations generated atthecontactpatch dependon stiffness
(modulus)
andthedamping
ofthe treadelements. It isthenreasonedthathighmodulustreadblocksproducelarger levels ofvibration, resulting inmore noisefrom 750to 1500
Hz. Italsois observedthatahighmodulus sidewall amplifies thevibrations ofthehigh
modulustreadelements more effectively. Thisexplainsthecrosscoupling effect
observedin Figure 15 & 16.
Figure
29,
showstheoveralleffects oftreadand sidewalltandeltaontire noiseforall
testing
conditions. Itcan be seenthatthe tandeltaof eitherthe treads or sidewallhas negligible effectonoveralltirenoise levels.
Muthukrishnan
concludesthefollowing
from hisexperiments:1. Treadmodulushas a much larger influenceonexteriortirenoiselevelthan
sidewall modulus.
2. Tan deltaof eithertreador sidewall hastheleasteffect ontirenoiselevel.
3. Significant interactions existbetweentreadand sidewall properties. Noise
levels dependonthetreadand sidewallconditionstogether.
Thenextfewpagesincludeother
interesting
graphsfrom "EffectsofMaterialTERg
NQI5ETraca
To-nifc
tf'eCtSas -i
?e
Tira-E NQ1
aio#wgll T"on&- E^^eCi?
e-s -n
Figure
24,
25
Tread Tan Delta EffectsonTire
Noise,
Sidewall
Tan
Delta
EffectsonTire Noise
[12]
pg.9
[image:34.556.77.482.44.663.2]Pressure EffectsonTire Noise
(dBA)
RoadwheelTesting
Load: 636 Lbs.Microphone Location 1 MicrophoneLocation 2 Microphone Location 3 Microphone Location 4 Microphone Location 5 Speed
(MPH)
30 40 45 50 6020psi 35psi 20psi 35 psi 20psi 35psi 20psi 35psi 20psi 35psi
75.4 79.6 80 80.1 81.9 76.6 80.9 83 84.4 83.6 73.5 78.2 78.6 79 80.5 74.5 79.4 81.4 82.4 82.4 73.8 78.8 79.2 78.9 79.9 74.5 79.2 81.3 81.7 82 73.8 78 78.2 78 79.6 74.6 78.2 80 80.5 81.3 72.9 76.4 76.4 75.8 77.8 74.2 76.5 78.5 79 78.8
Roadwheel
Testing
Load:1190 Lbs.Microphone Location 1 Microphone Location 2 Microphone Location 3 Microphone Location 4 MicrophoneLocation 5 Speed
(MPH)
30 40 45 50 6020psi 35 psi 20psi 35psi 20 psi 35 psi 20psi 35psi 20psi 35psi
78.4 83.1 83.6 84.4 86.2 77.2 81.4 83 83.9 85.3 76.3 80.3 81.6 83.9 85.4 75.2 79.3 80.8 81.4 83.4 76 79.2 80 80.8 83.2 76.2 79.5 79.6 80 82.4 75.5 78.1 78.9 80.4 83.9 76.2 78.4 79.2 79.5 82.1 73.8 76.5 77.5 78.9 82.7 74.5 75.6 76.6 77.5 80.5
Figure 26 Pressure EffectsonTire Noise
(dBA)
[12]
Testing
at12
Hz.
Item
M
Control
odulus(p
Low
si)
High
Control
Tan
Delta
Low
High
Tread
2250
938
5048
0.22
0.11
0.265
Sidewall
100
530
2504
0.144
0.123
0.218
Rimstrip
2790
1444
8250
0.292
0.189
0.327
[image:35.576.16.565.56.310.2]Bead
Filler
5350
3901
23555
0.197
0.037
1.14
Figure 27 Material
Property
Values[12]
Tire Noise
(dBA)
Levels forallModulusandTan DeltaCombinations:RoadwheelTesting
Inflation Pressure: 35psi Load: 11 90 Lbs.
Low Tread LowSidewall
(B)
ModulusCombinations High Tread Low Tread Low Sidewall HighSidewall
(C)
(D)
High Tread High Sidewall(E)
Low Tread LowSidewall(F)
Modulus CombinationsHigh Tread LowTread
Low Sidewall High Sidewall
(G)
(H)
High Tread High Sidewall(J)
Speed(MPH)
Mic. No. Control(A)
601 85.3 83.2 88.2 82.1 90.7 86.0 87.1 86.2 85.8
2 83.7 83.0 86.2 80.8 88.7 84.4 85.7 85.1 84.1
3 82.9 82.5 85.6 82.4 88.6 84.3 84.2 84.9 84.1
4 82.3 80.2 82.2 81.1 86.3 83.4 83.0 83.0 82.7
5 81.1 80.3 81.1 79.9 83.8 82.5 82.2 81.7 82.0
45
1 82.9 80.3 84.1 79.8 87.4 82.2 83.4 83.2 82.7
2 81.0 79.2 82.1 78.4 85.5 81.0 81.8 82.4 81.4
3 79.9 79.1 82.4 79.3 86.0 81.9 81.0 81.7 80.1
4 79.0 76.6 80.1 77.1 83.4 80.6 79.1 79.5 77.6
5 76.7 76.0 78.3 76.0 81.8 77.9 77.0 77.2 76.4
30
1 77.0 75.1 78.0 76.0 80.6 77.2 79.1 77.7 79.1
2 75.3 74.5 76.7 74.7 79.3 75.8 77.5 76.3 77.9
|
3 75.9 74.2 77.0 75.3 80.7 76.6 77.2 75.9 77.6
4 75.6 73.5 75.3 74.2 78.9 76.1 76.7 75.8 76.8
5 74.4 73.3 74.9 72.6 77.6 74.6 74.2 75.4 74.1
Figure28 Tire
Noise,
AllCombinations
[12]
Speed
(MPH)
Mic. No.Tread T Low an delta High Sidewall Low Tan delta High Interactions Extreme Cross 60
1 86.1 86.5 86.6 86.0 85.9 86.7
2 84.8 84.9 85.1 84.6 84.3 85.4
3 84.6 84.2 84.3 84.5 84.2 84.6
4 83.2 82.9 83.2 82.9 83.1 83.0
5 82.1 82.1 82.4 81.9 82.3 82.0
45
1 82.3 83.1 82.8 83.0 82.5 83.3
2 81.7 81.6 81.4 81.9 81.2 82.1
3 81.8 80.6 81.5 80.9 81.0 81.4
4 80.1 78.4 79.9 78.6 79.2 79.3
5 77.6 76.7 77.5 76.8 77.2 77.1
30
1 77.5 79.1 78.2 78.4 78.2 78.4
2 76.1 77.7 76.7 77.1 76.9 76.9
3 76.3 77.4 76.9 76.8 77.1 76.6
4 76.0 76.8 76.4 76.3 76.5 76.3
5 75.0 74.2 74.4 74.8 74.4 74.8
tJ
Avg.of F&BtJ
Avg.of G&Jtr
Avg.of F&Gtr
Avg. of H&JtJ
Avg.of F&Jtr
Avg.of G&HFigure 29 Tan Delta Effectsontire
Noise
(dBA) [12]
[image:36.581.86.486.353.629.2]Chapter
VII
-Tire
Construction
and
Noise
In thearticle"Investigation intotheInfluence of Tire Construction on
Coast-by
Noise"
by
Doan,
Brackin, Nishihata,
andSauer Zapf[18],
the dominantsource oftirenoiseis identifiedas shouldertiretreadvibration.It is generally knownthatahighpeak
value exists at around onekHz. Inthecoast-bynoisespectrum andthis
frequency
dominatesthecoast-bynoiselevel. Thisphenomenon occursin tires
having
treadedpatterns and alsofor blanktires. Rib-styletreadpatternedtires areusuallyquieterand
showthe smallestdifference innoiselevelsas comparedtoblanktires. Tireconstruction
and materials will havetobetakenintoaccounttoreduce noiselevels. Noise is notonly
generated
by
tread patterns,butalsoby
thevibration ofthe tirecomponents.
&-<-1
a
-63
J
^
f
fi
0 0
1.1
u
I- ! ', v
II
i'iflftSnjIO0* Cixi*a 7aotftQE"-ii*
Tinic (Soc] O fiK
Figure
30
Excitation LevelofTreadsasThey
Pass
Through theContact
Region,
[image:37.556.83.445.406.661.2]Thevibrations were measured with accelerometersmounted atthecenter ofthe
belt,
nearthebeltedge,andthe sidewall ofthe tire.Thevibrations atthecenterandbeltedges are referredtoas 'tread
part'
vibrations.
Looking
atFigure 31below,
at 1 kHz itcanbeseen thatthe
leading
andtrailing
edges arenoise sources. Resultsshowthat tirenoise around 1 kHz is generated
by
treadpartvibration attheleading
edge,trailing
edge,and shouldertreads, andthattheacceleration ofthe treadpartis greaterthanthatofthe
sidewall especiallyaround 1 kHz. The
following
graphs showthattire treadbandvibrationdoes in factgenerate noisesources relatedto thesound produced
by
coast-bytests.
Size: 2IS/70R16
,. Putcra: Maingroovesoc.ly
9
0Srral 57 bet
I
MJf
v.[5
Lcodng&3D
Trading E<J*
5 t SsMh "-'"v-.
(at MeanendOmi-<S<isLevsis.
.IL
V
'
I JX 2.5K
i,V,MrctrtiiTicd VB&rKdeeAzcc:rc~<:.r.Leuela.
HG.il.
-Gr^lhmwf^tofottb^tenCMW-hyxoB*l^si^t^y(br*t<>iiIm>s
Figure
31 Graphs
Showing
Correlation BetweenCoast-By
Noise
andtread Vibration Levels[18]
[image:38.556.84.499.325.570.2]Thecorrelation coefficientsthat
they
reportedfortheshouldertreadvibration andthegeneratedtirenoiseis
relatively
high,
as comparedto thecentertreadvibrationandthegeneratedtirenoise.
I,J>HUE 1 t"'^TvfeiY.-uj/nit,r<il v.AiYnv.-.n d!Ikeshotftdkr
irriii"
SMJc.>.-W->'imliS5awAwr<*-Mrirxfiitose,
C;.m I'V-aii Noise ImlivJ.
L"'I'JJVoivc
40 5fl "HI 70 " 5D >*0
km.ti km^ km.-. K-nirt. km." klt^, ki/b ^'^
Figure 32
Correlation
betweenvibrationattheshouldertreadand coast-bynoise/indoordrumtirenoise
[18]
They
found highaccelerationlevelsattheleading
andtrailing
edges andrelatively lowlevels in thecontactregion.
They
also say,"Thecontactpressure andtirestiffnessmaybeusedtodescribe thissystem ofvibration,becausethecontactpressure canbe thought
ofas aforcewhich acts onthetire, andtheamplitudeoftirevibration canthoughtofas
being
dependentontirestiffness.Thismeansthat treadvibrationisequaltotheinputforcesmultiplied
by
some vibration transferproperties."
Thetreadvibration mechanism
model couldbeexplainedin detail asfollows: The inputforcecanbeseenin Figure 33
foj TJw VitratumMedianhm
t
(b)Context Prrrsvr*
Itf
yJ
iii
Simian tfTiodPuI
CWirfTjMdftn
Figure 33 Tire Forcesatthe
Leading
andTrailing
Edgescausedby
ContactPressure Variation andRoad Surface Roughness
[18]
The dynamicpressureincreasesatthe
leading
edge(AB),
staysnearlyconstantduring
contact
(BC),
andthendecreases atthetrailing
edge(CD). Thiscontactdistribution canbe assumedtoberepresentative oftheforcesthatexcitethe tirestructure. The amplitude
ofthemaximumdynamic contact pressure aroundB andC canbeconsidered asthe
maximum amplitude oftheexcitationforcespresent. In addition,theroad surface
roughnesstends to amplifytheexcitation forcesand mustbe considered.Thetirein
Figure33 isapproximated
by
the springmassdamperandstep inputsystemofFigure 349
fr
if
r~
JPt^SfiSwfwBWlOS
c ;>
I
.tC'***iWt
i'.v.i,J^-.,iimtft f^-v
Ur<4fFrequency <Hi)
Figure
34A
typicaltire transferfunctionand systemused torepresenttirepropertiesa) theWherethemaximum
dynamic
contactpressure, attheleading
andtrailing
edges,representsthe
input forces.
Ifthishypothesis
isused, thedisplacementresponsestepfunction
x(t) inthe timedomain
can beexpressed as:x(t)=F*
(
1-e-a>t cosXn4l-C2t)+y=L=sin
[18]
Where:
x(t) =
displacement
responseF=input force
K=stiffness
t\
=damping
ratioC0n=natural radial
frequency
Dueto the
difficulty
ofcalculatingthedamping
ratio andthemass effects,they
furthersimplifythemodel
by
assumingthedisplacementresponseis onlyproportionalto theinputforcemultiplied
by
thereciprocal ofthestiffness,as shownintheequationbelow:x{t) - F*
[18]
KInthis equation,Frepresentstheinputforceand1/K isthe transfer
function. Further
theinput
force,
F,
canbeapproximatedby
usingthemaximumdynamic
contact pressure andtheroad surfaceroughness,and canbe representedin therelation
below:
*(0=ar*P*
[18]
lv
Inwhich:
a=road roughness coefficient
P=
dynamic
contact pressureK=tire stiffness
Theauthors also saythat thecenter contact pressure andthetread
bending
stiffnessattheshoulderhave themostinfluenceon theshouldertreadvibration.
Therefore,
having
atirewith alowercontactpressurearoundthecenter andanincreasedtread
bending
stiffnessatthe shouldershould reducetheshouldertread vibration, thusreducingthenoiseit
produces.Thetiretreadvibration onthe shoulder was obtainedusing linearregression
analysis.
14
.--i
MtrsA
I
r-CJ?rtJ!;-r
71 3 Zi
ft
,s> s
s
" V-1-1
3 "3
.C t
s^ K*fr
!_*;<:>* W.iJ.1.
C
I
small[
i^reaMEASUREDVALUE
i*
J
Figure35 Calculatedcorrelationvaluestableand graphshowingactual versus
estimatedtreadvibration
for
aspeed of60 km/hr.
[image:42.556.77.470.442.667.2]and resultsinthe
following
equation:x{t) =
a0
+ ai*Pa*--[18]
Ksh
inwhich:ao,ai = single regression constants
Pce
=static pressure around centerKsh
=treadbending
stiffness aroundtheshoulderBasedontheir research,
they
madethefollowing
conclusions:1. Theregionofthe tire inthevicinityofthe contactpatchdominatestire treadvibration
2. The A-weightedspectra oftreadpartacceleration,coast-bynoise, andindoordrum
testnoise
display
thesametendency
(ahighpeak around1 kHz.).3. Shouldertreadvibrationisthenoise source thathasthemost relation to tirenoise
produced.
4.
Lowering
thecenter contact pressure and/orincreasing
theshouldertreadbending
Chapter VIII
-Section 1: Road Texture
and
Tire/Road Noise
Intheconference paper
"Relationships
between Road TextureandTire/RoadNoise"
from Noise-Con
96,
Yasuo OshinoandHideki Tachibana[7],
performedastudyof noise radiatedfroma passenger car andamedium sizedtruckanddifferentroad
surfaces
(paving
materials,chipping sized grain andsurfacetexture).Fromthisinvestigation,
relationshipsbetweentire/roadnoiseandroadsurfacecharacteristics weredeveloped. Inthisstudy, twokinds ofmeasurements were made.Thefirstonewas
performed on atest trackpaved withfive kindsof constructions
by
usingapassenger carand a medium sizedtruck.
Therefore,
it has been confirmedthat thesoundpowerspectrum oftire/roadnoise variesquite abit duetodifferences intheroad surface
materials.
They
also statedthat theopen graded asphaltsurfaceisthe best amongalltested toreducethe tire/roadnoise.
Tire/roadnoise was alsomeasuredatsixteen sites of publicroads paved with
denseasphalt concrete
by
usingthesame passenger carequipped withfourtypesoftireandthesame medium sizedtruckequippedwithtwo types oftire.
They
foundthat thegeneral
tendency
impliedthat tire/roadnoiseincreaseswiththeincreaseoftexturedepth.This has been found foralmost alltiresbuttherelationshipvaries dueto the typeoftire.
Theseresults suggestthat thereis a greaterexciting forceonthetread
bands
attheleading
andtrailing
edges. Sothedeeperthetexturedepth,
themorethe treadbandsgetexcited, andhence thegreaterthenoise produced.
Chapter
VIII
-Section 1: Air
Pumping
as aNoise
Source
Anothersource oftirenoiseis air pumping. Airpumping,occurswhen air
movementfromtreadvoids give risetomonopole sound radiation.Itis acousticallya
local source, with sound radiated
directly
asthe void compresses.This is validatedas asound sourcein thearticle"The Generation of Tire NoiseandCarcass
Vibration",
Plotkin,
Montroll,
Fuller,
Intemoise-1980 [4]. Intheir study,they
foundthat there areconcentrated noise sources consistent with air pumping.These wereidentifiedatthe
entranceto thecontactpatch.Thesoundpressureduetoairpumping is
directly
relatedtothesecondderivativeofthevolume ofairdisplaced fromtreadvoids.The void profiles
were
directly
measuredforthe test tires. Thiswas accomplishedby
measuringthevolume of waterdisplacedfromabladder inthevoidasthe tirewas advancedthrough
thecontactpatch.Themeasured profiles werethendifferentiatednumerically.The
calculated results showed good agreement withthemeasured sound pressure. The
calculationsstrongly suggestthattheconcentrated sources observed wereduetoair
pumping.
Chapter
IX
-Methods
of
Measuring
Tire
Noise
Tire/pavement
interaction
produces a non-uniform noiseradiation. There arethreeareasin which noiseis radiated;
they
aretheleading
edge,trailing
edge, and sidewallregions,nearthecontact region(see Figure 31).w
Trailing
Edge
Leading
Edge
Contact
Region
Figure36
Therearethreeprominentmethodsfor measuringtire/roadnoise:The Coast
by
Method,
TheLaboratory
DrumMethod,
andThe Trailermethod.The Coast
by
Method isthemost representativeof actualfield operatingconditions and soundpropagationto the road environment. Inthismethod, the testvehiclecoastsby
a roadside microphone,whichis placed1.2m abovetheroadlevel and7.5 mfromthe centerline ofthevehicle's path. Theengineis switchedoff.Using
atimeconstantnicknamedfast anda
frequency
rating"A,"
themaximum soundlevel
during
thecoast-by
is recorded.It isrecommendedthatthefrequency
spectrum also berecorded atthemaximum sound
level,
althoughthisisnotmandatory.Usually,
fiveruns are made andaveraged. Asforall methods, therecommendedspeedis 70
km/hr.
Iflower
orhigher
[image:46.556.146.410.208.412.2]speeds arerequired,it isrecommendedthat
they
be chosenfrom30,
50, 90,
or 110 km/hr.Themain reasonsfor
choosing
70km/hr
arethatthisspeed givesgoodsignaltonoiseratio andlow
influence
of external variables(suchastestvehicledesign)
aswell as safeand practical
driving
conditions. Inaddition, 70km/hr isa speed atwhichtire/roadnoiseis
likely
tobea great nuisanceto theenvironmentinmosttypesoftraffic. Thismethodcanbeusedfortype
testing
oftiresand roadsurfaces,andforalltesting
wherehighprecision and representative operation are essential. TheCoast
by
Methoddoes have itsdisadvantages,
such as:a specialtest trackor aroadwith suitablesurfaceisrequired;
atestvehicle equippedwith4-6test tiresisrequired; the testvehicle mustbe
coasted alongthe test area;
unlesscareis taken theremay bean influence fromvehicletype,
brakes,
transmissionandsuspension.
There may bepracticalandsafetyproblemsforsomevehicles when
they
arecoasted.
In addition,itis necessarytominimize:
climatic andmeteorological
influences;
Sensitivity
todisturbance fromothertraffic, ifany, and otherbackground
noises.
IntheTrailer
Method,
atest tireis mountedon atrailer,
whichistowedby
a carortruck. Thetrailermay be ofasingle-wheeltypeorhaveextra
supporting
wheels. Amicrophoneispositioned closeto the tire/roadinterfaceandthearticulated vehicleis
driven alongatesttrack or a road
having
asuitable surface. The microphone positionis0.2moutsidetheundeflectedtire sidewall, .lmabovetheroadleveland0.2m behindthe
vertical axle plane. The 0.2m distances are changedto0.4m fortruck tires. In orderto
increasethesignal/noise ratio and reduce climatic
influence,
an enclosure aroundthe testtireand microphoneissometimes used. Specialcareconcerning acoustical reflections
mustthenbeobserved. Thismethodis suitable whererelatively highprecisionis
requiredbutsome lackofrealistic operationcanbe accepted. It is especially
recommendedinenvironmentswith
disturbing
traffic, for instanceonhighly
traffickedroads where no other methodis possiblewithoutclosingtheroad.
Long
measuringtimescanbeusedtoreduceerrors. The disadvantages ofthismethodare:
Itrequiresaspecialtowedtrailer;
Backgroundnoisefromwindturbulenceinthemicrophone canbe a problem
atlow
frequencies;
Theclose measurement position gives somelackof realismduetoacoustical
reflections; and
Thenear-field microphonelocation is unsuitableforroadsurfaces
having
asignificant sound absorption.
In the
Laboratory
DrumMethod,
atest tireis mounted sothatitcan roll against adrumsurface. Special care mustbetakenconcerningtheacoustical environment. The
microphoneispositionedas inthe trailermethod. A drumdiameterof atleast 1.5m is
requiredforan "outer drum"
facility,
whenthetireisrolledagainsttheouter part ofthedrumshell. Thismethodis suitable wherehigh precisionis important
but
lack of realisticoperation canbeaccepted.
Surveys
of noise emissionfrom largenumbers oftiresundervariousoperatingconditions canbecarried outin a shorttime. Thismethod could also
beusefulforresearch and
development
work andfordetecting
smalldifferences innoiseemission
from different
tires. It isindependent
of weather conditions andrequireslittlespace andonlyonetiresample pertest.
Long
measuringtimescanbeusedtoreduceerrors. The
disadvantages
ofthismethodare:Aspecialdrum
facility
is required;The drum isnot a good representativeofroad surfacedue toitscurvature.
Inallthree methods,many factors influencethemeasurednoise. Thesefactors
includetiretype,road surfacetype,area ofcontactpatch,tireinflationpressure,and
vehicle speed. In general,withanycombination oftheabovevariablesthesoundlevel
increases asthevehicle speedincreases.
InthereportTire/Pavement Interaction Noise Source Identification using
Multi-PlanarNearfield Acoustical
Holography
by
Richard J. RuhalaandCourtney
B.Burroughs
(1999)
[16],
theauthors usedthe trailermethod andidentifiedthemajor areasofmaximum noise radiationtobethe
trailing
edge,leading
edge, and sidewallregionsnearthecontactpatch.Twotiresweretestedinthis experiment, a monopitchtire and a
[image:49.557.191.384.576.643.2]productiontire.
Figure 37. Photographofmonopitch
(left)
and productiontirethreads.[14]
Themonopitchtire
has
64 equally spacedtransversegroovescutinit,
alongwiththreecircumfrential grooves.Thetreadpassage
frequency
isequalto:_
NV
Where N isthenumberoftransverse grooves,V isthevehiclespeed, andC isthe
circumference ofthetire.Theproductiontirehastreadblocksthatvary insize and
spacing aroundthecircumference ofthe tire. Thetire alsohas fourcircumfrential
groovesthatseparatethreerowsof55treadblocksandtworowsof89 blocks. The
sidewallhasoneplypolyestercord;the treadhas three, one polyester cordandtwosteel
cords. Thistestshowedthat thereis speeddependenceon sound pressure levels.
Overall,
bothtiresshowedincreasedsound pressurelevelswithincreasedspeed,butthesound
pressurelevel fromthemonopitch tiredidnot alwaysincreasewith speed.
This, they
sayis probably dueto the treadpassageharmonics cyclingthroughvarious resonances.
Thenoise
levels
oftheleading
edge,trailing
edge,andsidewall change withspeed.Thenoise level forthemonopitchtireincreasedwith speed above40 km/hrat
(a)
120 -110 !Loading
-D-Trailing
00 1oo -A-Sidewall u c 90 BO 1 Q. 70 j-so _,10 56 ioo
Spaed
(km/hr)
(b)
m a. 120 i HO +-t 10O 90 80 70 60\
1?-Leading
j
">Trailing
k-Si
dwall10
Speed
(km/hr)
100
Figure
38
Sound pressurelevels in dB. Ref. 20uPainthefrequency
range2600
Hz. for(a)
monopitchand(b)
productiontires.[14]
[image:51.556.51.498.136.643.2]40*log(speed).
Fortheproductiontire,
theleading
andtrailing
edgesdominatethesidewall noise above40
km/hr.
Theoverall noise level increasesat arateof40*log(speed)
below 56km/hr,
and20*log(speed)
above56 km/hr.For
further
analysis, themonopitch andtheproductiontiresweretestedata speedof58 km/hron smooth asphalt pavement. Forthemonopitchtire,theareas of maximum
radiation were
localized
tothesidewall neartheleading
edge,centerline oftheleading
(a)
side 1 , > ,i \\ J~ rx^*** f^>>M7S '.* ''>\l*\'~,*
[image:52.556.93.465.235.600.2]* |V'"SJ<*.-,'
'
"
: X
\ffl-fr'Y Jg
-'
W/^>^=r^f^ :A
-0> 0.1 8 4 0
J
fror(
it^4\
/ :HI
(((
fror t " rear
"
Cn
^
\Figure 39 Threeviews of active acoustic
intensity
frommonopitchtirerunning
on smoothasphalt at56 km/hr.
Frequency
ranges are(a)
450 Hz. To550
Hz.(tread
passagefrequency),
(b)
900to 1100Hz.,
and(c)
1400 Hz.To
1600 Hz.Data
arereconstructed[14]
edge,and centerline ofthe
trailing
edge. Thespectrumwasdominatedby
theharmonicsofthetreadpassage events.Atthetreadpassage
frequency
of500Hz,
radiationfromthesidewalldominatedthesoundpower.Thisnoise wasmainly generated
by
the vibrationofthesidewall dueto theradial
(normal)
displacementofthe treadblocks passingthroughthecontact region. AtonekHzthenoiseisgenerated
by
thesamemeans,but has nearlyequal radiationalongthe
leading
edgetrailing
edge,andthe sideofthecontact patch.At1.5
kHz,
noise radiationis localizedtotheleading
andtrailing
edges.Theprobable causeofthisis vibrationenhanced
by
airpumpingandthe second mode ofthecircumfrentialFortheproduction
tire, less
radiationis observedfromthesidewall and morefromthe
leading
andtrailing
edges.Between 500 Hz and onekHzthefrequenciesincreasewithspeed,
showing
thatthey
are relatedto thetreadpassage events.Thesoundpoweris highest from
650
Hzto950Hz,
whichis probablyamplifiedby
thefirstmode ofcircumfrential groove resonance and air pumping.
Again,
thenoiseislikely
generated'
rear
s * i t.
ft
(b)
(c)
front
1
m
!vlFigure 40 Threeviews of activeacoustic
intensity
from
production tirerunning
onsmooth asphaltat56 km/hr.
Frequency
rangesare(a)
300
Hz.To 600
Hz.(tread
passage
frequency), (b)
650
Hz. to 950Hz.,
and(c)
1300Hz.
To1500 Hz. Data
arereconstructedon planes
touching
surface oftire.Contour lines
arein 2 dB.increments
beginning
at78
dB.Solid
contourlines are positiveanddashedlines
represent negative directionnormaltotheplane.[14]
[image:54.556.102.484.196.582.2]fromvibrations ofthe treadband duetoradial
(normal)
displacementofthe treadblockspassingthrough thecontact region atthe
leading
andtrailing
edges.Thesecond modeofthecircumfrentialgroove resonance canbeseeninthe
frequency
region from (1300 Hzto 1500 Hz). Ateven higher
frequencies,
generationis localizedto thecontact patch nearthe
leading
edge andmay becausedby
treadsbeing
forced intothecontact region.Chapter
X
-Patch
Frequency
Inthissection, a
dynamic
model of atireisdeveloped.
Thetire hasa radius('R')
inmeters, and angular speed
(to)
inradians/sec.Theouter circumferenceofthe tireisW
Trailing
Edge
Leading
Edge
Contact
Region
Figure 41
madeupof,
NPi
numberof patches. Apatch consists of atreadpattern anda gap.Thetotallengthofthepatch isthecircumfrential
length
ofthe tread(I)
plusthecircumfrentiallength ofthegap (y).
[image:56.556.123.445.199.435.2]I
Figure 42 Patch
Thenumber of patches on atire
(Np)
is thecircumference ofthe tiredividedby
thepatchlength. (This is always a wholenumber)
tire
circumference
2nR
Np
= =patch
length
/
+
y
The
frequency
ofpatches passingthrough thecontact regionistheangularspeedtimesthenumber of patchesdivided
by
theperiod,27t:fi)N
f
=J n
In
Another formofthisequationis:
VN
f,
= p2nR
In whichV is thevehicle speedandR isthe tireradius.
Frequencieswerethengraphedfor
increasing
speedsand agivenNp.
Tofindanappropriate rangeofangularvelocities,carspeeds, 0to 180
km/hr,
were chosenandconvertedtom/s.
Next,
aradius of.2159m(17")
waschosen;anywheelradius couldhave beenchosen.The speed wasthen convertedtoangularvelocity usingtheequation
(0=V/R, which has unitsofradians/second.
Next,
randomvaluesofNp
werechosenstarting from Np=10toNp=100. Thesegraphs showthelinearrelation betweenpatch
f(hz)
vs. N &W(rad/sec)
300000
250000
200000
r 150000
100000
50000
- N=10 -N=20
N=30 N=40 *-N=50 --N=60
+-N=70
N=80 N=90 N=100
0 2000 4000 6000 8000 10000 12000 14000 16000 18000 20000
[image:58.585.22.536.26.408.2]w(rad/sec)
Figure 43
Frequency
inHz. vs.AngularSpeed,
u)Theamplitudeofnoise producedfrompatches wouldbeafunctionofthedepthorlength
ofthe treads onthe tire. Thegreaterthe treadlengththegreatertheexcitationwhengoing
through thecontact region.
Chapter
XI
-Tire Bulge
When atireisrolling, thetirecarcass nearthecontact patchbulges out.
Figure 44
Theextentofthebulge dependsonthelateralstiffness,
KL,
ofthe tire. Itcanbeobservedthat themorebulgeatirehasthelouderthenoiseitradiates(flattire). Sincethe amount
ofbulge is
inversely
proportionalto thelateralstiffness ofthetire,theamplitude ofthenoiseisproportionalto tirebulge and
inversely
proportionalto thelateral stiffness.A
noise ~Tire
Bule
K
KL
ocItcan alsobesaidthat thelengthofthecontactregion,
Cp,
isinversely
proportionaltothelateralstiffness.
cp~
1
KL
Asimple analysis canbeusedtodeterminethe
frequency
ofthebulgewith varyingangulartirespeeds.
Figure45
Where: to=theangular speedofthe tire.
R=theradius to theoutside ofthe tire
Cp
= lengthof contact regionSp
=Arc lengthoftirewithincontact region0
=AngleofArcSp
Nsp
=numberofSp'spertireThearclength
Sp
equalsR*9 .Next,
usingthelaw ofcosines:2_td2 or.2
CP
=2R2-2R2cos(6)
Solving
for0,
9
=cos"1
(-CP2+2R2^
2R2
Substituting
intoSp,
Sp
f-Cp2+2R2^
2R2
V. J
Theamplitude of noiseis proportionalto thevelocityofthetire,whichisequalto the
tire'sangularvelocitytimes theradiusofthetire,
Ano,seoc^
=*^
In which ct)istheangularvelocityofthetire, R istheouterradius ofthetire, andV isthe
Chapter
XII
-The
Rubbing
Theory
Atirerubbingor
sliding
on a surfaceisanother source oftirenoise.Thiscanbeexplained
by
whati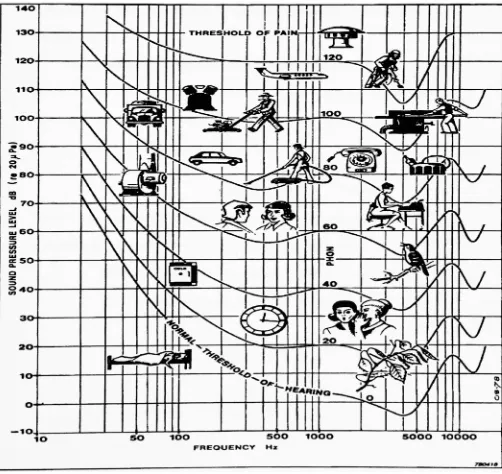
![Figure 3 Filament arrangements that are used in pneumatic tires, a) woven cordb) weftlesscordc) Cord with light wefts [1] pg.360](https://thumb-us.123doks.com/thumbv2/123dok_us/123540.11974/16.556.168.365.534.664/figure-filament-arrangements-pneumatic-tires-woven-cordb-weftlesscordc.webp)
![Figure 7 Toroidal membrane on cylindrical rim [1] pg. 396](https://thumb-us.123doks.com/thumbv2/123dok_us/123540.11974/19.556.228.370.219.330/figure-toroidal-membrane-on-cylindrical-rim-pg.webp)
![Figure 10 Polar plot of radially outward component ofwall tension of membrane toroid on inner cylinder [1]pg.397](https://thumb-us.123doks.com/thumbv2/123dok_us/123540.11974/21.556.195.351.148.297/figure-polar-radially-outward-component-tension-membrane-cylinder.webp)
![Figure 14Load Effects on Tire Noise (dBA) [12] pg. 3](https://thumb-us.123doks.com/thumbv2/123dok_us/123540.11974/25.576.147.395.380.651/figure-load-effects-tire-noise-dba-pg.webp)
![Figure 16 Speed Effect on Tire Noise [12] pg. 5](https://thumb-us.123doks.com/thumbv2/123dok_us/123540.11974/26.556.76.487.156.569/figure-speed-effect-tire-noise-pg.webp)
![Figure 18 Tan Delta and Elastic Modulus [12] pg. 2](https://thumb-us.123doks.com/thumbv2/123dok_us/123540.11974/27.556.126.410.57.376/figure-tan-delta-and-elastic-modulus-pg.webp)
![Figure 20 Modulus Effects on Tire Road Noise (dBA) [12] pg. 6](https://thumb-us.123doks.com/thumbv2/123dok_us/123540.11974/29.556.52.509.204.427/figure-modulus-effects-tire-road-noise-dba-pg.webp)
