Effect of Edge Conditions on the Formability of Commercially
Pure Titanium Sheet (Grade 2) at Room Temperature
J.S. Kwame1*, E. Yakushina2, P. Blackwell1
1Department of Design, Manufacture and Engineering Management, University of Strathclyde, United Kingdom
2Advanced Forming Research Centre (AFRC), University of Strathclyde, United Kingdom
Abstract
Titanium and its alloys are difficult to form, particularly at room temperature, due to their crystallographic structure and limited availability of slip systems. Such limited formability could be exacerbated by virtue of the technique used to cut the sheet. Forming limit diagrams will not necessarily recognize such effects, which can lead to failures during forming trials. An example of a situation where this could be demonstrated is in sheet with pre-fabricated holes. This work used a hemispherical punch to stretch in-plane a 20mm diameter hole prepared with laser, EDM and AWJ cutting techniques in order to quantify the edge formability of the material. It was identified that, the edge surface conditions have a major impact on the edge formability of the material. The edges of the material prepared with EDM showed very high formability tendencies compared with AWJ and laser cutting. The work proposed an alternative characterization method that could be adopted for edge formability assessment.
Keywords: Hole expansion test, edge surface defects, hole expansion ratio, edge formability
1.
Introduction
Titanium and its alloys are widely used in the aerospace industry because of their high strength to weight ratio and corrosion resistance (due to their passivation capabilities) [1]. However, one of the drawbacks in the adoption of titanium alloys is their poor workability at room temperature. According to Adamus [2], the poor drawability of titanium alloys at low temperature can be attributed to their high yield strength as well as high yield-to-tensile ratio values. According to Chen & Chiu, [3], the limited level of formability in JIS Grade 1 Commercially pure titanium (CP-Ti) at room temperature can be attributed to its hexagonal close-packed (HCP) structures, resulting in their low ductility. There is therefore the need to continuously explore the possibility of forming titanium at lower temperatures. Another important facet of titanium sheet formability that requires special attention is its ability to be formed with pre-fabricated holes. Considering the tendency of an edge to fail during forming, understanding the influence of different processing methods could provide vital information required during the fabrication of aerospace components. Failure limit projection in sheet metals edges can be cumbersome when there is insufficient information about the efficacy of the machining processes adopted in fabricating the sheet edges. A reliance on the conventional forming limit diagram to predict the failure of sheet with holes may be insufficient. This is mainly because the hole areas may be subject to localized deformation during
fabrication, which could alter the stress state in the material.
Hole flanging is a sheet forming technique widely adopted in the automobile, aerospace and astronautic industry for working sheets with pre-processed holes to make various shapes of flanges [4]. The stretch flanging of sheet metals thus becomes an essential forming property that can be used to evade failure during component forming. The hole expansion test (HET) is usually utilized to quantify the stretch flangeability of sheet metals. There is the need to understand the metallurgical parameters which influence the optimum attainment of sheet edge formability. The hole expansion ratio (HER) expresses the degree of edge formability and is evaluated by finding the percentage of the difference between the final and the initial hole diameter divided by the initial hole diameter [5];
𝐻𝐸𝑅 =𝐷𝑓−𝐷𝑜
𝐷𝑜 × 100% ………(1)
Where; Df- final diameter and Do initial diameter of
the fabricated hole
compared trends with HER outcomes observed in the material.
2.
Experimental Procedure
2.1 The Material
The material investigated in this research is
the CP-Ti sheet (Grade 2) with a thickness of 1.6mm supplied
[image:2.595.320.521.67.245.2]by TIMET. The chemical composition of the material is listed in Table 1. This material forms part of the pure titanium family with reasonable strength and ductility and are mostly utilised in airframe skin applications. The as-received microstructure revealed a fine equiaxed grained structure with an average grain size of 5.7 ±0.5μm, Figure 1.
Table 1. Chemical composition
Elements Ti C O N Fe H Composition,
%
≥98.9 0.08 0.25 0.03 0.3 0.015
Figure 1. Micrograph of as-received CP-Ti (Grade2)
2.2 Mechanical properties
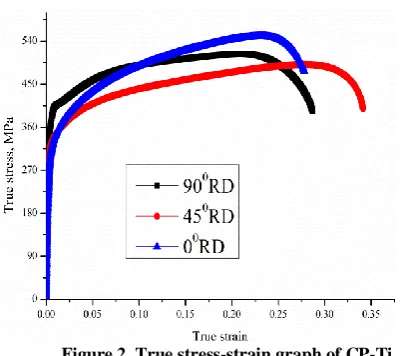
A 150kN load cell tensile testing machine; a Zwick/ Roell Z150, was used to perform uniaxial tensile tests on the material at room temperature in accordance with ISO 6892-1:2016. A dog-bone tensile test sample with gage section dimension of 50×12.5×1.6mm was used. The material was deformed at a constant strain rate of 0.001/s and the change in length captured with an extensometer. The mechanical properties were explored in three directions with respect to the sheet rolling direction and are presented in Table 2. The true stress-strain curve of the material explored in three directions showed the high anisotropy of the material, Figure 2.
Table 2. Mechanical properties
Sheet orientation
Yield strength,
MPa
Tensile strength,
MPa
Poisson ratio
00RD 197.99 550.31 0.33
450RD 218.19 489.43 0.75
900RD 250.05 513.25 0.9
Figure 2. True stress-strain graph of CP-Ti (Grade 2) at room temperature
2.3 Hole edge preparation
Three different cutting methods were used to fabricate the hole edges studied in this work; Laser, EDM and AWJ. For the AWJ test samples, a Calypso Waterjet with a 60HP KMT pump charged with an abrasive feed of 300g/min was employed. The EDM samples were machined using a GF F1 440 CCS machine equipped with a 0.25mm brass wire. For the Laser cut samples, an AMADA LCG-3015 AJ machine furnished with a 4KW laser and fibre engine was used.
2.4 Hole expansion test
[image:2.595.73.280.276.468.2]A hole expansion test was used to determine the hole edge stretchability of CP-Ti (Grade 2) at room temperature. A Zwick/ Roell BUP 1000 testing machine equipped with a Nakajima (hemispherical) punch was used to deform the sheet via in-plane stretching about the sheet plane until fracture. A 20mm diameter hole fabricated in a 200mm diameter disc with either laser, EDM or AWJ was stretched with a 100mm diameter hemispherical punch at a speed of 1mm/s; Figure 3. A blankholder force of 100kN was used to ensure that the material was restricted from drawing-in. The test was terminated when a crack through the entire edge thickness occurred.
[image:2.595.315.559.603.725.2]3.
Results and Discussion
3.1 Edge conditions
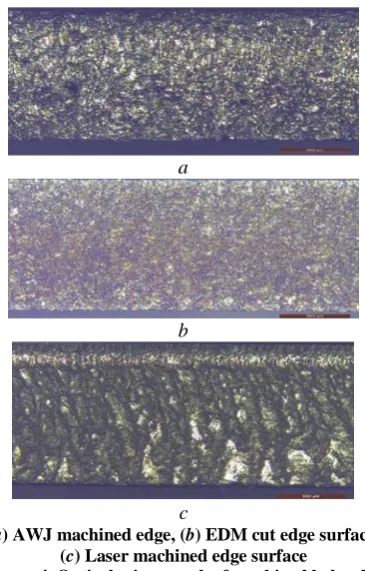
An optical microscope was used to characterize the edge surface microstructure after laser, AWJ and EDM machining; Figure 4. The surface micrograph of CP-Ti (Grade 2) after AWJ cutting was characterized by its mechanical erosion attributes as a consequence of the paths traversed by abrasive particles during the cutting process; Figure 4a. The edge surface after EDM cutting shows thermal erosion attributes as a result of the melting of part surface followed by quick cooling; Figure 4b. The laser cut edge micrograph also shows periodic kerf width and high depth of surface striations due to part remelts linked to the thermo-mechanical effect of the laser cutting process, Figure 4c.
a
b
c
[image:3.595.314.528.241.406.2](a) AWJ machined edge, (b) EDM cut edge surface, (c) Laser machined edge surface
Figure 4. Optical micrograph of machined hole edge of CP-Ti (Grade 2)
3.2 Impact of machining on HER
Figure 5 shows the hole expansion ratio of CP-Ti (Grade 2) processed with different cutting methods. The material exhibited the best edge formability when processed with the EDM cutting method. The edge formability effect after EDM was more than twice that observed with the AWJ cutting method. The material also showed a very poor edge stretchability tendency, when processed with the laser cutting method. A slightly improved performance was obtained via the AWJ cutting method. These sensitivities of the material to the cut edge condition is due the surface microstructure alterations introduced during the machining process.
[image:3.595.84.267.280.566.2]The grooves produced by the abrasive particles during AWJ machining as well as the high striation depths produced by virtue of the laser power acts as zones of stress concentration, which leads to the pre-mature failure of the material. EDM surface on the other hand features less severe surface grooves and cratering compared to the other cutting methods, hence the trend. Another contributing factor to the poor edge formability of the laser cut surface is its tendency to produce heat affected zones around the hole edges. This has the tendency of increasing the local surface hardness around the machined regions thereby reducing the formability around the hole area drastically.
[image:3.595.342.497.532.761.2]Figure 5. HER of CP-Ti (Grade 2) fabricated with three different cutting methods
Figure 6 shows the dome height evolution for each cut edge sample after HET. The EDM processed sample; Figure 6a showed the highest dome height (36.15±0.66mm), followed by AWJ cut edge (31.78±0.34mm), with the laser fabricated edges; Figure 6c producing the least dome height (26.20±0.29mm).
a
c
(a)EDM cut edge, (b)AWJ cut edge, (c)Laser cut edge Figure 6. Dome height evolution during HET
The extent of dome height attained is a function of the material flow. Since the stress concentrates around the hole edge during HET, the quality of the edge surface produced plays a major role in the dome height evolution.
3.3 GOM ATOS Metrology analysis
GOM ATOS metrology analysis was also done to evaluate the thinning tendencies of the material after the HET. The finished edge surfaces for laser, EDM and AWJ as well as the unfinished edge surfaces of AJW and EDM were evaluated. In order to quantify the thinning evolution, the dome area of the test samples after HET were studied and statistically quantified using GOM ATOS metrology.
a
b
(a)Unfinished edge surface (b) Finished edge surface Figure 7. GOM ATOS analysis of AWJ cut edge
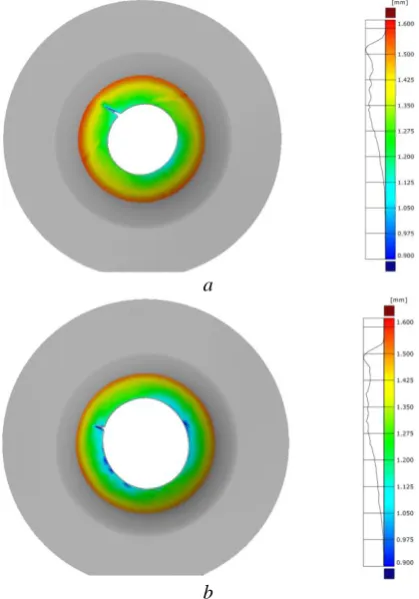
Figure 7 shows the thinning evolution distribution for both unfinished and finished AWJ edge surfaces after HET. The finished edge surface showed higher thinning distribution tendencies with the lowest thickness point of ~1.19mm compared to the unfinished edge surface (~1.23mm).
a
b
(a)Unfinished edge surface, (b) finished edge surface Figure 8. GOM ATOS analysis of EDM cut edges
Figure 8 also shows the thinning evolution for the unfinished and finished EDM edge surfaces after HET. The finished edge surface again showed higher thinning distribution tendencies with the lowest thickness point (~0.95mm) compared to the unfinished edge surface (~1.11mm). The thinning trends are indicative of the edge formability of the material. The higher the thinning tendencies, the higher the material flow around the hole edge and the higher the edge stretchability.
[image:4.595.93.254.69.184.2] [image:4.595.315.525.153.453.2]b
c
[image:5.595.73.293.73.418.2](a)Laser cut edge, (b) AWJ cut edge (c) EDM cut surface
Figure 9. Comparison of thinning tendencies of finished cut edges
Figure 9 shows a comparison of thinning evolution between the finished edge surfaces studied for laser, AWJ and EDM cutting methods. The finished edge surface after EDM showed the highest thinning distribution tendency with the least thinning point ~0.95mm followed by AWJ (~1.19mm) and laser cutting (~1.25mm). These observations are consistent with the HER trends; Figure 5, observed for this material in terms of their implications on edge formability. In general, the material exhibited thinning towards the hole edge along the dome region. This is due to the stresses moving towards and concentrating around the hole area during the deformation process. The response of the sheet edge to thinning therefore provides an important route to characterizing the edge stretchability of the material. HER determination is key to the quantification of the edge formability of materials, but very difficult to characterize. Reliance on visual inspection (operator subjectivity) [13], to determine the onset of cracks can also be difficult since it alters the HER values, leaving large variations between repeated test results. The GOM ARAMIS system provides a better alternative by providing the option of tracking images frame by frame to determine the exact point of crack inception. However, there also exists the risk of data loss as a result of pixel point unavailability at the hole edge and the uphill task of
spotting the inner diameter of the hole edge, where the HER evaluation is optimum. Some works have suggested equations to compensate for the crack width during HER determination [11]. Schneider et al., [12] in their work also proposed various mechanism that can be adopted for crack detection and correction during HET. The GOM ATOS metrology technique however, offers a more consistent and statistically viable alternative to characterizing the edge formability of sheet materials.
3.4 Edge crack analysis
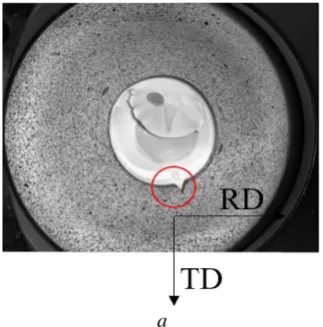
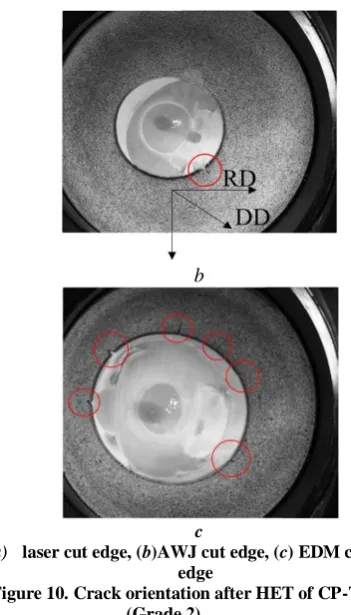
Both macroscopic inspection and fractography analysis was done in order to understand the mechanism of crack evolution during HET. Figure 10 shows the crack orientation on the sample dome after HET. The cracks observed at the hole edge with laser and AWJ cutting were oriented transverse and diagonal with respect to the rolling direction of the sheet. This is probably as a result of the planar anisotropy of the sheet, directing the crack orientation in the material. The material also exhibited numerous crack nucleation sites for the EDM cut edge after HET, Figure 10c. This behavior could be attributed to the plastic deformation during the fabrication process inducing some circumferential strains at the cut edge, resulting in a more random scattering of the edge surface cracks. These strains at the EDM cut edge promotes the production of shallow edge surface cracks which spreads the applied stress thereby restricting the crack growth in the sheet thickness direction. This strain gradient distribution at the EDM cut edge accounts for the high hole edge formability of the EDM cut edge surfaces.
Crack orientation in CP-Ti (Grade 2) after HET however can be attributed to the sheet planar anisotropy and strain gradient distribution by machining induced plastic deformation at the hole edge.
[image:5.595.356.518.554.718.2]b
c
[image:6.595.94.270.69.377.2](a) laser cut edge, (b)AWJ cut edge, (c) EDM cut edge
Figure 10. Crack orientation after HET of CP-Ti (Grade 2)
4.
Conclusions
This work was directed at studying the impact of sheet edge conditions prepared with laser, EDM and AWJ on the edge formability of CP-Ti (Grade 2) at room temperature. The research found that;
1. CP-Ti (Grade 2) prepared with EDM exhibits high edge formability compared to AWJ and laser cutting
2. Edge crack orientation after HET were directed along the sheet orientation for AWJ and Laser cut edges and randomly distributed in EDM test samples. This behaviour could be attributed to the sheet planar anisotropy and strain gradient distribution by machining induced plastic deformation
3. GOM ATOS metrology offers a viable and a statistically accurate alternative for characterizing the edge formability of materials
4. The dome height evolution is a function of the edge surface integrity and an indicator of sheet edge workability
5.
References
[1] R. R. Boyer, An overview on the use of titanium in the aerospace industry, Materials Science and
Engineering: A, Volume 213, Issues 1–2, 1996, pp.103-114
[2] J. Adamus, Characteristic of shaping titanium sheets by cold working methods, International Journal of Applied Mechanics and Engineering, Volume 11, Issue 4, 2006, pp.727-733
[3] F.,-K Chen and K., -H Chiu, Stamping formability of pure titanium sheets, Journal of Materials Processing Technology Volume 170, Issues 1–2, 2005, pp. 181-186
[4] Z. Cui and L. Gao, Studies on hole-flanging process using multistage incremental forming, CIRP Journal of Manufacturing Science and Technology, Volume 2, Issue 2, 2010, pp.124-128
[5] A. Karelova, C.Krempaszky, E. Werner, P. Tsipouridis, T. Hebesberger and A. Pichler, Hole Expansion of Dual-phase and Complex-phase AHS Steels - Effect of Edge Conditions, Materials technology, Volume 80, Issue 1, pp.71-77
[6] K.,-I. Mori, Y.Abe and Y. Suzui, Improvement of stretch flangeability of ultra-high strength steel sheet by smoothing of sheared edge, Journal of Materials Processing Technology, Volume 210, Issue 4, 2010, pp. 653-659
[7] A. Konieczny and T. Henderson, On Formability Limitations in Stamping Involving Sheared Edge Stretching, Warrendale: SAE technical paper series, 2007.
[8] X, Chen, P. McKune and D. Prince, Automotive Applications of Stretch Flange High Strength Steel, Warrendale: SAE Technical Paper, 2003.
[9] M. F. Shi and X. Chen, Prediction of Stretch Flangeability Limits of Advanced High Strength Steels using the Hole Expansion Test, Warrendale: SAE Technical Paper Series, 2007.
[10] M. Bambach, H. Voswinckel and G. Hirt, A new process design for performing hole-flanging operations by incremental sheet forming. Procedia Engineering, Volume 81, 2014, pp. 2305-2310. [11] P. Larour, J. Freudenthaler, A. GrünsteidI and K. Wang, Evaluation of alternative stretch flangeability testing methods to ISO16630 standard, IDDRG 2014 Conference, Paris, France, pp.188-193 [12] M. Schneider, I. Peshekhodov, A. Bouguecha and B.,-A Behrens, A new approach for user-independent determination of formability of a steel sheet sheared edge, Production Engineering, Volume 10, Issue 3, 2016, pp. 241-252