City, University of London Institutional Repository
Citation
:
Mergos, P.E. ORCID: 0000-0003-3817-9520 (2019). Sustainable seismic design
of RC frames with structural optimisation techniques. Paper presented at the ociety for
Earthquake and Civil Engineering Dynamics (SECED) 2019 Conference, 9-10 Sep 2019,
London, UK.
This is the accepted version of the paper.
This version of the publication may differ from the final published
version.
Permanent repository link:
http://openaccess.city.ac.uk/id/eprint/23067/
Link to published version
:
Copyright and reuse:
City Research Online aims to make research
outputs of City, University of London available to a wider audience.
Copyright and Moral Rights remain with the author(s) and/or copyright
holders. URLs from City Research Online may be freely distributed and
linked to.
City Research Online:
http://openaccess.city.ac.uk/
[email protected]
SUSTAINABLE SEISMIC DESIGN OF RC FRAMES WITH
STRUCTURAL OPTIMIZATION TECHNIQUES
Panagiotis MERGOS
1Abstract: In conventional engineering practice, the sustainable seismic design of reinforced concrete (RC) frames is pursued with the aid of the designer’s experience and/or trial and error approaches. Nevertheless, the complexity of this structural design task, as well as the demand for sustainable solutions in limited time, set the use of automated structural optimization methodologies as an attractive alternative approach. In this study, it is shown that the use of structural optimization techniques in seismic design of RC frames can lead to significant reductions not only in economic costs but also in environmental impacts expressed in terms of embodied CO2 emissions. The latter is significant because in many countries around the world,
including most of the top-10 countries in CO2 emissions from cement production, RC structures
are designed to resist earthquake loads. Moreover, the trade-offs between the economic costs of earthquake-resistant RC frames and the embodied CO2 emissions are presented. It is concluded
that, typically, the designs of RC frames for minimum construction cost and embodied CO2
emissions are closely related. Therefore, both objectives can be achieved almost simultaneously in the framework of optimum seismic design of RC frames.
Introduction
Reinforced concrete (RC) structures play a vital role in protecting human societies from earthquake threat. On the other hand, they contribute significantly to greenhouse gas emissions that have been the dominant cause of the observed climate change. This is mainly due to the embodied environmental impact of cement, which is responsible for roughly 8% of global CO2
emissions (Olivier et al. 2002), and reinforcing steel. The previous highlight the need for optimum seismic design of RC structures that minimises their environmental impact as well as vulnerability to earthquakes.
In standard engineering practice, optimum structural design is pursued either with the aid of the designer’s experience or a manual trial-and-error process. However, for complex problems, these approaches are often inadequate and automated structural optimization methodologies are required. Early automated optimization efforts of RC structures focussed on construction cost (e.g. Sarma and Adeli 2008). It was not until rather recently that research studies examined design of RC structures for minimum environmental impact (e.g. Paya et al. 2008, Yeo and Gabbai 2011, Medeiros and Kripka 2014).
The previous optimization efforts do not address seismic design of RC frames. However, in many countries around the globe, including most of the top-10 countries in CO2 emissions from cement
production (e.g. India, Iran, Turkey, Japan) (Olivier et al. 2002), RC structures need to be designed against earthquake hazard. An overview of the existing seismic design optimization frameworks can be found in Fragiadakis and Lagaros (2011). The more recent studies on optimum seismic design of RC structures focus on performance-based design (PBSD) methodologies (e.g. Ganzerli et al 2000, Fragiadakis and Papadrakakis 2008, Gencturk 2013, Mergos 2017). However, all previous research efforts on optimum seismic design of RC structures set construction and/or life-cycle economic costs as design objectives (Fragiadakis and Lagaros 2011).
Indeed, the optimum seismic design of RC structures for minimum environmental impact has very little been explored. The author (Mergos 2018a, 2018b) examined seismic designs of single RC members and frames for minimum embodied CO2 emissions according to Eurocode 8 (CEN
2004) provisions and compared them with designs based on minimum cost. The procedures followed and the main findings of these studies are presented in the following of this paper.
2
Optimum seismic design of RC frames
The standard formulation of a single-objective optimization problem with discrete design variables is the following:
Minimize: Ƒ(𝒙)
Subject to: 𝑔𝑗(𝒙) ≤ 0, 𝑗 = 1 𝑡𝑜 𝑚 (1)
Where: 𝒙 = (𝑥1, 𝑥2, … , 𝑥𝑛)
𝑥𝑖∈ 𝐷𝑖= (𝑑𝑖1, 𝑑𝑖2, … , 𝑑𝑖𝑘𝑖) , 𝑖 = 1 𝑡𝑜 𝑛
In this formulation, Ƒ(𝒙) is the objective function and x is the design solution vector that comprises of n independent design variables xi (i=1 to n). The design variables xi take values from discrete
values sets Di=(di1, di2, …, diki), where dip (p=1 to ki) is the p-th possible discrete value of design
variable xi and ki is the number of possible discrete values of xi. Furthermore, the solution should
be subject to m number of constraints gj(x)≤0 (j=1 to m).
Typically, the objective function in optimum design of RC frames Ƒ(𝒙) is set to be the material cost C(x). Alternatively, as discussed in the introduction section, the environmental impact E(x), expressed herein in terms of embodied CO2 emissions, can be used. In both cases, the
cost/environmental impact is calculated as the sum of the contributions of concrete Ƒ𝑐(𝒙),
formwork Ƒ𝑓(𝒙)and reinforcing steel Ƒ𝑠(𝒙). The latter can be taken as the sum of the contributions
of longitudinal and transversal steel reinforcement.
The previous are summarized in Eq. (2), where Vc (m3) is the concrete volume, ms (kg) the mass
of steel reinforcement and Af (m2) the area of the formwork. Ƒ𝑐𝑜, Ƒ𝑠𝑜 and Ƒ𝑓𝑜 are the unit prices of
concrete, steel and formwork respectively. When the unit economic costs (expressed in Euros per material unit quantities) are set as unit prices, then Eq. (2) determines the economic cost
C(x). Alternatively, if the material unit environmental impacts (expressed in kgCO2 per material
unit quantities) are used, then Eq. (2) calculates embodied CO2 emissions E(x).
[image:3.595.99.497.606.746.2]Ƒ(𝒙) = Ƒ𝑐(𝒙) + Ƒ𝑠(𝒙) + Ƒ𝑓(𝒙) → Ƒ(𝒙) = 𝑉𝑐(𝒙) · Ƒ𝑐𝑜+ 𝑚𝑠(𝒙) · Ƒ𝑠𝑜+ 𝐴𝑓(𝒙) · Ƒ𝑓𝑜 (2)
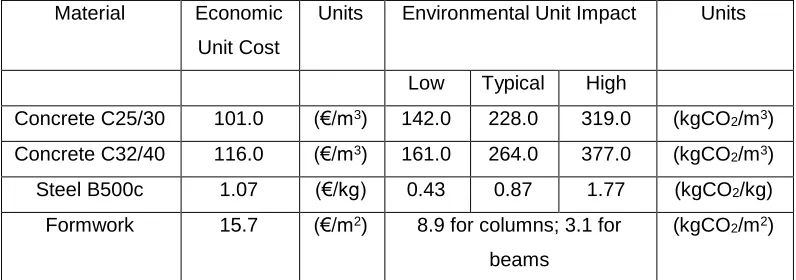
Table 1 presents the unit prices adopted in this study for the economic cost and CO2 emissions.
The economic values are based on the Hellenic Ministry of Public Works (2013). The unit environmental impact values of concrete and steel are taken from Kaethner and Burridge (2012). In this study, cradle to gate embodied CO2 emissions are specified that include the impacts of the
extraction of the raw material and factory production. Therefore, impacts due to delivery to the site, operational and end of life impacts are not taken into consideration. It is found therein that the embodied environmental impact of concrete and reinforcing steel materials present significant variations. In the case of concrete, the variations come from either the specification of the concrete mix or from the different processes used to make Portland cement clinker. The variations of reinforcing steel embodied CO2 values depend primarily on its recycled content. To envelope
all possible scenarios, a range of values (low – typical – high) is provided in Kaethner and Burridge (2012), as shown in Table 1. In addition, the unit environmental impact value of formwork is taken from Paya et al. (2009).
Material Economic
Unit Cost
Units Environmental Unit Impact Units
Low Typical High
Concrete C25/30 101.0 (€/m3) 142.0 228.0 319.0 (kgCO2/m3)
Concrete C32/40 116.0 (€/m3) 161.0 264.0 377.0 (kgCO2/m3)
Steel B500c 1.07 (€/kg) 0.43 0.87 1.77 (kgCO2/kg)
Formwork 15.7 (€/m2) 8.9 for columns; 3.1 for
beams
(kgCO2/m2)
In optimization problems, the input data are divided in design parameters that are assumed fixed and design variables that change values during the solution process. In this study, for the sake of simplicity, geometry (i.e. storey heights and member lengths), material properties and loading of RC frames are treated as design parameters. Therefore, the present study examines solely sizing optimization of RC frames, where only beam and column members cross-sectional dimensions are the design variables and have to be specified.
Design constraints gj(x)≤0 represent herein the design provisions of Eurocode-2 (EC2) (CEN
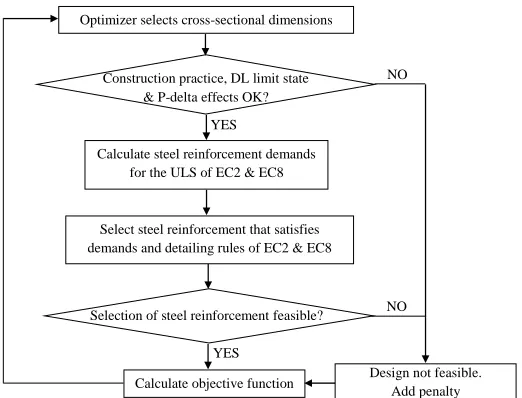
[image:4.595.175.436.336.535.2]2000) and Eurocode-8 (EC8) (CEN 2005). First, design solutions are checked to verify that they comply with construction practice limitations (e.g. the width of beams cannot be greater than the width of adjoining columns) and that they satisfy Damage Limitation (DL) limit state for non-structural components as well as the limitations for P-delta effects. Next, steel reinforcement demands are calculated for the Ultimate Limit State (ULS) according to EC2 and EC8 provisions. Then, using exhaustive search or any other optimization algorithm, steel reinforcement characteristics are selected to satisfy, in the most efficient way, both steel reinforcement demands and the detailing rules of EC2 and EC8 including checks for confinement when necessary. If an appropriate steel reinforcement configuration is found then the design solution is branded feasible and the value of the objective function is returned to the optimizer. Otherwise, the design is not feasible and a penalty term is added to the value of the objective function. The afore-described procedure is illustrated in Fig. 1 below.
Figure 1. Optimum seismic design to EC8 flowchart
Different algorithms can be used to solve the optimization problem of Eq. (1). Metaheuristic optimization algorithms are nature-inspired search procedures that discover optima by randomization and local search. They are well suited to structural engineering problems as they do not require calculation of derivatives. Furthermore, they are almost guaranteed to provide near global optimal solutions even to problems, where classical methods are trapped in local optima. Genetic Algorithms (GAs) are metaheuristic optimization algorithms imitating Darwin’s theory of evolution. GAs gradually modify populations (generations) of candidate solution vectors x
(individuals) until the improvement of next generations is below a pre-specified tolerance. Individuals of next generations (children) are formed from selected individuals of previous generations (parents) based on their objective function values. In this study, the mixed-integer GA as implemented in MATLAB-R2017a (2017) is employed. This algorithm handles both continuous and discrete design variables by using special crossover and mutation functions. In addition, it considers nonlinear constraints by adopting the penalty function approach.
RC frame case study
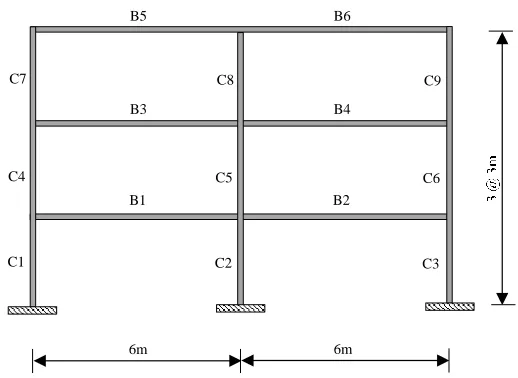
In the following, different optimum seismic design solutions of a three-storey two-bay (Fig. 2) RC frame for minimum embodied CO2 and/or economic cost are developed and compared. The frame
Optimizer selects cross-sectional dimensions
Calculate steel reinforcement demands for the ULS of EC2 & EC8
Select steel reinforcement that satisfies demands and detailing rules of EC2 & EC8
Construction practice, DL limit state & P-delta effects OK?
Selection of steel reinforcement feasible?
Calculate objective function Design not feasible. Add penalty NO
NO YES
4
is part of a building of ordinary importance that rests on soil class B following the classification of EC8. Concrete cover is assumed to be 30mm. Uniform distributed loads of 22.5kN/m act along beam members of all storeys for the quasi-permanent load combination of EC8. Furthermore, point loads of 67.5kN and 135kN are applied at the exterior and interior joints respectively for the same load combination. The quasi-permanent weight of all storeys is equal to 540kN.
Due to symmetry and for the sake of simplicity, one square cross-section is assumed for both exterior columns and one square cross-section for the interior column. Furthermore, the same rectangular cross-section is assumed for both beams of each storey. A different beam section is used, however, for each of the frame storeys. For simplicity, it is assumed that steel reinforcement does not vary along member lengths. In total, 8 independent design variables are employed in this case study representing the afore-mentioned cross-sectional dimensions of the RC frame.
For the optimum designs, it is assumed that cross-sectional dimensions take values starting from 300mm and increasing by 50mm. Transverse reinforcement spacing of beam and columns takes values between 75mm and 300mm with a step of 25mm. Numbers of main bars and legs of shear reinforcement may take any integer value greater than one. Furthermore, the diameters of the longitudinal bars are assumed to take values from the following discrete set (14mm, 16mm, 18mm, 20mm and 25mm) whereas diameters of transverse reinforcement take values from (8mm, 10mm, 12mm) in accordance with standard construction practice.
In the following, the RC frame is optimally designed according to all ductility classes of EC8 for various design Peak Ground Acceleration (PGA) values, concrete classes, material CO2 footprint
[image:5.595.176.435.456.645.2]scenarios and design objectives. Due to the regularity of the low-rise frame under investigation, the lateral force method of analysis is used to calculate seismic responses. In all cases, the optimization results reported herein were obtained by using the GA algorithm in MATLAB with 50 individuals per generation. Iterations were terminated when the mean relative variation of the best fitness value was negligible for more than 50 generations. MATLAB-R2017a default options were used for GA operations. Ten independent GA runs for each design problem were conducted and the minimum objective function solutions are provided herein. It is worth noting that in all cases the GA runs for the same design problem returned objective function solutions that didn’t vary more than 1%. This shows the level of accuracy of the obtained optimum solutions.
Figure 2. RC frame case study
Effect of ductility class
In this section, the RC frame of Fig. 2 is optimally designed according to EC8 for ductility class high (DCH), medium (DCM) and low (DCL). All designs are performed for 0.40g design PGA value. Concrete C25/30 and reinforcing steel B500C in accordance with EC2 specifications are used. Concrete and reinforcing steel costs and CO2 emissions are taken from Table 1 following
the typical environmental impact scenarios. Designs for both minimum cost and CO2 footprint
are examined.
6m 6m
B1 B2
B3 B4
B5 B6
C1 C2 C3
C4 C5 C6
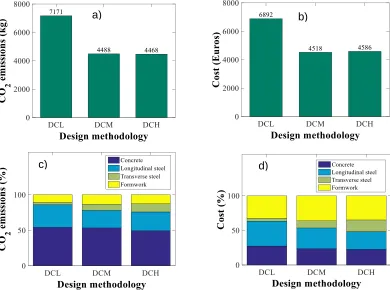
Fig. 3a shows the minimum CO2 impacts derived by following the different design approaches. It
is shown that DCL produces the highest and DCH the lowest emissions. DCM solution generates CO2 emissions very similar to DCH. It is interesting to note that DCL produces 60% more CO2
emissions than DCH. This is explained by the fact that seismic forces for DCH and DCM are significantly reduced with respect to DCL by the application of the behavior factor q that accounts for ductility capacity of structures. As shown in Mergos (2018a), CO2 emissions of RC members
are drastically reduced as design seismic forces decrease. On the other hand, the use of additional transverse reinforcement, to achieve higher ductility capacity for DCM and DCH, does not increase significantly CO2 footprint due to the small contribution of transverse reinforcement
to the total CO2 emissions. As a result, embodied CO2 can be significantly lesser for higher
[image:6.595.95.485.415.705.2]ductility classes. Similar conclusions can be drawn in the case of minimum material costs as shown in Fig. 3b.
Fig. 3c presents the contributions of the different materials of the RC frame to the minimum CO2
emissions. Concrete contributes the highest part with around 50% contribution in all designs. Next comes the longitudinal reinforcement and then the formwork. As described in the previous paragraph, the contribution of transverse reinforcement, despite increasing with the level of ductility class, is always minor. The contribution of steel reinforcement is the highest in the case of DCL.
Furthermore, Fig. 3d presents the materials cost contributions of the minimum cost designs. It is shown that the concrete cost percentile contributions are significantly smaller than the respective CO2 contributions and the opposite is the case for the formwork contributions. This is justified by
the unit prices of the economic cost and environmental impact of the concrete and formwork shown in Table 1. Interestingly, however, the sum of the contributions of concrete and formwork, which both depend solely on the cross-sectional dimensions, is similar in minimum CO2 and cost
designs. As a result, the contribution of steel reinforcement (both longitudinal and transverse) is also equivalent in the two optimum designs.
Figure 3. Optimum designs according to different seismic design methodologies: a) minimum CO2 emissions; b) minimum costs; c) contributions to minimum CO2 emissions; d) contributions
to minimum costs
b)
a)
6
Effect of design PGA
Herein, the RC frame of the previous section is optimally designed to all ductility classes of EC8 and for three different values of the design PGA: 0.20g, 0.30g and 0.40g representing different seismicity levels. The same material properties, costs and environmental impacts as in previous section are used.
Fig. 4a presents the variations of the minimum CO2 emissions as a function of the design PGA.
It can be seen that the emissions increase with the design PGA for all design methodologies. However, the rate of increase is not the same for all design approaches. More particularly, DCM and DCH emissions increase at a much smoother rate than DCL with PGA. Consequently, despite the fact that all ductility classes generate similar emissions for the low PGA value as they are governed by minimum detailing requirements, DCM and DCH produce significantly less emissions for higher PGA values. Therefore, it can be concluded that design for high ductility classes is more beneficial in regions of high seismicity than in regions of low seismicity. Fig. 4b shows the costs of the optimum cost solutions. It is evident that they display very similar trends to the optimum CO2 values.
Figs. 4c and 4d present the contributions of concrete to the total CO2 emissions and cost
respectively for the different design PGA values. It is interesting to observe that these ratios do not vary considerably with the design PGA for all seismic design methodologies. However, they are significantly different for the two design objectives (CO2 and cost) as discussed in the previous
section.
Figure 4. Optimum designs for different design PGAs a) minimum CO2 emissions; b) minimum
costs; c) contribution of concrete to minimum CO2 emissions; d) contribution of concrete to
minimum costs.
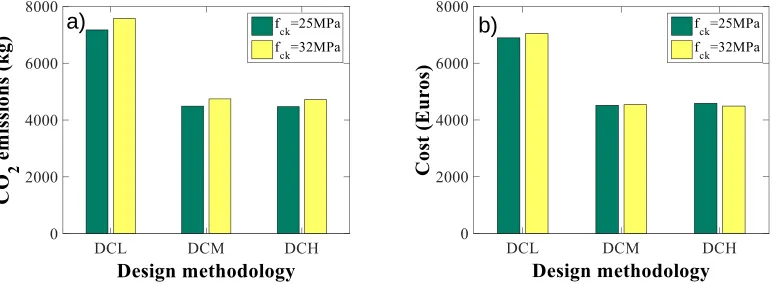
Effect of concrete class
Herein, the RC frame is optimally designed to all ductility classes of EC8 for 0.40g design PGA and assuming two different concrete classes: C25/30 and C32/40. In both cases, B500c reinforcing steel is used. Materials costs and CO2 emissions are taken from Table 1 for the typical
environmental impact scenarios.
b)
a)
Fig. 5a presents the minimum CO2 emissions produced by all design methodologies using both
concrete classes. It is evident that, in all cases, the designs with the lower concrete class (C25/30) generate less CO2 emissions. This can be explained by the fact that the higher concrete class
(C32/40) generates 16% more CO2 emissions per m3 than the lower one (C25/30) based on the
values presented in Table 1.
Fig. 5b shows the costs of the optimum cost solutions for all design methodologies and both concrete classes. It can be seen that now the C32/40 designs require either lower or higher costs depending on the design methodology. Even in the cases of higher C32/40 costs (DCL) the differences are considerably smaller than the CO2 emissions. At first sight, this observation seems
unexpected because the cost of C32/40 is also approximately 15% higher than C25/30. However, the explanation can be given by the contributions of the different materials to CO2 emissions and
costs. As shown in Fig. 3, concrete contributes far more to total CO2 emissions than total costs.
Therefore, the increase of the unit prices of concrete has higher impact on the embodied emissions than economic cost. This impact cannot be counteracted by the reduction of steel demands due to the better mechanical properties of C32/40.
Figure 5. Optimum designs for different concrete classes a) minimum CO2 emissions; b)
minimum costs
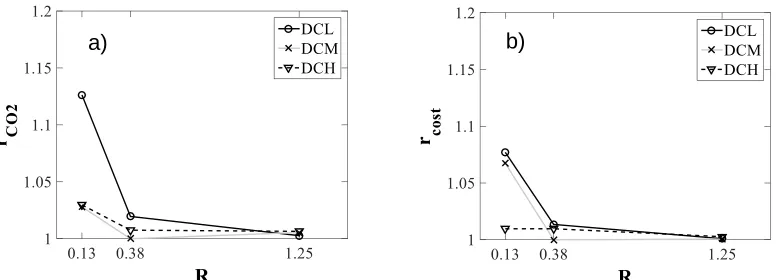
Effect of materials embodied emissions
In this section, the influence of unit environmental impacts of concrete and reinforcing steel on the properties of the optimum design solutions is examined. To serve this goal, the ratio R is used herein. R is defined as the ratio of CO2 footprint of 100kg of reinforcing steel to the CO2 footprint
of 1m3 of concrete. Furthermore, three different scenarios are considered regarding the combinations of environmental impacts of C25/30 concrete and B500c reinforcing steel using the values presented in Table 1: Typical concrete – typical steel impact (R=0.38); high concrete – low steel impact (R=0.13) and low concrete - high steel impact (R=1.25). These scenarios envelope all possible combinations of concrete and steel environmental impacts.
Fig. 6a presents the ratio of CO2 footprint of the minimum cost solutions over the CO2 footprint of
the respective minimum CO2 solutions, namely rCO2, for the three different environmental impact
scenarios. It can be seen that this ratio ranges between 1.0 and 1.13. This effectively means that the minimum cost designs produce up to 13% more emissions than the minimum CO2 solutions.
It is also evident that rCO2 is rather sensitive to R. It obtains maximum values at R=0.13 and
decreases considerably up to R=0.38. After this R value, rCO2 remains practically constant and
almost equal to 1. The latter means that the minimum CO2 and minimum cost designs produce
almost the same CO2 emissions. It is also interesting to note that the higher rCO2 values are
reported for DCL. This is explained by the fact that greater cross-sections are used for this ductility class due to the higher seismic design forces and because less strict detailing rules are required for this ductility class. These facts give more flexibility to the optimizer to select alternative cross-sectional solutions.
Furthermore, Fig. 6b shows the variation of the ratio rcost with R. rcost is the ratio of cost of the
minimum CO2 solutions over the cost of the minimum cost designs. It is seen that rcost varies
between 1.0 and 1.078. Therefore, the minimum CO2 designs cost up to 8% more than the
minimum cost designs. In general, similar conclusions for rcost to rCO2 can be drawn.
[image:8.595.96.483.283.425.2]8
Figure 6. Optimum CO2-based designs for different R values a) rCO2; b) rcost
Conclusions
The adopted seismic design approach affects importantly the minimum feasible CO2 emissions
of RC frames. More particularly, in regions of high seismicity, DCM and DCH designs produce up to 60% lesser CO2 emissions than DCL. This is due to the reduction of seismic forces via the use
of the behaviour factor and the fact that the additional transverse reinforcement required does not increase significantly the embodied CO2. As the level of seismicity decreases, however, the
differences in CO2 emissions between the optimum designs of different ductility classes tend to
reduce.
The level of CO2 emissions increases significantly with the design PGA value. However, the rate of increase is not the same for all ductility classes. More particularly, DCM and DCH emissions increase at a much smoother rate than DCL with PGA.
The concrete class also affects minimum CO2 emissions in seismic design of RC frames. It is
found that higher concrete classes, despite their better mechanical properties, lead to higher CO2
emissions due to their higher unit embodied impact. However, the differences in CO2 emissions
between the optimum designs with different concrete classes are rather small.
Furthermore, it is observed that the differences between the optimum design solutions depend considerably on the ratio R of the unit environmental footprint of reinforcing steel to the respective footprint of concrete. More specifically, for medium to high values of R (R=0.38-1.25), it is found that the minimum CO2 designs are very closely related to the minimum cost design solutions. This
is a positive conclusion because both objectives should be considered in the design procedure. However, for low R values (R=0.13), it is observed that the minimum cost solutions generate up to 13% more emissions than the CO2-based designs. The latter can be up to 8% more expensive
than the minimum cost design solutions.
It is important to clarify at this point that only cradle to gate embodied CO2 emissions are examined
in this study. A holistic, cradle to grave, approach that considers also operational and end of life environmental impacts is necessary to get the full picture of life-cycle CO2 emissions of RC
buildings.
References
CEN (2000), Eurocode 2: Design of concrete structures. Part 1-1: General rules and rules for buildings, Brussels: European Standard EN 1992-1-1
CEN (2004), Eurocode 8: Design of structures for earthquake resistance. Part 1: General rules, seismic actions and rules for buildings, Brussels: European Standard EN 1998-1
Fragiadakis M and Papadrakakis M (2008), Performance-based optimum seismic design of reinforced concrete structures, Earthquake Engineering and Structural Dynamics 37: 825-844
Fragiadakis M and Lagaros ND (2011), An overview to structural seismic design optimization frameworks, Computers and Structures 89: 1155-1165
Ganzerli S, Pantelides CP and Reaveley LD (2000), Performance-based design using structural optimization, Earthquake Engineering and Structural Dynamics 29: 1677-1690
Gencturk B (2013), Life-cycle cost assessment of RC and ECC frames using structural optimization, Earthquake Engineering and Structural Dynamics 42: 61-79
HMPW (2013), Readjustment and completion of invoices of public works, Athens: Hellenic Ministry of Public Works
Kaethner SC and Burridge JA (2012), Embodied CO2 of structural frames, Structural Engineer
90: 33-40
MathWorks (2017), MATLAB R2017a – Global Optimization Toolbox, Natick, MA, USA: The MathWorks Inc, 2000
Medeiros G and Kripka M (2014), Optimization of reinforced concrete columns according to different environmental impact assessment parameters, Engineering Structures 59: 185-194 Mergos PE (2017), Optimum seismic design of reinforced concrete frames according to Eurocode 8 and fib Model Code 2010, Earthquake Engineering and Structural Dynamics 46: 1181-1201 Mergos PE (2018a), Contribution to sustainable seismic design of reinforced concrete members
through embodied CO2 emissions optimization, Structural Concrete 19(2): 454-462
Mergos PE (2018b), Contribution to sustainable seismic design of reinforced concrete members through embodied CO2 emissions optimization, Structural Concrete 19(2): 454-462
Olivier JGJ, et al (2015), Trends in global CO2 emissions: 2015 Report, Hague: European
Commission, Joint Research Centre
Paya-Zaforteza I, Yepes V, Gonzalez-Vidosa F and Hospitaler A (2008), Multiobjective optimization of concrete frames by simulated annealing, Computer Aided Civil and Infrastructure Engineering 23: 596-610