Rochester Institute of Technology
RIT Scholar Works
Theses Thesis/Dissertation Collections
2-7-2014
Pumping Potential of a Two-Layer
Left-Ventricle-Like Flexible Matrix Composite (FMC) structure
Arnab ChandaFollow this and additional works at:http://scholarworks.rit.edu/theses
This Thesis is brought to you for free and open access by the Thesis/Dissertation Collections at RIT Scholar Works. It has been accepted for inclusion in Theses by an authorized administrator of RIT Scholar Works. For more information, please [email protected].
Recommended Citation
i
Pumping Potential of a Two-Layer
Left-Ventricle-Like Flexible Matrix Composite (FMC) structure
Submitted by,
Arnab Chanda
A Thesis/Dissertation Submitted in Partial Fulfillment of the Requirements for Master of Science in Mechanical Engineering
Department of Mechanical Engineering
Kate Gleason College of Engineering
Approved by:
Dr. Hany Ghoneim --- Department of Mechanical Engineering (Advisor)
Dr. Steven Day ---Department of Mechanical Engineering (Committee Member)
Dr. Alexander Liberson --- Department of Mechanical Engineering (Committee Member)
Dr. Agamemnon Crassidis ---
Department of Mechanical Engineering (Department Representative)
Rochester Institute of Technology
Rochester, New York
ii
Abstract
iii
Acknowledgement
I would like to take this opportunity to thank everyone directly and indirectly involved with my research work, for their valuable help and support. I am extremely grateful to my advisor Dr. Ghoneim for giving me the opportunity to work under his guidance. In these two years, I have seen a lot of ups and downs, and there had been days when I felt as if I reached a complete deadlock. I greatly appreciate Dr. Ghoneim for being an endless source of encouragement and motivation through all my good and tough times. The confidence he has shown in my work inspires me to always deliver the best performance.
I would like to thank my thesis committee members Dr. Day, Dr. Liberson and Dr. Crassidis for taking the time to review and evaluate my thesis work. I am also grateful to Mr. Robert Kraynik in the Mechanical Engineering Department’s machine shop, for his help with the fabrication of my experimental setup. I am also thankful to Dr. Hensel and all the staff of the mechanical engineering department for their valuable advising during the course of my graduate studies at RIT.
I would like to thank my parents and sister for their support and belief on me throughout my journey in graduate school at RIT. My special thanks to Zhen Yin and all my friends who have always been there for me. I hope my accomplishment today gives all of you a reason to be proud of me.
iv
Table of Contents
List of Figures ... vi
List of Tables ... x
Nomenclature ... xi
Abbreviations ... xii
1. Introduction ... 1
1.1 The Heart ... 2
1.2 Composite Materials ... 3
2. Literature Review ... 6
2.1 Left Ventricle (LV) Structure ... 8
2.2 Helical Ventricular Myocardial Band (HVMB) ... 11
2.3 High Pumping Potential Structures ... 16
2.4 Single-Layer-Left-Ventricle-Like FMC Structure ... 19
2.5 Cardiac Modeling ... 24
2.6 Summary ... 29
3. Objectives ... 30
4. Preliminary Work ... 30
4.1 Idealizing of Band Trace ... 31
4.2 The Two-Layer Fiber Orientation ... 34
4.3 Construction of Two-layer Near-Conical LV-Like FMC Structure... 39
4.3.1 Experimental Construction ... 39
4.3.2 Analytical Construction ... 41
5. Experimental and Analytical Work ... 45
5.1 Experimental Work ... 45
5.2 Analytical Work in ANSYS ... 46
6. Results and Discussions ... 55
6.1 Experimental Results ... 56
6.2 Analytical Results ... 57
7. Conclusions ... 59
8. References ... 61
9. Appendices ... 66
v
Appendix B: Rolling a plane surface into a conical surface ... 67
Appendix C: Matlab codes for LV band, fibers and LV-like model generation ... 69
Appendix D: Inner volume key-point plotting in Matlab ... 76
Appendix E: ANSYS GUI commands ... 78
Appendix F: ANSYS modeling issues ... 81
Appendix G: LV wall thickening Effect ... 86
vi
List of Figures
Figure 1: Various components of human heart………..3
Figure 2: Fiber classification ………...4
Figure 3: Typical laminate structure……….………….………....5
Figure 4: Symmetric angle-ply laminate...6
Figure 5: Asymmetric angle-ply laminate ………...6
Figure 6: A dog’s LV wall myocardium……….…...9
Figure 7: LV wall thickness versus fiber angle………...9
Figure 8: LV study using histology………...9
Figure 9: LV fiber orientation………...9
Figure 10: Auckland laminar sheet model………...11
Figure 11: Dissected heart: HVMB of Torrent Guasp……….12
Figure 12: Detailed HVMB dissection steps………12
Figure 13 A: Anterior interventricular sulcus………...14
Figure 13 B: Interventricular septum………...14
Figure 14: Microscopic view of top of septum………14
Figure 15: Different sections of the flat HVMB band……….15
Figure 16 A: Various fiber groups forming heart structure………..………...16
Figure 16 B: Three main fiber layers forming interventricular septum………...16
Figure 17 A: Schematic of barrel shaped angle-ply FMC structure………17
Figure 17 B: Schematic of hyperbolic angle-ply FMC structure……….17
Figure 18 A: Snapshot of barrel shaped angle-ply FMC structure………..17
Figure 18 B: Snapshot of hyperbolic angle-ply FMC structure………...17
vii
Figure 20 A: Part of the HVMB band constituting the LV structure………...19
Figure 20 B: The LV band and crude-single-layer fiber orientation plotted in Matlab………...19
Figure 20 C: Rolled near-conical LV-like structure with rolled fibers, plotted in Matlab………..19
Figure 21: A closer look into the near-conical LV-like structure………20
Figure 22: Laminar structure of the heart………20
Figure 23 A: The idealized PU/SMA flexible-matrix composite band………...21
Figure 23 B: The final conical LV-like structure……….21
Figure 24 A: PU/SMA band in a teflon mold cut in shape of LV band………...22
Figure 24 B: Rolled PU/SMA band……….22
Figure 24 C: Experimental setup schematic………22
Figure 25: The experimental setup………...23
Figure 26: The finite element mesh of the PU matrix and SMA fibers………...24
Figure 27: Auckland heart model Geometry………....25
Figure 28 A: Auckland heart model fiber orientation in epicardium………...25
Figure 28 B: Auckland heart model fiber orientation in endocardium………....25
Figure 29 A-D: Dorri et al heart modeling………..26
Figure 30 A, B: Sermesant et al heart modeling: Fiber orientation………27
Figure 31: DT-MRI images of a rat’s heart and the three main fiber orientations………..27
Figure 32: FE biventricular heart model by Goktepe et al………...28
Figure 33 A, B: John Hopkins university canine FE model………....28
Figure 34: One sample of goat heart HVMB endocardium……….31
Figure 35: Schematic of sheet to cone formation………32
Figure 36: Crude LV band trace………..32
Figure 37: Idealized LV band trace………..33
Figure 38: Parameters of the conical surface………...34
viii
Figure 40 A: Goat heart HVMB band endocardium………37
Figure 40 B: Goat heart HVMB band epicardium………...37
Figure 41: Idealized LV band trace with epicardial and endocardial fiber lines……….38
Figure 42: SMA wires placed in teflon mold………...40
Figure 43: PU-SMA band in the mold……….40
Figure 44: PU-SMA LV band………..40
Figure 45: Near-conical LV like FMC model………..40
Figure 46: Idealized LV band trace plotted in Matlab……….41
Figure 47: LV band rolled in Matlab………...41
Figure 48: Idealized LV band with epicardial and endocardial fibers plotted in Matlab………....42
Figure 49: Near-conical LV-like structure with epicardial and endocardial fibers plotted in Matlab…….43
Figure 50: A closer look into the two-layer near-conical LV like structure in Matlab………44
Figure 51: Experimental set-up………46
Figure 52: Rolled LV band key points plotted in ANSYS………..47
Figure 53: Rolled LV band lines plotted in ANSYS………...47
Figure 54: Two views of the rolled LV band areas plotted in ANSYS………...48
Figure 55: LV main volume……….49
Figure 56: Subdivided LV Main volume……….49
Figure 57: Single fiber spline plot………49
Figure 58: Area created normal to a fiber line ………49
Figure 59: Comparison of the number of elements generated using mapped meshing in case of a volume with square cross-section and with circular cross-section………...50
Figure 60: Fibers in a main sub volume………...50
Figure 61: A main sub volume with embedded fibers……….50
Figure 62: Volumes sharing common surface in LV main volume……….51
ix
Figure 64 A, B: Various parts of inner volume enclosed within the main volume……….52
Figure 65 A: Epicardial and endocardial fiber mesh………...53
Figure 65 B: LV main volume mesh………53
Figure 65 C, D: Inner volume mesh……….54
Figure 66: Contact-pairs involved in bonding of the inner volume parts with the main volume…………55
Figure 67: Main volume and inner volume mesh before and after deformation……….58
Figure 68: Fiber mesh deformed shape and un-deformed edges……….58
Figure 69: Inner volume mesh before and after deformation………..59
Figure 70: LV paper band trace………...66
Figure 71: Schematic illustration of the rolling process of a flat plane into a conical surface………68
Figure 72: LV volume with inner sub-volumes………...77
Figure 73: LV near-conical structure revisited………77
Figure 74: Flat base of near-conical LV-like model………78
Figure 75: Flat apex of near-conical LV-like model………78
Figure 76: Contact wizard steps for generating contact pairs………..80
Figure 77: Contact wizard important optional settings………81
Figure 78 A, B: Errors due to difficulty in meshing of LV main volume………...82
Figure 79 A: Main volume subdivided into four volumes with some fibers coming out………83
Figure 79 B: Fibers coming out of a main volume sub-volume………..83
Figure 80: Mesh difficulty in a fiber due to volume twisting………..84
Figure 81: A fiber volume divided into 3 sub-volumes to avoid volume twisting………..84
Figure 82: Large number of elements generated due to regular tet-free meshing of a fiber………85
Figure 83: Small number of elements generated due to hex-mapped meshing………...85
Figure 84: Fiber gap between top/bottom surface and the LV main volume top/bottom surfaces………..86
Figure 85: Changes in a dog’s LV dimensions, observed during systole and diastole phase………..87
x
List of Tables
Table 1: Pumping potential of FMC structures………..19
Table 2: Pumping potential of single-layer LV-like FMC structure………..23
Table 3: Material properties of SMA, PU and core material……….24
Table 4: Material properties for ANSYS………...52
Table 5: Experimental pumping potential (PP) results………..57
xi
Nomenclature
Lo Initial length
∆L Change in length Do Initial diameter
∆D Change in diameter Vo Initial volume
∆V Change in volume
xii
Abbreviations
LV Left Ventricle
FMC Flexible Matrix Composite PP Pumping Potential
HVMB Helical Ventricular Myocardial Band MRI Magnetic Resonance Imaging LS Left Section
RS Right Section DS Descending Section AS Ascending Section IS Intraventricular Septum SMA Shape Memory Alloy PU Polyurethane
1
1. Introduction
The Left Ventricle (LV) is the most essential pumping member of the heart. The LV can be considered to be a near-conical fibrous flexible matrix composite (FMC) structure [8]. An FMC comprises of fibers and a flexible matrix. Moreover, a single layer in a FMC is called a ‘lamina’ and a stack of laminas is called a ‘laminate.’ The LV may be assumed to be a multi-layer laminate structure and fall in a special category of ‘angle-ply’ laminate [10, 11, 12] which shows interesting properties of high Poisson’s ratio etc. In order to better understand the LV structure, a basic understanding of the composite materials is important.
In the near-conical LV structure, the myocardial fibers contract by a maximum of 15% to engender an approximate overall 50% volume contraction [1, 2]. The Pumping Potential (PP), defined as “the relative volume reduction due to an input stroke” [11, 12], of a simple conical structure was estimated numerically to be approximately 1-2. However, the actual PP of the LV is in the range of 3.3-4. And the question crops up: what is the cause of such a high PP of the LV? Our current research attempts to investigate the same using crude experimental and analytical modeling of the LV.
2
two-layer left-ventricle-like FMC structure is modeled and its PP is investigated experimentally and analytically.
A brief overview of the heart and composite materials is presented in Chapter 1. A comprehensive literature review of the LV structure, the HVMB, our previous work on single-layer FMC LV-like structure, some high PP structures and cardiac modeling techniques are presented in Chapter 2. The key objectives of our research and our preliminary work are discussed in Chapters 3 and 4 respectively. Chapter 5 discusses the experimental and analytical work, followed by the results of the PP of the two-layer LV-like FMC structure in Chapter 6. Chapter 7 presents the conclusions.
1.1 The Heart
The heart pumps out approximately 4.7-5.7 liters of blood in every beat/cycle [3]. The heart is confined in a pericardial sac [3] and is made of three main layers of fibers. The outer most fiber layer is called the ‘Epicardium,’ the middle (actuating) layer the ‘Myocardium’ and the inner most layer the ‘Endocardium.’
3
Figure 1: Various components of the human heart [4]
1.2 Composite Materials
A composite material is made by combining two or more materials with distinct physical or chemical properties. Its characteristics are completely different from the individual materials which are combined to make it. In a composite, the individual materials retain their characteristic physical, chemical and mechanical properties. The two constituents of a composite material are ‘fibers’ and the ‘matrix.’ Moreover a single layer in a composite is called a ‘lamina,’ and a stack of laminas is called a ‘laminate’.
4
(a) (b)
Figure 2: Fiber classification: (a) Continuous fibers and (b) Discontinuous fibers. Reproduced
from [5]
The matrix material in a composite holds the fibers in place and gives a shape to the composite. In a composite under loading, the matrix shares and also transfers the load to the fibers. The matrix can be either a polymer, metal, or ceramic. A polymer has a low strength and stiffness. An ‘elastomer/rubber’ is a type of polymer with high elasticity, which may stretch more than twice its original length. A common example of elastomer is ‘polyurethane (PU).’ It has a good tear strength, low water absorption and high biocompatibility [6]. For our current research work, PU has been used as the matrix material for construction of the LV-like Flexible Matrix Composite (FMC) structure.
5
‘laminate.’ Figure 3 shows a couple of composite laminas with different fiber orientations stacked together to form a composite laminate structure.
Figure 3: Typical laminate structure: A stack of laminas. Reproduced from [7]
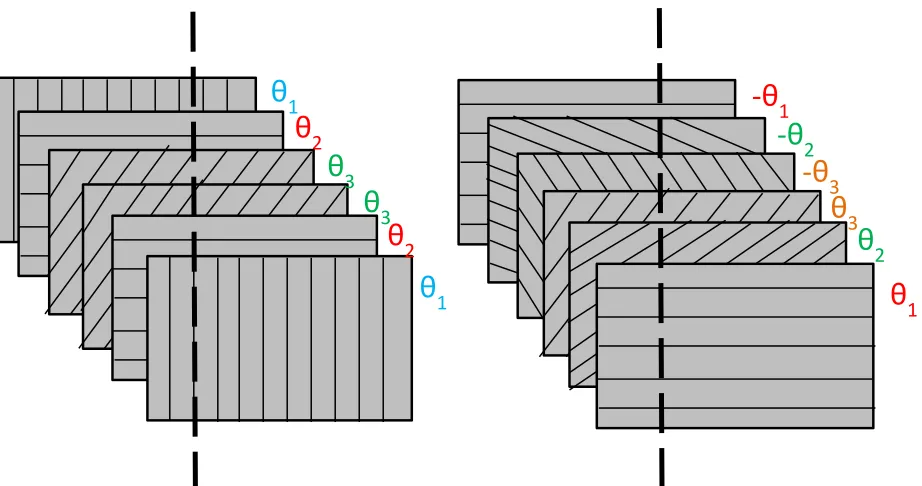
Angle-ply is a special case of laminate in which for every ϴ-ply, there is a negative ϴ-ply. An example is [ϴ1, ϴ2, -ϴ2, ϴ3, -ϴ3, -ϴ1]. Furthermore angle-ply laminates can be of two types
namely ‘symmetric angle-ply’ and ‘asymmetric angle-ply.’ In a symmetric angle-ply laminate, the laminas are arranged as mirror image from middle surface. An example is: [ϴ1, ϴ2, ϴ3, ϴ3,
ϴ2, ϴ1] as shown in Figure 4. In an asymmetric angle-ply laminate, the laminas are arranged as
negative mirror image from the middle surface. An example is: [ϴ1, ϴ2, ϴ3, -ϴ3, -ϴ2, -ϴ1] as
shown in Figure 5.
In our current research, the LV structure has been assumed to be an asymmetric angle-ply laminate with two or three fiber layers everywhere. These fiber layers will be revisited later in the upcoming sections.
6
Figure 4: Symmetric Angle-Ply Laminate. Figure 5: Asymmetric Angle-Ply Laminate.
2. Literature Review
The Left Ventricle (LV) is the most essential part of the heart. The LV structure can be considered to be a Flexible Matrix Composite (FMC) structure [8] with embedded myocardial fibers, arranged in an overlapping helical fashion. Numerous dissection and histological techniques have been employed in the past to explain the LV anatomy. One of the most successful attempts of unraveling the LV anatomy was by Torrent Guasp, a Spanish scientist who spent almost his entire life in this painstaking research on dissecting the heart. He proposed that the heart is made of a single band known as the Helical Ventricular Myocardial Band (HVMB), which twists and loops to form the heart.
Recent advancement in imaging techniques has enabled researchers to study the heart in detail, and also model it. Cardiac modeling has been used so far mainly to study heart anatomy,
θ
2θ
1θ
2θ
3θ
3θ
1θ
1θ
2-θ
2-θ
3θ
3 [image:19.612.76.537.73.316.2]7
pumping mechanisms, and also to model diseased hearts. However, minimal effort has gone into the study of the effect of fiber orientation of the heart on its pumping action. Recently, the fiber orientation of the HVMB was studied by Ghoneim and Arnab [9], and a LV-like FMC structure was modeled using the simplest crude fiber orientation observed in the HVMB endocardium. The Pumping Potential (PP) of the simple single-layer-LV-like FMC structure was investigated both experimentally and analytically. The experimental and analytical PP observed were 1.67 and 1.9 respectively. Though a reasonably high number, the resulting PP is much lower than that of the human heart, which is approximately 3.3-4 [1, 2]. Previously, Ghoneim, based on an idea proposed by Lawrie [10], that an asymmetric angle-ply FMC structure can produce pumping with a very high PP, investigated two asymmetric angle-ply FMC structures [11, 12], which yielded high PP values. The LV structure can be assumed to be an asymmetric angle-ply FMC structure. In our current research, the effect of the simplest, practical and most accurate fiber orientation in the two predominant layers, namely the epicardium (topmost) and the endocardium (bottommost) of the LV, on its PP is investigated both experimentally and analytically.
8
2.1 Left Ventricle (LV) Structure
The LV structure was a mystery for a long time. In 1628, Harvey for the first time pointed out to the possible functional significance of the myocardial (actuating muscular layer which causes pumping action in heart) fiber orientation in the LV [13]. Stensen, 1664 [15], Lower, 1669 [16], Senec, 1749 [17], MacCallumetal [19] and Mall, 1911 [20] found that the LV structure can be considered to be made of three main fiber layers, in which the inner and outer fibers are helical and the middle layer is mainly circumferential. Ludwig [18], later in the nineteenth century, observed the LV can be considered to be an approximate asymmetric angle-ply structure, with the epicardial (outermost layer) fibers crossing the endocardial (innermost layer) fibers at approximately right angles.
9
(maximum wall thickness), during systole and diastole respectively. The fiber angle distributions, as can be observed in Figure 7, change minimally from systole to diastole.
Figure 6: 3-Dimensional section of dog’s LV wall Figure 7: LV wall thickness versus
myocardiumshowing the 10 layer fiber arrangement [21] fiber angle distribution [21]
Figure 8: Orientation employed for block Figure 9: Fiber orientation at the crux and apex
removed from serial section, in Histology [22] of a left ventricle wall [22]
Circumferential plane
Apex
Base
Endocardium
10
In 1981, Greenbaum et al. [22] studied the fiber orientation in the LV of the human heart, via dissection and histology (Study of cells and tissue structures at a microscopic level). He observed that the LV structure is an approximate asymmetric angle-ply structure (Figure 8). He also pointed out the approximate fiber orientations near the base, apex and in the middle, on the septal side of the LV (Figure 9).
Until the late 1980’s, the LV was considered to be made of a homogeneous material, and all the myocardial fibers were assumed to contract together simultaneously, while the heart (or the LV) pumps. These facts were used in modeling of the LV, and were supported by various two-dimensional imaging techniques, such as echocardiography and angiography. However recently, Diffusion Tensor Magnetic Resonance Imaging (DT-MRI) [24] and Echocardiography have enabled researchers to understand the highly anisotropic structure of the LV, the multi-step myocardial contraction/activation schemes, ventricular twisting [23], and many other important phenomena in the heart. These findings have significantly helped to improve the cardiac modeling techniques.
11
The University of Auckland group [8] studied the LV at the microscopic level and proposed that the LV structure can be considered to be made of a fibrous Flexible Matrix Composite (FMC) material, with myocardial fibers arranged in different laminas/sheets, separated by a collagen matrix material (Figure 10).
Figure 10: University of Auckland ‘laminar sheet’ model [8]
2.2 Helical Ventricular Myocardial Band (HVMB)
12
Figure 11: Major dissection steps: The Helical Ventricular Myocardial Band (HVMB) [14]
Figure 12:Detailed HVMB dissection steps [14]
[image:25.612.83.528.356.656.2]13
The first step before dissection is to boil the heart in water for about an hour to loosen the connective tissues [14]. The next step is to remove all the unnecessary fat from the epicardial (outer) surface. The pulmonary artery and aorta are separated (Figure 12 A). At the anterior interventricular sulcus (Figure 12 A, magnified image in Figure 13 A), some bridging superficial fibers (also called aberrant fibers) are cut through, and the right ventricular (RV) free wall is moved aside (Figure 12 B). The ending edge of the RV free wall is called the ‘Posterior interventricular sulcus.’ To move further in dissection, the RV free wall is pushed laterally, followed by cutting through fibrous trigons. In this way, the basal loop is unfolded (Figure 12 E).
14
.
Figure 13: (A) Anterior interventricular sulcus (AIS): Double headed arrows show the bridging
aberrant fibers. Single headed arrows show the two actual fiber directions separated by the AIS.
(B) Interventricular septum with the ascendant fibers (AS, 1) fibers crossing the descendant
fibers (DS, 2) at right angles, observed from the RV side. Reproduced from [14]
Figure 14: Microscopic view of the top of septum, showing the two distinct fiber groups, namely
AS and DS. Reproduced from [14]
15
Figure 15: Different sections of the flat HVMB band. [14]
The HVMB is divided in two main sections, namely the basal loop (from pulmonary artery to central 180o fold) and the apical loop (from central 180o fold to the aorta) [14] (Figure 15). Both of these loops are further subdivided into two sections respectively (Figure 15). The basal loop is divided into the Right Section (RS) and the Left section (LS), separated by the posterior interventricular sulcus. The apical loop is divided in the descending section (DS) and the ascending section (AS), separated by the anterior papillary muscle.
The RS in the HVMB forms the RV and the LS, DS and AS together forms the LV. Moreover, the HVMB twists and loops one half turn to form the RV and a one-and a-half turn more to form the LV.
HVMB dissection has been recently performed to study the interventricular septum (IS) structure [14]. It has been found that the IS belongs to both the Left and the Right ventricles. The IS comprises of AS and DS fibers from the LV side and recurrent fibers from the RV side. Figure 16 (A) shows the various fiber groups (i.e. AS, DS etc.) forming the LV, RV and IS respectively.
Pulmonary Artery
Aorta Posterior Interventricular Sulcus
16
Figure 16 (B) emphasizes the three major fiber groups participating in the IS formation. These three layers have also been recorded through our dissection of goat hearts.
Figure 16: (A) The various fiber groups forming the heart structure at different regions. (B)
Three main fiber layers forming the interventricular septum. [14]
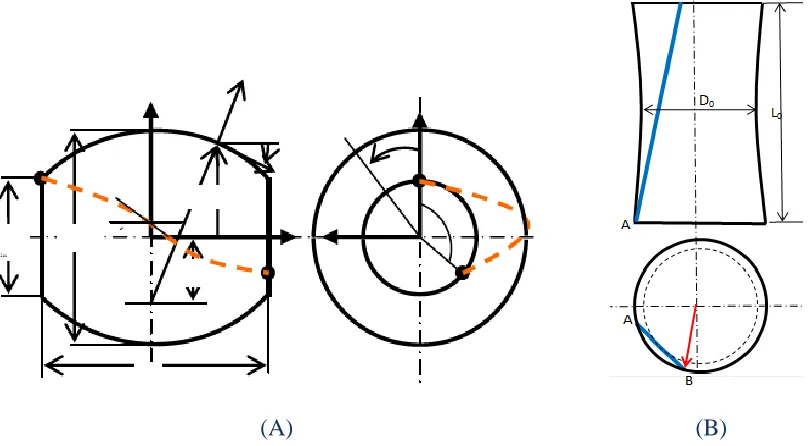
2.3 High Pumping Potential Structures
Lawrie et al. [10] proposed a novel idea that an asymmetric angle-ply FMC structure can be used to produce pumping with a very high PP. Based on this idea, the PP of a cylindrical pump by Lawrie [10] and a novel actuator by Shan et al. [26] were investigated. Ghoneim et al. extended Lawrie’s work to investigate two asymmetric angle-ply FMC structures under axial loading, namely a barrel shaped [11] and hyperbolic [12] structure. The schematic of these two FMC structures, investigated by Ghoneim et al. are shown in Figure 17 (A, B). In both of these structures, carbon fibers were wound in two layers, wetted by polyurethane resin (Adiprene KX208, from ChemPoint), to form a [f] angle-ply FMC laminate. The snapshots of these two
structures are shown in Figure 18 (A, B). The PP of these structures is listed in Table 1.
17
[image:30.612.110.515.82.305.2](A) (B)
Figure 17: Schematic of the asymmetric angle-ply FMC structures investigated by Ghoneim et
al. (A) Barrel-shaped [11] and (B) Hyperbolic [12]
(A) (B)
Figure 18: Snapshots of asymmetric angle-ply FMC structures investigated by Ghoneim et al.
[image:30.612.105.513.400.602.2]18
B B
B B
A A
D0
D1 L0
L1
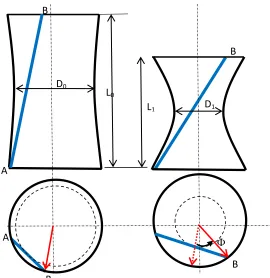
Another idea was also investigated by Ghoneim [27], which is based on torsional loading of a hyperbolic single-ply FMC structure. The schematic of the hyperbolic single-ply FMC structure, with rigid fibers and very low matrix stiffness, is presented in Figure 19. Upon twisting the structure by an angle,, the length decreased from L0 to L1 and the throat diameter decreased
[image:31.612.166.436.228.506.2]from D0 to D1 respectively thus producing a reasonable volume contraction (pumping action).
Figure 19: Schematic of volume reduction (pumping action) in a single-ply hyperbolical
FMC structure upon twisting [27]
19
Structure PP
Cylinder-Piston 1.00
Single-layer LV-like FMC structure 1.67 -1.88
Hyperbolic 2.59
Heart [1, 2] 3.3- 4.0
Barrel Shaped 10.33
Table 1: Pumping Potential of FMC structures
2.4 Single-Layer-Left-Ventricle-Like FMC Structure
A near-conical single-layer LV-like FMC structure [9] was modeled, and investigated experimentally and analytically (using finite element software ANSYS). The modeling was based on the HVMB concept discussed in Section 2.2. Multiple goat hearts were dissected and unfolded into the HVMB. The shape of the band was observed. An idealized fiber orientation was assumed to run along the longitudinal axis of the band (principal fiber direction). The trace of the relevant portion of the band comprising the LV and the assumed fiber orientation was recorded, and a Matlab program was written to numerically twist and loop the band into a near-conical LV-like structure (Figure 20).
(A) (B) (C)
Figure 20: (A) Part of the HVMB band constituing the LV structure. (B) The LV band and crude
single-layer fiber orientation plotted in Matlab. (C) Rolled near-conical LV-like structure with
20
A closer look at the generated near-conical LV-like structure is presented in Figure 21. It is noticed that there are two unique sides of the structure:
1. A descending/ascending side, which is made of two overlapped layers. The fiber orientations of the two layers are different. The two layers constitute an angle-ply laminate.
2. An ascending side, which is constituted of a single layer and has a predominantly circumferential fiber orientation.
Figure 21: A closer look at the near-conical Figure 22: Laminar structure of the heart [14]
LV-like structure
It should be pointed out that, despite the idealized fiber orientation adopted (Figure 21), the engendered 3D fiber orientation (Figure 22) captures some of the main features of the heart’s LV muscle fibers orientation. The two clear ones are [14]:
Descending/Ascending side
21
1. Two crossed fiber populations exist in one portion of the ventricle wall as shown in Figure 22 (descending/ascending).
2. The populations of the fibers consist of a continuous and helical structure.
These structural observations significantly affect the pumping action of the LV-like structure, which has been emphasised previously in Section 2.3, discussing high PP structures.
For the experimental investigation, FMC was used to model the heart muscle. Polyurethane (PU) was employed for the matrix and shape memory alloy (SMA) fibers were used as actuating muscle fibers. The LV-like prototype was produced in three steps: (Figure 24 (a, b))
1. The band was produced using the open mold method, where SMA fibers were placed according to the idealized fiber orientation of the goat’s heart (Figure 23 A).
2. The band was twisted and looped to form the conical LV-like FMC structure.
3. The base of the conical structure was immersed into a bath of polyurethane to form a polyurethane base (Figure 23 B).
Figure 23 (A): The idealized PU/SMA flexible-matrix Figure 23 (B): The final conical LV-like
22
The SMA fibers of the prototype model of the LV-like structure were connected to a power supply, and the apex of the conical structure was shoved with a tube extended out from the apex, as shown in Figure 25. The structure was filled with water, and the SMA fibers were charged. As the fibers were activated and heated up, the structure was partially collapsed, pumping out water along the extended tube.
(a) (b) (c)
Figure 24: Figure showing the two phase construction of the LV like structure followed by the
experimental setup (c). (a) PU/SMA band in a Teflon mold cut in shape of LV band (b) Rolled
PU/SMA band
To estimate the PP of the near-conical LV-like FMC structure, the SMA was charged with the maximum amount of power allowed, which generates the highest strain (L//L0) in the SMA
23
Parameter Experimental ANSYS
V 2.5 cm3 3.55 cm3
V0 50 cm3 37.73 cm3
L/L0 3% 5%
PP 1.67 1.88
Table 2: Pumping potential of single-layer LV-like FMC structure
Figure 25: The experimental set-up
24
Material Property Value Unit
SMA Modulus of Elasticity Poisson’s ratio 133 GPA 0.33
PU Modulus of Elasticity 20 MPA
Poisson’s ratio 0.48
Core Modulus of Elasticity 1 KPA
[image:37.612.101.521.222.509.2]Poisson’s ratio 0
Table 3: Material properties of SMA, PU and core material
Figure 26: The finite element mesh of the PU matrix (left) and SMA fibers (right). [9]
2.5 Cardiac Modeling
[image:37.612.331.494.225.504.2]25
these images are converted to appropriate numerical models through various volume and curve fitting post-processing techniques.
The Auckland Bioengineering group in 1991, for the first time, developed a 3D finite element model [28] of the ventricular geometry (Figure 27) and the associated muscle fiber orientation. The geometry and fiber orientation information was obtained through two-dimensional imaging of a beating canine heart. The fiber orientation observed in the epicardium (Figure 28 A) and endocardium (Figure 28 B) formed an approximate asymmetric angle-ply orientation [28].
Figure 27: Auckland heart model Geometry Figure 28: Auckland heart model fiber orientation
Reproduced from [8] in Epicardium (A) and Endocardium (B) [28]
26
fiber were connected using splines (Figure 29 B). FMC was used to model the LV (Figure 29 C). Figure 29 (D) shows the post-processing result of LV deformation due to systole.
(A) (B) (C) (D)
Figure 29: (A) Heart geometry. (B) Fiber spline plotting. (C) Meshing (D) Systole deformation
simulation. Reproduced from [29]
27
(A) (B)
Figure 30: (A) Fiber orientation from USCD [31]. (B) Fiber Orientation from DT-MRI
In 2008, Wang et al [32] conducted a multi-scale analysis of the cardiac structure. DT-MRI imaging of a rat’s heart was used to obtain the heart geometry and fiber orientation. The approximate relative fiber angles of the endocardial, myocardial (Mid) and epicardial layers were identified in the rat’s heart DT-MRI images, which are presented in different colors in Figure 31.
Figure 31: DT-MRI images of a rat’s heart and the three main fiber orientations [32]
28
the myocardial fiber distribution was similar to that in a human heart, obtained using DT-MRI imaging.
Figure 32: FE biventricular heart model by Goktepe et al [31]
(A) (B)
Figure 33: John Hopkins University canine FE model [36]. (A) Model geometry (B) Fiber
structure
29
DT-MRI imaging was used to construct the geometry and fibers. Moreover, the fibers were categorized into three main groups, namely the circumferential middle layer and vertical outer and inner layers with opposite angles [+/-θ], as shown in Figure 33 (B).
In our current research, the LV has been modeled based on the HVMB hypothesis discussed previously in Section 2.2. The geometry and two-layer fiber orientation adopted is simple, practical (with our current facilities) and supported by literature and dissection results. Moreover, unlike the various cardiac models in literature with a huge number of fibers, the number of fibers considered in our model is very small, to ensure simplicity and practicality of modeling.
2.6 Summary
The LV structure can be considered to be made of a Flexible Matrix Composite (FMC) material [8], with myocardial fibers embedded in a helically overlapping fashion [15, 16], in approximately three distinguishable layers, identified through dissection and histological techniques [17, 18, 21] (Figure 7) and via various imaging techniques [28, 30, 31, 32, 36] (Figures 30, 31 and 33). The inner (endocardium) and outer (epicardium) layers cross each other at opposite angles (+θ/- θ), and the middle layer is mainly circumferential [14, 21, 22, 28, 30, 31, 32, 36] (Figures 7, 8, 16, 28, 31, 33), forming an approximate asymmetric angle-ply laminate structure.
30
the LV on its PP, a simple and practical single-layer near-conical LV-like structure was modeled, and its PP was investigated experimentally and analytically. The modeling was based on the HVMB hypothesis, which states that the heart is made of a single band, which twists and loops to form the two ventricles. The single-layer near-conical LV-like structure yielded a PP of 1.67 experimentally and 1.9 analytically, which, though a reasonable value, is much less than the PP of the heart.
3. Objectives
The primary objective of our current research is to study the effect of a two-layer fiber orientation on the Pumping Potential (PP) of the LV. Previously a single-layer near-conical FMC model of the LV was investigated, yielding an experimental and analytic PP of 1.67 and 1.9 respectively. Though a reasonable value, the PP of the single-layer near-conical FMC model is much less than the PP of the heart (or LV) which is 3.3-4. Consequently, we look at the effect of a more practical two-layer fiber orientation on the PP of the near-conical LV-like model. The PP of the near-conical two-layer LV-like FMC structure is investigated both experimentally and analytically.
4. Preliminary Work
two-31
layer fiber orientation, and the construction of the approximate near-conical shape of the LV. Then, we present the experimental and the finite element (ANSYS) work in Chapter 5.
4.1 Idealizing of Band Trace
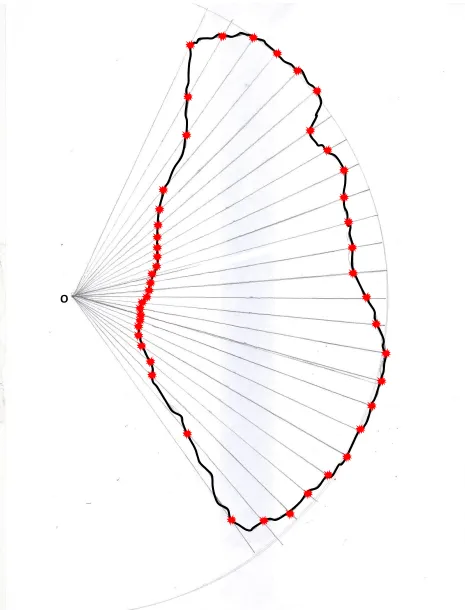
Multiple goat hearts are dissected and unwrapped into HVMB, following the various dissection steps highlighted in the Section 2.2. Figure 34 display the endocardium (innermost layer), of one sample of the HVMB. The shape of the band (red line in Figure 34) is recorded and traced on a sheet of paper (Figure 36). Since we are only studying the LV, the RS (Right Section) of the basal loop, which forms the free wall of RV, is discarded. In addition, the LS (Left Section) is also ignored for the following reasons:
1. In the highly flexible LV structure, the LS is difficult to mimic using our Polyurethane (PU) band, because the PU is not as flexible and compliant as the heart muscle.
2. The LS is a small section adjacent the base of the LV, which is constrained in both our experimental and analytical models, and is consequently assumed to have a very small effect on the pumping action of the LV.
Figure 34: One sample of goat heart HVMB: Endocardium. The approximate LV band is traced
using red line
AS
DS
LS
32
The trace of the LV band is idealized (Appendix A) in order to engender a near-conical shape upon rolling and twisting. This idealization is accompanied by trimming the trace of the LV band into a circular sector with two radii. The schematic of creation of a conical structure from a simple circular paper sector (band) with two radii is shown in Figure 35. The red line (top edge) and the blue line (bottom edge) of the paper band form the base and the apex of the cone respectively. The crude LV band trace with the top edge (red line) and bottom edge (blue line) is shown in Figure 36. The idealized LV band is shown in Figure 37. The red stars are the band coordinate points recorded for using in analytical modeling of the LV band later.
Figure 35: Sheet to cone formation. Red line and blue line represents the base and apex of the
cone respectively. [38]
33
34
4.2 The Two-Layer Fiber Orientation
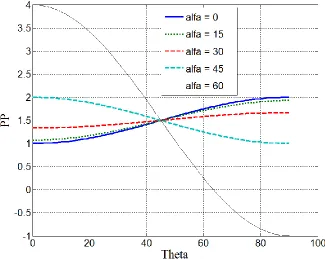
Our aim is to obtain the simplest and most practical fiber orientation in the LV, and to observe its effect on the PP of the twisted and looped near-conical LV-like structure. An analysis is conducted to see the effect of the fiber orientation of a simple asymmetric angle-ply conical structure on its PP. We assumed a cone of radius r and apex angle α, and found the volume change, V, due to a change of the length of two input characteristic lines on the cone’s surface, which makes an angle and - respectively with the slant height, s (Figure 38). The overall rotation was considered to be zero degrees due to the asymmetric angle-ply orientation adopted.
Figure 38: Parameters of the conical surface [9]
The volume, V, of the cone is
2 2 2 2 r s r 3 1 h r 3 1 ) s , r (
V
(Equation 1)
Where, r is the radius, h is the height and s is the slant height. Differentiating with respect to the two variable r and s, we get
35 , s h s r 3 1 r r s r 5 . 1 s rh 3 2
V 2 2 2
2 2
Upon dividing by the volume (Equation 1), we get the expression for the volume reduction ratio:
s s h s r r r s r 5 . 1 s 2 V V 2 2 2 2 2 (Equation 2)
Introducing the following normal components of the strain: The tangential strain θ = r/r, the
slant strain (along s) s = s/s, the fiber’s strain (along the characteristic length) l = L/L, and
m normal to the characteristic line and along the surface of the cone. L is the length of the
characteristic line. Applying the standard strain transformation, we have,
lm m l 2 2 2 2 2 2 s s n m mn mn mn 2 m n nm 2 n m
, (Equation 3)
where m = cos, n = sin, and s and lm are the corresponding shear strain components. We
assumed that the Poisson’s effect is negligible, then when l is imposed, we may impose m = lm
= 0. Consequently, from (Equation 3):
2
s 2 cos L L s s and , sin L L r r
Substituting into (Equation 2), after some manipulation:
2 2 2 2
36
Figure 39: PP of the conical structure
37
Figure 40 (A): Goat heart HVMB Endocardium: Two Main fiber directions (Sky blue and deep
blue lines). The two regions in which these fiber orientations are observed, is separated by
yellow line. The approximate LV band traced is shown using red line
Figure 40 (B): Goat heart HVMB Epicardium: Two Main fiber directions (Green and red lines).
The two regions in which these fiber orientations are observed, is separated by yellow line
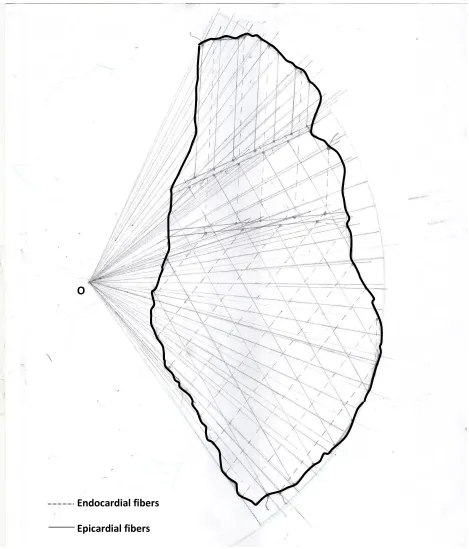
Multiple goat hearts were dissected, and the fiber orientations observed in the two-layers of HVMB were compared with literature, to decide the idealized fiber orientation. The idealized band and two-layer fiber orientation is displayed in Figure 41.
AS
DS
LS
RS
350
1450
AS
DS
LS
38
Figure 41: Idealized LV band trace with epicardial (hard lines) and endocardial (dashed lines)
fiber lines. O
Endocardial fibers
39
4.3 Construction of Two-layer Near-Conical LV-Like FMC Structure
For both the experimental and finite element (FE) work, the construction of the two-layer near-conical LV-like model is accomplished by rolling the flat LV band (including the fibers) into a cone. Analytically, a Matlab code is written to roll each point of the band edges (top and bottom as shown in Figure 36) and fibers into the proper location on the cone. Experimentally, the flat band is manually rolled into the near-conical LV-like structure.
4.3.1 Experimental Construction
40
Figure 42: SMA wires placed in teflon mold Figure 43: PU/SMA band in the mold
Figure 44: PU/SMA LV band Figure 45: Near-conical LV like FMC model
In the second phase, the PU/SMA LV band (Figure 44) is twisted and looped (Section 2.2) to obtain the near-conical LV-like structure (Figure 45). The base of the conical structure is immersed into a bath of polyurethane to form a polyurethane base. The apex of the conical structure is shoved with a small tube extended out from the apex (Figure 45).
41
4.3.2 Analytical Construction
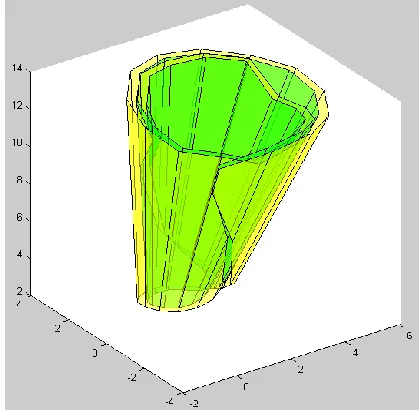
As mentioned above, analytically, the idealized band is rolled into the near-conical shape using a Matlab code. The input to Matlab is a set of points on the LV band edges (Figure 41). The rolling of the flat band surface into a cone is performed using the analysis described in Appendix B. The Matlab codes used for generating both the plots are provided in Appendix C. Figure 46 shows the idealized LV band plotted in Matlab. Figure 47 shows the rolled near-conical LV structure plotted in Matlab.
[image:54.612.200.410.489.694.2]Figure 46: Idealized LV band trace plotted in Matlab
42
The epicardial and endocardial fibers points are plotted on the idealized LV band trace using a Matlab code (provided in Appendix C). In Figure 48, the red and blue colored lines represent the endocardial and epicardial fibers respectively. The fibers are rolled on to the near-conical LV-like structure using a Matlab code (Appendix C). The endocardial and epicardial fibers are located at 1/3rd thickness and 2/3rd thickness distance from the inner surface of the cone respectively. The near-conical LV-like structure with epicardial fibers (in blue color) and endocardial fibers (in red color) is presented in Figure 49.
Figure 48: Idealized LV band with Epicardial (blue) and Endocardial (red) fibers plotted in
43
Figure 49: Near-conical LV-like structure with Epicardial (blue) and Endocardial (red) fibers
rolled in Matlab
A closer look at the generated near-conical two-layer LV-like structure is presented in figure 50. It is noticed that there are two unique sides of the structure:
1. A septal or the Ascending/Descending side, which is made of two overlapping layers. The fiber orientations of the two layers are different. The two layers constitute an angle-ply laminate.
44
Figure 50: A closer look into the near-conical LV-like structure with Epicardial (blue) and
Endocardial (red) fiber layers
Moreover the fiber angles measured in the two unique sides of the structure are:
1. Septal side: Approximately 60o between Ascending and Descending fiber groups.
2. Non-septal side: Both the Ascending and Descending fibers approximately make opposite 60o angles with the circumferential fibers. This observation has been previously reported in literature by Streeter et al, and has been mentioned in the literature section 2.1.
A Matlab code is used to write the rolled band and fiber points into a file (code provided in Appendix C). These points are used subsequently for modeling of the near-conical LV-like structure and the fibers in the epicardial and endocardial layers, in ANSYS.
Septal Side
Non-Septal Side Non-Septal Side
45
5. Experimental and Analytical Work
In the experimental work, the experimental setup is prepared for computation of the PP of the near-conical two-layer LV-like structure. The analytical work section briefly presents the steps of modeling of the near-conical two-layer LV-like model in ANSYS and also the various modeling steps necessary (i.e. Creation of the inner volume, contact relations etc.) for computation of the PP.
5.1 Experimental Work
The SMA wires of the near–conical LV-like structure are connected to a power supply (GW Instek GPS-3303 Dual Output Linear DC Power Supply, 3 Channels, 3 Output Amps, 30 Output Volts, 195 Output Watts), and a plastic measuring tube is connected to the tube fixed to the apex of the conical structure, as shown in Figure 51. The structure is filled with water till the brim of the apex opening, and the SMA fibers are charged. As the fibers are activated and heated up, they contract, causing the structure to deform and to partially collapse inward, pumping out water up the extended measuring tube.
To estimate the PP of the near-conical LV-like FMC structure, the SMA is charged with the maximum allowed power, which generates the highest strain (L//Lo) in the SMA without
46
[image:59.612.140.489.72.415.2]
Figure 51: Experimental set-up
5.2 Analytical Work in ANSYS
The modeling of the near-conical LV-like FMC structure in ANSYS involves the following main steps:
1. The key-points are imported from Matlab, which represent the rolled LV band points for each of the inner and outer surfaces, and plotted in ANSYS workspace. In Figure 52, the red colored 1 and 25 points are the starting and end points respectively of the top basal outer surface of the cone. Similarly the green colored 1 and 25 points are the starting and end points respectively of the top basal inner surface of the cone.
Base
LV-like structure Measuring
Tube
Power Supply
SMA Wire ends
47
Figure 52: Rolled LV band key points plotted in ANSYS
[image:60.612.139.473.431.700.2]2. The various key-points in Figure 52 are connected using splines and lines as shown in Figure 53 in different colors.
48
3. The areas are created from lines in Figure 53. First, the top basal area (Red) in Figure 54 is created by using the two long basal splines (pink and purple) and two short ending lines (Yellow and Purple) in Figure 53. Secondly, the blue and purple rectangular areas are created (Figure 54). Thirdly, the green apical area is created by using the two long apical splines (green and pink) and the two small lines (blue and grey) in Figure 53. Next, the outer main surface (purple) is created by using the outer basal spline (pink), red and blue straight lines and outer apical spline (green) in Figure 53. The inner main surface is generated similarly. A total of six surfaces created can be visualized using Figure 54.
[image:61.612.135.477.300.543.2]
Figure 54: Two views of the rolled LV band areas plotted in ANSYS
49
Figure 55: LV main volume Figure 56: Subdivided LV main volume
5. The key-points representing the rolled fibers of the Epicardium (at 2/3rd thickness) and Endocardium (at 1/3rd thickness) are imported from Matlab and plotted in ANSYS. Each of the key-points are connected through B-splines to generate fiber lines. A sample of fiber line plotted in ANSYS is shown in Figure 57.
Figure 57: Single fiber spline plot Figure 58: Area created normal to a fiber line
50
6. The fiber volumes with square cross-section are created by sweeping a square area (0.06 cm*0.06 cm) along every fiber line (Figure 58). Each of the fiber volumes are then divided into at least 3 sub volumes, to avoid meshing difficulties due to volume twisting (Appendix F). The square cross-section is adopted to limit the number of elements generated while meshing (mapped) (Figure 59).
Figure 59: Number of elements generated using mapped meshing in case of a square
cross-section is much less than in case of circular cross-cross-section
7. The fiber volumes are overlapped with the main LV volume using ‘OVERLAP’ operation. Figure 60 shows the fibers (blue) inside one main sub volume. Figure 61 shows the complex volume of a main sub volume, due to overlapping operation of the sub volume with fibers.
51
8. The common surface shared by the main sub volumes in blue and red colors in Figure 62, are bonded using contact–target pair elements as shown in Figure 63.
Figure 62: Volumes sharing common surface Figure 63: Contact-target pairing in main volume
in LV main volume
52
(A) (B)
Figure 64: (A) and (B) are two views of the different parts of the inner volume (in different
colours), enclosed within the LV main volume (transparent).
10.The material properties for the Polyurethane (PU) LV main volume, SMA fibers and inner volume (core) are listed in Table 4. The element type selected is Solid 186 for the main volume, fibers and the inner volume.
Material Property Value Unit
SMA
Modulus of Elasticity 133 GPA
Poisson’s ratio 0.33
Thermal Expansion coefficient
10-4 K-1
PU Modulus of Elasticity 20 MPA
Poisson’s ratio 0.48
Core Modulus of Elasticity 1 KPA
Poisson’s ratio 0
[image:65.612.108.507.78.401.2]53
11.The finite element mesh is generated in three phases. First, the fibers are meshed using hex-mapped meshing technique and appropriate sizing controls. The mesh of the fibers is shown in Figure 65 (A), with epicardial fibers in yellow color and endocardial fibers in red color. Secondly, the Main LV sub volumes are meshed using tet-free meshing technique and with smart sizing ‘5’. The LV main volume mesh is shown in Figure 65 (B).
(A) (B)
Figure 65: (A) Epicardial (yellow) and Endocardial (red) fiber mesh. (B) Mesh of the LV main
[image:66.612.131.514.254.617.2]54
Thirdly, the inner volume is meshed using tet-free meshing technique and with smart sizing ‘Off’. The inner volume mesh is shown in Figures 65 (C, D). The main purpose of Figure 65 (D) is to show how well the inner volume mesh fits inside the main volume mesh (transparent). Some major difficulties faced while meshing are discussed in Appendix F.
Figure 65 (C): Inner volume mesh Figure 65 (D): Inner volume mesh inside
main volume mesh (transparent)
[image:67.612.338.510.214.530.2] [image:67.612.105.258.221.534.2]55
[image:68.612.103.526.73.320.2]
Figure 66: Contact-pairs involved in bonding of the inner volume parts with the main volume
13.Boundary conditions: The top basal surface of the near-conical LV-like model in ANSYS is constrained in all degrees of freedom (DOF’s). All the fiber elements are thermally charged (indirectly using temperature loading) with 2% thermal strain.
14.A large deformation analysis is invoked and a non-linear solution is computed.
6. Results and Discussions
56
6.1 Experimental Results
Experimentally, to estimate the PP of the near-conical LV-like FMC structure, the SMA is charged with the maximum allowed power, which generates the highest strain (L//Lo) in the
SMA without destroying the shape memory of the wires. The volume of the displaced water (V) in the extended tube is measured, and the PP of the near-conical LV-like FMC structure is computed using the following equation:
(Equation 4)
Three experiments with five trials each were conducted. The results are summarized in Table 5. From the results, the average experimental PP is in the range of 2.73-2.95 approximately. The first trial (marked in red) is neglected in each experiment, because the SMA wire contracts under the maximum strain (approximately 4%) and undergoes a small amount of permanent hysteresis in the first trial. In the subsequent trials, the maximum SMA strain becomes consistent (approximately 3.6%).
Experimental Results
Parameter V(mL) Vo(mL) L/Lo(%) PP
Experiment 1 Trial 1 7.5 61 4 3.07
Trial 2 6.5 61 3.6 2.95
Trial 3 6.5 61 3.6 2.95
Trial 4 6.5 61 3.6 2.95
Trial 5 6.5 61 3.6 2.95
Experiment 2 Trial 1 8 68 4 2.94
Trial 2 7 68 3.6 2.85
57
Trial 4 7 68 3.6 2.85
Trial 5 7 68 3.6 2.85
Experiment 3 Trial 1 7.5 66 4 2.84
Trial 2 6.5 66 3.6 2.73
Trial 3 6.5 66 3.6 2.73
Trial 4 6.5 66 3.6 2.73
Trial 5 6.5 66 3.6 2.73
Table 5: Experimental Pumping Potential (PP) results
6.2 Analytical Results
The deformation of the inner volume (V) in the near-conical LV-like ANSYS model, under a thermal strain (L//Lo) in all the embedded fiber volumes, is calculated (Appendix E). The
pumping potential (PP) is computed using the following equation:
(Equation 4)
The results are summarized in Table 6. The un-deformed and deformed mesh of the main LV volume, fibers and inner volume are shown in Figures 67, 68 and 69 respectively.
Analytical Results
V(mL) Vo(mL) L/Lo(%) PP
4.6453 92.0594 2 2.5
58
Figure 67: Main volume and inner volume mesh before (left) and after (right) deformation
Figure 68: Fiber mesh deformed shape (yellow) and un-deformed edges (dashed black lines)
[image:71.612.213.398.389.687.2]59
Figure 69: Inner volume mesh before (left) and after (right) deformation
Additionally, in the ANSYS animation, a clockwise ventricular apical twist [23] or wringing effect was observed clearly (also observed in Figure 67). Another effect observed was the thickening of the inner walls [41] (Appendix G) of the main volume. These effects have been previously pointed out in the literature and are believed to enhance the pumping efficiency of the LV.
7. Conclusions
Left-Ventricle-60
like FMC model, the PP has improved significantly, indicating that the fiber orientation in the heart plays an important role in defining its PP.
The difference between the PP of our near-conical two-layer LV-like FMC structure and the heart can be mainly attributed to the following reasons:
1. Idealized fiber orientation: A more accurate fiber orientation with a higher number of fibers should significantly improve the PP.
2. The material properties of the FMC (PU/SMA) adopted in our model are completely different from the biological properties of the heart's muscle, which may have a considerable effect on the PP, as previously observed in literature [43].
3. The boundary conditions are different. In our near-conical LV-like model, both in experiments and ANSYS, the base is fixed and the outer surface is free. This is different from the heart (Appendix H), in which, various structures such as the basal skeleton (no rotation [1]), apex (no translation along the long axis [1]), the pericardial sac (a conical sac of fibrous tissue surrounding the heart, which is radially stiff but circumferentially free [44]), and the atrial and ventricular valves constrain the myocardial motions [44, 45]. 4. The strain application scheme on the fibers (single step), in our experiments and analysis,
61
8. References
[1] Grosberg A., Gharib M., 2009, Computational models of heart pumping efficiencies based on contraction waves in spiral elastic bands, J. Theoretical Biology, Vol 257, pp. 359-370.
[2] Buckberg G.D., 2002, Basic science review: The helix and the heart, J Thorac and Cardio Surg, Vol 124, pp. 763-883.
[3] Aster J., Kumar V., Abbas A.K., Fausto N., 2005, Diseases of the white blood cells, lymph nodes, spleen and thymus, Robbins and Cotran pathologic basis of disease, Philadelphia, Elsevier Saunders, Ed. 7, pp. 661-695.
[4] http://www.britannica.com/blogs/2012/09/the-reptilian-nature-of-the-human-heart/ [5] http://www.efunda.com/formulae/solid_mechanics/composites/comp_intro.cfm
[6] Zdrahala R.J., Zdrahala I.J., 1999, Biomedical Applications of Polyurethanes: A Review of Past Promises, Present Realities, and a Vibrant Future, J. BiomaterAppl, Vol 14, pp. 67-90. [7] http://www.fibre-reinforced-plastic.com/2010/12/lamina-and-laminate-what-is-that.html [8] Hunter PJ, Borg TK. Integration from proteins to organs: the physiome project. Nat Rev Mol Cell Biol 2003; 4(3): 237—43.
[9] H. Ghoneim and A. Chanda,‘Pumping Potential of a Left-Ventricle-Like Flexible-Matrix-Composite Structure’, e-Proceedings of the 19th International Confer-ence on Flexible-Matrix-Composite Materials (ICCM19), Montreal Canada, 2013, pp: 7457-7462.
[10] Lawrie DJ, President, Lawrie Technology Inc., Girard, PA 16417, private communication. [11] Ghoneim H., and Santos T., 2010, Evaluation of the Pumping Action of a Barrel-Shaped Composite Shell Structure, AmerSoc Mechanical Engineers, New York.
62
[13] Harvey W., 1628, An anatomical disquisition on the motion of the heart and blood in animals, In: Willis FA, Keys TE, eds. Cardiac classics. London: Henry Kimpton, 1941: 19-79. [14] Kocica M.J., Corno A.F., Costa F.C., Rodes M.B., Moghbel M.C., Cueva C.N.C, Lackovic V., Kanjuh V., Guasp F.T, 2011, The helical ventricular myocardinal band; global, there-dimensional, functional architecture of the ventricular myocardium, Eur J CardiothoracSurg, Vol 29, pp. 21-40.
[15]Stensen N., 1664, De musculisetglandulisobservationum specimen, cum epistolisduabusanatomicis. Amsterdam:P le Grand, 90.
[16] Lower R., 1669, Tractatus de corde. London: J Allestry.
[17] Senac J.B., 1749, Traite de la structure du coeur. Paris: J Vincent.
[18]Ludwig C., 1849, Ueber den Bau und die Bewegungen der Herzventrikel. ZeitschriftfiurrationelleMedicin, Vol 7, pp. 189-220.
[19] MacCallum J.B., 1900, On the muscular architecture and growth of the ventricles of the heart. Johns Hopkins Hosp Rep, Vol 9, pp. 307-35.
[20] Mall F.P., 1911, On the muscular architecture of the ventricles of the human heart, Am J Anat, Vol 11, pp. 211-78.
[21] Streeter D.D., Spotnitz H.M., Patel D.P., Ross J., Sonnenblick E.H., 1969, Fiber orientation in the canine left ventricle during systole and diastole. Circ Res, Vol 24, pp. 339-47.
[22] Greenbaum R.A., Ho S.Y., Gibson D.G., Becker A.E., Anderson R. H., 1981, Left Ventricular Fiber Architecture in Man, Br Heart J, Vol 45, pp. 248-63.
63
[24] Gil D., Borras A., Ballester M., Carreras F., Aris R., Vazquez M., Marti E., Poveda F., 2009, MIOCARDIA: Integrating cardiac function and muscular architecture for a better diagnosis, In: proceeding of 14th International Symposium on Applied Sciences in Biomedical and Communication Technologies, Barcelona, Spain.
[25] WWW.Torrent-guasp.com
[26] Shan Y, Shan Y, Philen M, Lotfi A, Li S, Bakis CE, Rahn CD and Wang K-W. “Variable stiffness structures utilizing fluidic flexible matrix composites,” Journal of Intelligent Material Systems and Structures. Vol. 20, pp 443-456, 2009.
[27] H. Ghoneim, “Investigation of the pumping action of a hyperbolic composite shell structure
using the spline collocation method,” Proceedings of the American Society for Composites, No. 028, 2007.
[28] Nielsen, P. M., et al. "Mathematical model of geometry and fibrous structure of the heart." American Journal of Physiology-Heart and Circulatory Physiology260.4 (1991): H1365-H1378.
[29] Dorri F., Niederer P.F., Lunkenheimer P.P., 2004, A finite element model of the human left ventricular systole, Computer Methods in Biomechanics and Biomedical Engineering, Vol. 9, pp. 319-341.
[30] Sermesant M., 2006, An Electromechanical Model of the Heart for Image Analysis and Simulation, Ph.D Thesis, Kings College, London, U.K.
64
[32] Wang T.T., 2008, Multi-Scale analysis of cardiac-myoarchitecture, Master’s Thesis, Massachusetts Institute of Technology, Boston.
Link: http://dspace.mit.edu/handle/1721.1/45210
[33] Goktepe S., Acharya S.N.S., Wong J., Kuhl E., 2010, Computational modeling of passive myocardium, International Journal for Numerical Methods in Biomedical Engineering, Vol. 27, pp. 1-12.
[34] Holzapfel G.A., Ogden R.W., 2009, Constitutive modeling of passive myocardium. A structurally-based framework for material characterization, Philosophical Transactions of the Royal Society of London, Series A, Vol. 367, pp.3445–3475.
[35] Dokos S., Smaill B.H., Young A.A., LeGrice I.J., 2002, Shear properties of passive ventricular myocardium, Am J. of Physiol (Heart Circ. Physiol.), Vol. 283, pp. 2650–2659. [36] Trayanova, Natalia A. "Whole-heart modeling applications to cardiac electrophysiology and electromechanics." Circulation Research 108.1 (2011): 113-128.
[37] Torrent-Guasp, Francisco FESC, W. F. Whimster, and K. Redmann. "A silicone rubber mould of the heart." Technology and Health Care 5.1 (1997): 13-20.
[38] http://www.mettleworks.com/graphics/cone.jpg
[39] Kocica, Mladen J., et al. "The helical ventricular myocardial band of Torrent-Guasp." Seminars in Thoracic and Cardiovascular Surgery: Pediatric Cardiac Surgery Annual. Vol. 10. No. 1. WB Saunders, 2007.
[40] http://www.dynalloy.com/pdfs/TCF1140.pdf
65
[42] Spotnitz H.M., Sonnenblick E.H., 1976, Structural conditions in the hypertrophied and failing heart. In: Mason DT, editor. Congestive heart failure. New York: Yorke Medical Books; pp. 13-24.
[43] Guccione, J. M., A. D. McCulloch, and L. K. Waldman. "Passive material properties of intact ventricular myocardium determined from a cylindrical model." Journal of biomechanical engineering 113.1 (1991): 42-55.
[44] W
![Figure 1: Various components of the human heart [4]](https://thumb-us.123doks.com/thumbv2/123dok_us/42003.3624/16.612.99.511.71.328/figure-various-components-human-heart.webp)
![Figure 12: Detailed HVMB dissection steps [14]](https://thumb-us.123doks.com/thumbv2/123dok_us/42003.3624/25.612.180.476.75.288/figure-detailed-hvmb-dissection-steps.webp)
![Figure 26: The finite element mesh of the PU matrix (left) and SMA fibers (right). [9]](https://thumb-us.123doks.com/thumbv2/123dok_us/42003.3624/37.612.101.521.222.509/figure-finite-element-mesh-matrix-left-fibers-right.webp)