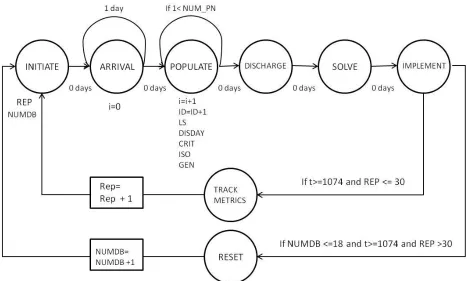
Rochester Institute of Technology
RIT Scholar Works
Theses Thesis/Dissertation Collections
4-22-2013
Analysis and optimization of patient bed
assignments within a hospital unit while
considering isolation requirements
Christina Cignarale
Follow this and additional works at:http://scholarworks.rit.edu/theses
This Thesis is brought to you for free and open access by the Thesis/Dissertation Collections at RIT Scholar Works. It has been accepted for inclusion in Theses by an authorized administrator of RIT Scholar Works. For more information, please [email protected].
Recommended Citation
Rochester Institute of Technology
Analysis and Optimization of Patient Bed Assignments within a
Hospital Unit while Considering Isolation Requirements
A Thesis
Submitted in partial fulfillment of the
requirements for the degree of
Master of Science in Industrial Engineering
in the
Department of Industrial & Systems Engineering
Kate Gleason College of Engineering
by
Christina Cignarale
i
DEPARTMENT OF INDUSTRIAL AND SYSTEMS ENGINEERING
KATE GLEASON COLLEGE OF ENGINEERING
ROCHESTER INSTITUTE OF TECHNOLOGY
ROCHESTER, NEW YORK
CERTIFICATE OF APPROVAL
M.S. DEGREE THESIS
The M.S. Degree Thesis of Christina Cignarale
has been examined and approved by the
thesis committee as satisfactory for the
thesis requirement for the
Master of Science degree
Approved by:
Dr. Rubén Proaño, Thesis Advisor
ii
ABSTRACT
Healthcare Associated Infections (HAIs) are infections acquired by patients admitted in
healthcare facilities. These infections can be contagious or even worse, fatal, which has
prompted the medical community to put guidelines in place to isolate patients who may pose a
risk of spreading or be susceptible to an infection(s). These isolation practices also have the
unwanted consequence of constraining the options for inpatient bed assignments since infected
patients cannot be assigned to a room where uninfected patients reside.
Historically, hospitals in the United States have been built with single and double
bedrooms to provide inpatient care. As long as demand for a bedroom is less than the number of
bedrooms in the hospital, bed assignment is a trivial process. Difficulties for determining bed
assignments occur when hospital units operate at full or nearly full bed utilization and must
continue to admit new patients. When this occurs, the units’ administrators must determine when
to admit new patients, whether current patients need to be discharged to make room for new
more critical patients, or if there is a need to exchange the rooms of already admitted patients
(i.e., internal movement). These decisions are complicated by the limited bedroom capacity
(number of rooms and occupancy threshold in rooms) and by the need to implement isolation
guidelines necessary to prevent and contain the occurrence of HAIs.
This study presents two optimization models to suggest how to accommodate admitted
and incoming patients in a hospital unit to satisfy all isolation requirements, while
simultaneously maximizing the total criticality of patients admitted into the unit and minimizing
the number of internal movements. These models provide bed assignment recommendations
based on available bed demand and patient characteristic information for a current planning
iii
Additionally, we explore the use of the first model to suggest a methodology for determining the
number of single and double bedrooms in a hospital unit as well as the stockpile of spare
resources necessary to ensure a desired service level for inpatient hospitalization demand, when
isolation requirements are considered. Finally, the second model which considers future demand
is explored to examine the effect on bedroom assignments incurred from the number of periods
iv
TABLE OF CONTENTS
1. INTRODUCTION ... 1
2. PROBLEM STATEMENT ... 5
3. LITERATURE REVIEW ... 7
3.1 Operations Research in Hospital Inpatient Bed Assignments ... 7
3.2 Simulation Studies for Hospital Bed Management ... 8
3.3 Hospital Bed Admission Policies... 9
3.4 Hospital Bed Allocation ... 9
3.5 Hospital Room Occupancy Studies ... 10
3.6 The Need and Potential Impact of Additional Bed Assignment Optimization Methods 10 4. PATIENT SCHEDULING METHODOLOGY ... 12
4.1 Single Period Methodology ... 12
4.1.1 PCCU Hospital Application ... 16
4.2 Experimenting with the Single Period Model: Addressing Strategic Bed Assignment Challenges ... 21
4.2.1 Simulation ... 21
4.2.2 Results & Analysis of the Single-Period Model ... 24
4.3 Future Knowledge Consideration Methodology ... 30
4.3.1 Estimating the Probabilities of Requiring a Bed in the PCCU in a Given Day ... 37
4.4 Experimentation of Future Knowledge Consideration Model ... 39
4.4.1 Exploratory Sampling ... 40
4.4.2 Experimentation: Exploring the Effect of Different Planning Horizons in Bed Assignment Decisions ... 47
5. CONCLUSIONS AND FUTURE WORK RECOMMENDATIONS ... 58
REFERENCES ... 59
APPENDICES ... 63
v
Appendix B: Code Development for Experimentation ... 64
Appendix C: Simulation C++ Code ... 68
Appendix D: Future Knowledge Math Programming Model... 79
Appendix E: Determining Number of Patients per LOS Category ... 81
Appendix F: Data File Creation for Future Knowledge Consideration Model ... 83
1
1. INTRODUCTION
In recent years, Healthcare Associated Infections (HAIs) rates have become a significant
concern in the health care community [1,2]. HAIs are infections that patients acquire while
receiving medical care at a healthcare facility most commonly after surgery or during prolonged
stays for treatment [3]. In 2002, it was estimated that in United States hospitals 1.7 million
patients were infected by HAIs, and 6% of those patients died from complications of the
infection [4]. To prevent HAIs the Centers for Disease Control and Prevention (CDC) as well as
other health care organizations such as the World Health Organization, the Infectious Disease
Society of America, the Society of Healthcare Epidemiology, the Association for Professionals
in Infection Control, the European Centre for Disease Prevention and Control, and the
Department of Health in the United Kingdom have created isolation guidelines to help hospitals
prevent HAIs [5–11].The cost of treating and preventing these HAIs in the United States
exceeded $USD 30 billion in 2007[3].
Clinical studies have proven that properly following these HAI guidelines reduces their
occurrence [3]. However, despite this improvement in care, the implementation of isolation
precautions still presents challenges that affect hospitals’ ability to deal with many operational
aspects including patient bed assignments. For example, Shenoy et al. indicates that for patients
with methicillin-resistant staphylococcus aureus (MRSA) and vancomycin-resistant
enterococcus (VRE) infections the time to receiving a bed assignment was longer than that of a
patients that did not suffer from these complications [12]. The study attributed the isolation
2
Currently, hospitals make bed assignments primarily relying on the judgment of
experienced nurses. A typical nursing process to assign patients to beds is described in detail in
Figure 1 [13]. Nurses need to use this process several times a day.Determining the best
patient-bed assignments and patient movements among the thousands of potential alternatives becomes
difficult for this multi-criteria decision problem. The problem is especially critical in units with
high utilization rates. The questions that arise from this process are as follows: Should an
incoming patient be admitted? Should a less critical admitted inpatient be released to have more
available beds? Should a reassignment of patients within the unit (i.e., internal movement) be
performed to facilitate accommodating more patients?
These decisions must be made considering each patient’s diagnosis, characteristics (e.g.,
gender, age, mental status, medical needs), and the isolation requirements necessary to prevent
the patient from acquiring HAIs or from infecting other patients in the unit. Therefore, in order
to admit a new inpatient to a unit while considering all the aforementioned restrictions, it is
often necessary to perform multiple internal movements, in which a pair of patients exchanges
their bed assignments. However, these internal movements are expensive to implement since
each movement requires two room disinfection procedures and hospital staff must devote time
to accommodate the moved patients into their new beds. Internal movements consume valuable
nursing time that could be otherwise used to care for patients. Furthermore, internal movements
can create a higher risk for infection since the patients are exposed to more people.
A technique to approach this problem is to use a mathematical program to model the bed
3
goals. For example, assigning the largest number of patients into a unit while mitigating the
number of internal movements may be a desired goal for this problem. To ensure all assignments
are valid the constraints would consider patient characteristics such as gender and isolation
requirements. In this thesis we formulate a methodology to model this decision-making process.
Figure 1: Nurse Bed Assignment Process [13]
Assigning Patient Rooms Using the Steps of the Nursing Process Room Assignment Process
1. Gather available data using medical diagnosis and pertinent history
2. Determine whether the patient needs require placement close to nurse's station
3. Determine need for isolation or special precautions
4. Identify rooms available
5. Gather information about current patients and circumstances in rooms available
Analysis
1. Analyze the disease processes of the newly admitted patient
2. Evaluate physical layout of the room being considered for the new patient 3. Compare the needs of the new and current patients to room availability
Outcome Indentifications
1. Indentify who the roommate of the new patient will be.
2. Evaluate the expected effects for the new and current patient
Plan
1. Determine what room placemen would be the best for the patient based on his/her functional status
Implementation
1. Place patient in assigned room
Evaluation
1. Continue to monitor, evaluate and reevaluate patient's status based on changes in laboratory data, further diagnostic test findings, and changes in patient conditions
4
The research presented in this thesis was developed in collaboration with the Pulmonary
and Critical Care Unit (PCCU) at Rochester General Hospital (RGH) in Rochester, NY. The
PCCU provided historical data and clinical expertise to support this study. In the remainder of
this document we will refer to the PCCU simply as “the unit”. Patients in the PCCU are very ill,
need critical respiratory care, require lengthy hospitalization stays, and may be subject to one or
multiple isolation requirements. These considerations combined with the number and type of
bedrooms available in the unit produce a complex environment for bed assignments. The PCCU
is comprised of 10 single-patient and 8 double-patient rooms giving the unit 26 beds in total.
Moreover, the unit commonly operates at or near full capacity since typical patients stay for
5
2. PROBLEM STATEMENT
It is evident that bed assignments require more than the availability of a bed.
Multi-patient rooms, infectious agents, and critical medical needs add complexity to Multi-patient care, more
specifically to patient bed assignments. The focus of this study is to address the operational and
strategic bed management challenges considering isolation requirements by the application of
optimization based solutions. To support bed assignment decision-making, two optimization
models were developed to maximize the criticality of patients in a hospital unit while minimizing
the number of internal movements that occur within the unit; the first model, considers patient
information available for a single planning period, and the second model considers likely patient
information over multiple planning periods. In this work, criticality is a patient characteristic
assigned to all patients to describe their relative medical conditions. In the first model critically is
assigned as a numeric value from 0-10 where the value of 10 is considered to be the most critical
value. A slight variation on criticality values is made for the second model and is discussed in
section 4.4.1. Additionally, the model minimizes the number of internal movements by a penalty
expression in the objective function.
Moreover, we integrate the single-period optimization model into a Monte Carlo
experiment to strategically determine the optimal number of single and double bedrooms in a
particular hospital setting that results in the best tradeoff between occupancy levels and the
number of internal movements performed. This analysis was also used to suggest target
inventory levels of key resources to accommodate a random inpatient demand for given service
6
Furthermore the second optimization model proposed in this thesis aims to examine the
implications of considering the likelihood of seeking admission by potential inpatients (i.e.
patients from the ICU) on current bed assignment decisions. Experimentation with this
multi-period model aims to illustrate how to determine the optimal number of multi-periods into the future a
hospital unit should observe to determine the best bed assignment for the current planning
period.
One benefit of developing these methodologies for the bed decision-making process
would be an application hospital assignment staff could use to receive valid bed assignment
suggestions with minimal effort and in a relatively small amount of time. We have included an
application of this suggestion in section 4.1.1. Furthermore, the experimentation done using the
models presented in this study would be advantageous in hospital unit planning. The models
provide a general approach for assignments which can be tailored to make decisions based on
7
3. LITERATURE REVIEW
This section reviews previous literature on inpatient bed-placement, bed capacity
planning, and hospital placement policies that dictate what type of bedrooms each unit should
have and the criteria for inpatient admission.
The use of mathematical models for scheduling medical services is not new.
Optimization methods have been used in hospitals to schedule surgeries, lab tests, scans, dialysis,
and staffing purposes[14–21]. However, despite the benefits of these solutions, most applications
have not been implemented across hospitals, due to costs, and the fact that most solutions are
highly customized for specific hospital needs.
3.1 Operations Research in Hospital Inpatient Bed Assignments
Demeester et al.[22], and Ceschia and Schaerf [23] propose optimization models that can
be used to determine how to assign inpatients to beds across a hospital comprised of six
departments and under hypothetical information considering patient gender, diagnosis, room
type, age, and patient preference. However, these studies fail to consider the effect of isolation
requirements in patient placement which is what this work includes.
Demeester et al.[22] proposes a search method to allocate inpatients to beds, while trying
to increase service levels and reduce the number of bed transfers between different hospital
rooms, offering gender-specific rooms, and satisfying other specific healthcare needs. In this
study, the authors consider a search space of all available beds across different units of a
8
appropriate departments based on medical needs and patient preferences while keeping
department admissions balanced (i.e. all departments within the hospital have roughly the same
number of patients within each departmental unit). Demeester’s model assigns as many patients
as possible to the rooms of their preference while maintaining hospital constraints such as gender
separation, age separation, medical condition separation, among others [22].
Ceshcia and Schaerf [23] extend Demeester et al. [22] work and propose a
multi-neighborhood local search method to improve the solution time of assigning patients to subsets
of beds. This model applies two pre-processing steps to reduce computational efforts; the first
step restricts the search area to a set of rooms instead to a set of beds. The second step uses a
penalty matrix to assess the value of assigning a patient to a bed within a group of beds, while
considering the suitability of its room to the patient’s needs and preferences.
3.2 Simulation Studies for Hospital Bed Management
Simulation models have also been commonly used to deal with patient placement
problems [24–28]. For example, Harper and Shahani [24] use discrete event simulation across
multiple hospital units to analyze several patient admissions and bed allocation policies used to
determine the optimal number of beds in a unit. Similarly, Dumas[25], Vassilacopoulos [26],
Khare [27], and Williams [28] propose simulation studies that focus on determining the optimal
number of beds per unit while maintaining effective hospital systems. Dumas [25] focuses on
assigning patients to the proper units based on their care needs and suggests policies for
re-assigning patients when they are “misplaced.” Such “misplacement” occurs when patients are
9
analyzes the appropriate number of beds to have in different hospital units while abiding by a
priority policy in which all hospital’s emergency patients are assigned to inpatient rooms
immediately under limited bed capacity. Through Monte Carlo simulation experiments, Khare
[27] and Williams [28] ascertain that increasing the number of beds in the emergency department
can reduce the overall length of stay of inpatients.
3.3 Hospital Bed Admission Policies
Hospital bed management also involves determining whom to hospitalize into a unit
when patient bed demand exceeds availability. Shmueli [29] proposes a stochastic model that
maximizes the overall survival rate in an intensive care unit by recommending a
first-come-first-serve admissions policy for patients who exhibit survival benefits that exceed a minimum
threshold level. The threshold level results from factoring in the decline in admissions into the
ICU and the improved probability of survival of each admitted patient. The survival probability
is calculated from mapping the expected improvement of the survival rate that results from
admitting a patient into the unit compared to the rate if the patient has not been admitted. The
patient’s survival score that is used in comparison to the threshold level results from considering
the patient’s age, gender, general diagnosis, and the number of patients already in the unit.
3.4 Hospital Bed Allocation
Bed assignment is also affected by the way hospitals determine the number and type of
rooms available in their units [26–28]. However, these decisions are typically taken using
approaches that are tailoring to particular hospital realities. Two of the most common means to
10
methodology [30]. However, neither of these approaches takes into consideration that bed
demand fluctuates over time. Nguyen et al. [30] propose an alternative model to determine the
number of beds needed for surgical and internal medicine departments based on the number of
internal patient transfers, the number of days with no possibility for unscheduled admissions, and
the number of days having pre-established blocks of unused beds. The model’s goal is to
minimize the number of unoccupied beds. Similarly, Gong et al.[31] proposes a multi-objective
comprehensive learning particle swarm optimization model with a binary search-based
representation to maximize admission rates and bed utilization simultaneously.
3.5 Hospital Room Occupancy Studies
There are opposing opinions regarding whether single-patient rooms are more cost
effective than multi-occupancy rooms. In 2011, Boardman and Forbes [32] claimed that the net
social benefit of a bed in a single-patient room in the USA was $USD 70,000 higher than that for
a bed in a multi-patient room. Chaudhury et al.[33] concludes that the net social impact for
single-patient rooms is lower than those for multi-occupancy rooms. Factors such as reduced
transfers, higher occupancy rates, and fewer medication errors associated with having single
patient rooms contribute to cost reductions. Therefore, it is inconclusive at this time to claim
which rooms are more cost effective. Further studies need to be performed.
3.6 The Need and Potential Impact of Additional Bed Assignment Optimization Methods
As shown in the literature review, there are several areas of study regarding inpatient bed
scheduling. First, there is the process of assigning a patient to an appropriate bed. Furthermore,
11
addition to these considerations a hospital must determine what admission criteria will be used
for qualifying patients to different units within the hospital. Lastly, hospitals must determine the
type of rooms that will be included in each unit. Operation research methods, simulation, and
surveys have been utilized as methods to solve these problems [11,14,22–33]. Here we also
present a methodology that includes operation research methods and simulation. Yet, this work
expands upon the studies presented here by including isolation requirement considerations.
This inclusion is paramount since it is law for health care facilities to follow these
isolation precautions. Creating a model for assigning patients to beds without this consideration
could result in inappropriate bed assignments. Not considering these requirements may also
result in oversimplified models that are not reflective of actual hospital scenarios leading to
inappropriate conclusions for hospital planning. Therefore, it is in the interest of the medical
community to include this feature into patient bed scheduling methodology to create the most
applicable suggestions.
The following section describes the methodology proposed in this thesis, which aims to
bridge the voids existing in current literature that does not consider isolation requirements in
12
4. PATIENT SCHEDULING METHODOLOGY
The methodologies presented here are general formulations that are later tested using
historical data from a partnership with a local hospital. Detailed information regarding data
creation and simulation methods will be included in the appendix section for reference.
4.1 Single Period Methodology
This section describes a single-period deterministic model that suggests how to
accommodate groups of admitted and incoming patients within a hospital unit (PCCU). The
model captures the decision process a unit administrator would use to determine bed assignments
by considering the relative criticality and isolation requirements of each patient. The model aims
to maximize the critical level of the unit and minimize the number of internal movements.
Additionally, the resulting allocation plan must avoid moving patients with user-specified
restrictions (for example, due to the use of specialized equipment, morbidly obese patients, or
patients who have recently been moved.) Lastly, the model must respect gender requirements
and isolation requirements for double patient rooms. Different genders and isolation
requirements cannot be assigned to the same multi-occupancy room.
The model requires several assumptions. First it is assumed that the configuration of the
unit (i.e., number of double and single rooms) is known and will not change during the current
decision period. It is also assumed that the isolation requirements and criticality of each patient
are known and will not change during the current period. Furthermore, if a patient has ended his
or her length of stay in the unit he or she will immediately be discharged during the current
period. Of course, discharges may not occur instantaneously in a real hospital setting due to other
13
To perform all these objectives the model was developed as a binary integer
programming model. This type of model was appropriate due to its application in scheduling
problems. Furthermore, the instances of this problem contain a small number of variables due to
the size of the unit therefore choosing a nonlinear approach does not propagate extensive
computational time.
The formulation of the model is described below:
: set of patients currently occupying beds within the unit
: set of patients seeking admission
: set of all patients (i.e., )
: set of all available rooms
: triage room,
D: discharge room,
: number of beds available in room
: set of single-patient rooms.
: gender of patient
: isolation type of patient
: critical state of patient , relative to other patients in P (this could be assessed
as a number e.g. 1 less critical, 10 more critical).
{
{
14 The problem decision variables are given by:
{
{
{
Therefore, the resulting optimization problem corresponds to the following binary integer
programming problem:
Maximize ∑ ∑ ( | |) (0)
s.t.
∑ ( )
( ) ( )
( ) ( )
∑ ( ) ( )
∑ ( ) ( )
∑
( )
( )
( )
∑ ( )
15
The proposed model assumes that on any given day, the hospital unit must manage a set
of patients, including those patients that already have an assigned bed (i.e., patients currently
admitted to the unit), , and the group of incoming patients seeking admission into the unit, .
The hospital unit has rooms available to accommodate patients. Two of the rooms, T and D
correspond to the triage and discharge areas where patients are stationed before and after
entering the unit, respectively. It is assumed that these two areas have ample capacity to
accommodate a large number of patients and do not represent any specific hospital area. The
remaining rooms in are single-patient and multi-patient rooms, where the number of beds in
room j is given by Bj. Additionally, the model considers that there is a finite set of isolation
requirements which must be taken into account to accommodate incoming patients. These
isolation requirements dictate that patients who have a particular isolation cannot be assigned a
room with another patient who does not require the same isolation precaution.
The optimization model assigns patients to beds considering the patient’s criticality level,
gender, isolation requirements, current placement within the hospital, and if the patient is
flagged. The flag is an indicator used to mark if a particular patient cannot be moved to another
room in the unit. For example, a flag could be used if the patient is using equipment that is
extremely difficult to move or if a patient recently moved into the unit.
The objective function (0) penalizes the number of internal movements needed to
accommodate incoming patients, while maximizing the number of highly critical patients in the
unit. For implementation purposes, the model’s objective function was linearized using a similar
16
expression was altered by introducing two new variables and one new constraint for assigning
values to those new variables. This altered form of the objective function and the additional
constraint are shown below.
Maximize ∑ ∑ ( ( ))
( )
There are several constraints in place to facilitate that only proper room assignments
occur. Constraint (1) ensures that every patient must be assigned a room in the set of R rooms
(including T and D). Constraint (2) assigns a value to all the gender variables, . Constraint (3)
assigns a value to all isolation variables, . Constraints (4) and (5) ensure that each
multi-patient room host multi-patients with only one type of isolation requirement at most, and with the same
gender. Constraint (6) ensures that the number of patients in a room does not exceed the number
of beds available in the room. Constraint (7) prevents moving patients that currently have a room
within the unit into the Triage area. Constraint (8) prohibits patients from being directly moved
from the triage to discharge area without being assigned a bed in the unit. Constraint (9) prevents
moving patients assigned to private rooms to another private room within the unit. Constraint
(10) ensures that patients that have a flag are not moved from their rooms.
4.1.1 PCCU Hospital Application
Using the methodology presented in the prior section we created a simple, user friendly
tool that hospital bed assignment staff can utilize to facilitate bed assignment decisions. The
interface of this tool was created in Microsoft Excel and the solver utilized for computing the
17
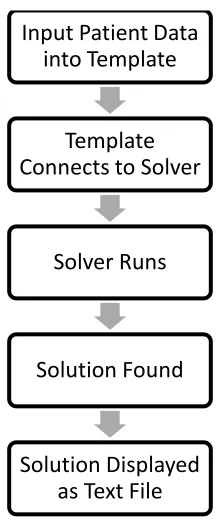
[image:24.612.233.341.145.406.2]require the hospital to purchase any licenses for operation. The entire tool operates as shown in
Figure 2.
Figure 2: Flowchart for Assignment Tool
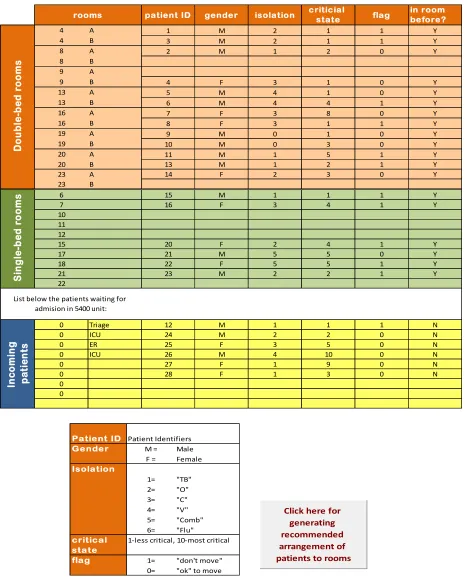
The template in Excel serves as the means for bed assignment staff to input patient
characteristics. An example of the template is shown in Figure 3. The tool requires as inputs the
patient information regarding both the patients in the unit and those seeking admission. When the
user requests the tool to generate a bed assignment, the Excel interface internally generates a data
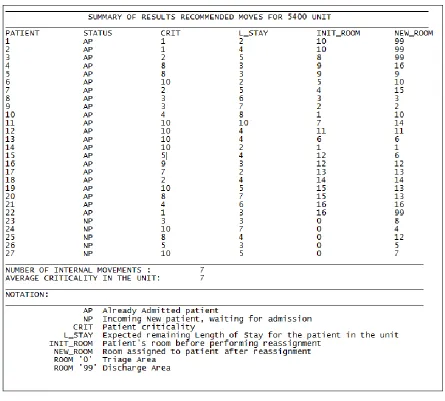
file that can be used by GLPK to solve the model presented in 4.1. The solution is automatically
read from GLPK and translated into a spreadsheet for the users to view. An example of the
displayed results is shown in Figure 4.
Input Patient Data into Template
Template Connects to Solver
Solver Runs
Solution Found
18
Figure 3: Example of Excel User Interface
TARP -5400: Tool for the assigment of rooms to patients in the 5400 Unit
patient ID gender isolation criticial state flag in room before? Patient ID
Patient Identifiers
4 A 1 M 2 1 1 Y Gender M = Male
4 B 3 M 2 1 1 Y F = Female
8 A 2 M 1 2 0 Y Isolation
8 B 1= "TB"
9 A 2= "O"
9 B 4 F 3 1 0 Y 3= "C"
13 A 5 M 4 1 0 Y 4= "V"
13 B 6 M 4 4 1 Y 5= "Comb"
16 A 7 F 3 8 0 Y 6= "Flu"
16 B 8 F 3 1 1 Y critical 1-less critical, 10-most critical
19 A 9 M 0 1 0 Y state
19 B 10 M 0 3 0 Y flag 1= "don't move"
20 A 11 M 1 5 1 Y 0= "ok" to move
20 B 13 M 1 2 1 Y
23 A 14 F 2 3 0 Y
23 B
6 15 M 1 1 1 Y
7 16 F 3 4 1 Y
10 11 12
15 20 F 2 4 1 Y
17 21 M 5 5 0 Y
18 22 F 5 5 1 Y
21 23 M 2 2 1 Y
22
0 Triage 12 M 1 1 1 N
0 ICU 24 M 2 2 0 N
0 ER 25 F 3 5 0 N
0 ICU 26 M 4 10 0 N
0 27 F 1 9 0 N
0 28 F 1 3 0 N
0 0 D o u b le -b e d r o o m s S in g le -b e d r o o m s
List below the patients waiting for admision in 5400 unit:
rooms In c o m in g p a ti e n ts
Click here for generating recommended arrangement of patients to rooms
TARP -5400: Tool for the assigment of rooms to patients in the 5400 Unit
patient ID gender isolation criticial state flag in room before? Patient ID
Patient Identifiers
4 A 1 M 2 1 1 Y Gender M = Male
4 B 3 M 2 1 1 Y F = Female
8 A 2 M 1 2 0 Y Isolation
8 B 1= "TB"
9 A 2= "O"
9 B 4 F 3 1 0 Y 3= "C"
13 A 5 M 4 1 0 Y 4= "V"
13 B 6 M 4 4 1 Y 5= "Comb"
16 A 7 F 3 8 0 Y 6= "Flu"
16 B 8 F 3 1 1 Y critical 1-less critical, 10-most critical
19 A 9 M 0 1 0 Y state
19 B 10 M 0 3 0 Y flag 1= "don't move"
20 A 11 M 1 5 1 Y 0= "ok" to move
20 B 13 M 1 2 1 Y
23 A 14 F 2 3 0 Y
23 B
6 15 M 1 1 1 Y
7 16 F 3 4 1 Y
10 11 12
15 20 F 2 4 1 Y
17 21 M 5 5 0 Y
18 22 F 5 5 1 Y
21 23 M 2 2 1 Y
22
0 Triage 12 M 1 1 1 N
0 ICU 24 M 2 2 0 N
0 ER 25 F 3 5 0 N
0 ICU 26 M 4 10 0 N
0 27 F 1 9 0 N
0 28 F 1 3 0 N
0 0 D o u b le -b ed r o o m s S in g le -b ed r o o m s
List below the patients waiting for admision in 5400 unit:
rooms In co m in g p at ie n ts
Click here for generating recommended arrangement of patients to rooms
TARP -5400: Tool for the assigment of rooms to patients in the 5400 Unit
patient ID gender isolation criticial state flag in room before?
Patient ID Patient Identifiers
4 A 1 M 2 1 1 Y Gender M = Male
4 B 3 M 2 1 1 Y F = Female
8 A 2 M 1 2 0 Y Isolation
8 B 1= "TB"
9 A 2= "O"
9 B 4 F 3 1 0 Y 3= "C"
13 A 5 M 4 1 0 Y 4= "V"
13 B 6 M 4 4 1 Y 5= "Comb"
16 A 7 F 3 8 0 Y 6= "Flu"
16 B 8 F 3 1 1 Y critical 1-less critical, 10-most critical
19 A 9 M 0 1 0 Y state
19 B 10 M 0 3 0 Y flag 1= "don't move"
20 A 11 M 1 5 1 Y 0= "ok" to move
20 B 13 M 1 2 1 Y
23 A 14 F 2 3 0 Y
23 B
6 15 M 1 1 1 Y
7 16 F 3 4 1 Y
10 11 12
15 20 F 2 4 1 Y
17 21 M 5 5 0 Y
18 22 F 5 5 1 Y
21 23 M 2 2 1 Y
22
0 Triage 12 M 1 1 1 N
0 ICU 24 M 2 2 0 N
0 ER 25 F 3 5 0 N
0 ICU 26 M 4 10 0 N
0 27 F 1 9 0 N
0 28 F 1 3 0 N
0 0 D o u b le -b ed r o o m s S in g le -b ed r o o m s
List below the patients waiting for admision in 5400 unit:
rooms In co m in g p at ie n ts
19
Figure 4: Example Output from Assignment Tool
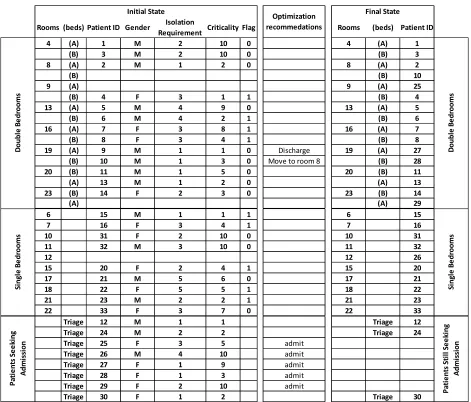
To examine the benefits of this tool, consider an assignment scenario described in the
Table 1 below. This example depicts a typical day at the Pulmonary Critical Care Unit at RGH
(PCCU). In this example, the unit has 22 hospitalized patients, 13 and 9 in double and single bed
rooms, respectively. The unit can accommodate 4 additional patients, 3 in double bedrooms, and
1 in a single bed room. Eight patients, with different criticalities and isolation requirements are
seeking admission from a triage area. Now the questions arise of which patients should be
20
performed? The last three columns of Table 1 show the recommendations from the
implementation of assignment tool. The tool suggests that 5 patients can be admitted after
[image:27.612.76.547.200.602.2]performing only 1 internal movement and 1 discharge.
Table 1: PCCU Unit Example
Rooms (beds) Patient ID Gender Isolation
Requirement Criticality Flag Rooms (beds) Patient ID
4 (A) 1 M 2 10 0 4 (A) 1
(B) 3 M 2 10 0 (B) 3
8 (A) 2 M 1 2 0 8 (A) 2
(B) (B) 10
9 (A) 9 (A) 25
(B) 4 F 3 1 1 (B) 4
13 (A) 5 M 4 9 0 13 (A) 5
(B) 6 M 4 2 1 (B) 6
16 (A) 7 F 3 8 1 16 (A) 7
(B) 8 F 3 4 1 (B) 8
19 (A) 9 M 1 1 0 Discharge 19 (A) 27
(B) 10 M 1 3 0 Move to room 8 (B) 28
20 (B) 11 M 1 5 0 20 (B) 11
(A) 13 M 1 2 0 (A) 13
23 (B) 14 F 2 3 0 23 (B) 14
(A) (A) 29
6 15 M 1 1 1 6 15
7 16 F 3 4 1 7 16
10 31 F 2 10 0 10 31
11 32 M 3 10 0 11 32
12 12 26
15 20 F 2 4 1 15 20
17 21 M 5 6 0 17 21
18 22 F 5 5 1 18 22
21 23 M 2 2 1 21 23
22 33 F 3 7 0 22 33
Triage 12 M 1 1 Triage 12
Triage 24 M 2 2 Triage 24
Triage 25 F 3 5 admit
Triage 26 M 4 10 admit
Triage 27 F 1 9 admit
Triage 28 F 1 3 admit
Triage 29 F 2 10 admit
Triage 30 F 1 2 Triage 30
21
4.2 Experimenting with the Single Period Model: Addressing Strategic Bed Assignment
Challenges
The experimentation conducted for this study was designed to determine the optimal
number of single and double bedrooms in the PCCU and to ascertain if an increase in the
historical arrival rate to the unit would affect the suggested unit configuration. For implementing
this experimentation, a large simulation model was developed in Visual Studio 2010 using C++
and GLPK. The detail of the C++ code is included in Appendices B & C.
In the first set of experiments, the configuration of the unit was analyzed to determine the
ideal mix of single and double bedrooms for the PCCU unit. Initially the simulated unit
contained 18 single bedrooms. Then successively for each new subset of experiments, one of the
single bedrooms was replaced by a double bedroom. This continued until there were only double
bedrooms in the unit. A detailed explanation of the simulation is provided in the next section.
4.2.1 Simulation
To address the strategic challenge of determining the optimal mix of single and double
bedrooms in a hospital unit, we propose a large simulation model that for each possible unit
configuration emulates the utilization of rooms over 5 years of simulated inpatient demand.
The simulation model is described by the event graph in Figure 5.To begin, the unit was
populated with a set of patients for day 0. Next, a random number of incoming patients was
generated following the distribution of inpatient demand per day at the PCCU (see Figure 6).
22
unique ID; a randomly generated length of stay (LOS), which followed the distribution described
in Figure 7, a discharge day and a criticality level, an isolation category, and a gender randomly
generated following discrete uniform distributions. To elaborate, a patient had an equal chance to
be assigned any value of 0-7 for isolation, 0 being they did not have an isolation requirement.
[image:29.612.72.539.261.542.2]Next, it was determined if any patient should be discharged from the unit.
23
Figure 6: Empirical Distribution of the Number of New Patients Requiring Daily Admission to the PCCU, Based on 3 Years of Historical Information
Figure 7: Empirical Distribution of the Length of Stay of Patients Admitted into the PCCU, Based on 3 Years of Historical Information
Once all the characteristics for the set of incoming patients to be considered for
admission to the unit were determined then the model presented in Section 4.1 acted as a unit
administrator. The model determined the best patient-to-room assignment solution in order to
accommodate the random pool of incoming patients while minimizing the number of internal
movements and maximizing the unit utilization by admitting the most critical patients. The
solution for each problem instance was stored and the following statistics were collected: the
iteration number for the simulation, the clock time, the number of internal movements 0.00%
5.00% 10.00% 15.00% 20.00% 25.00% 30.00%
1 2 3 4 5 6 7 8 9
number of incoming patients
0.0% 5.0% 10.0% 15.0% 20.0% 25.0% 30.0% 35.0%
[image:30.612.197.450.360.512.2]24
performed, the number of patients assigned to beds in the unit, the average criticality in the unit,
the number of internal movements incurred in the day, and the objective value for the
optimization model.
For each bedroom configuration, the proposed optimization model solved 30 replications
for 5 years of historic data. After thirty replications were run then the conditions of the unit were
reset for a different bedroom configuration. The baseline configuration for experimental
comparison is eight double bedrooms and ten single bedrooms which was the configuration in
the PCCU. Overall this study simulated more than 500,000 days of inpatient arrivals to the unit.
4.2.2 Results & Analysis of the Single-Period Model
As stated earlier, the goal of this experimentation was to determine the optimal mix of
single and double bedrooms for the PCCU as well as to determine an appropriate safety stock
level of resources to provide a given service level within the unit. The following discussion
explains the implications gathered from modifying the number of single and double bedrooms
within the unit and practical suggestions for managing bed resources.
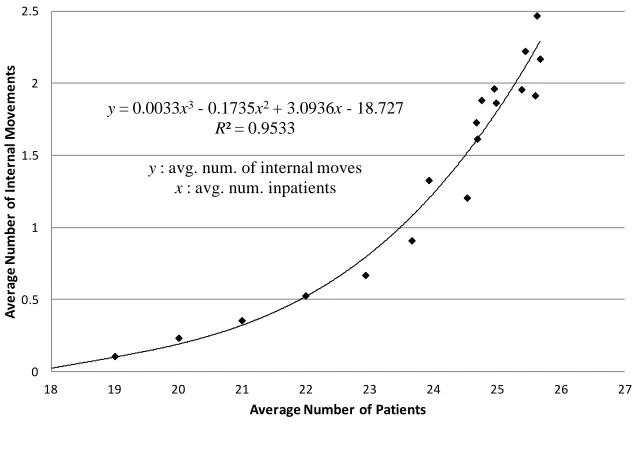
Figure 8 shows that there is a strong correlation between the average number of admitted
patients (E[Pa]) and the average number of internal movements (E[N]). The trend line in Figure
8, results from a linear regression model and describes a polynomial of order 3 relationship
between E[N] and E[Pa]. This trend line can be useful for daily planning in the unit. In particular,
it can help determine daily staffing and resources necessary to deal with an expected number of
25
Figure 8: Correlated Fit Between the Average Number of Internal Movements Per Day & the Average Number of Inpatients Per Day
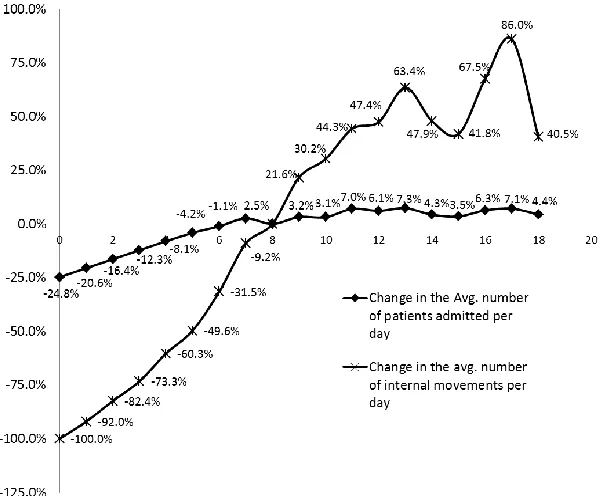
Figure 9 describes the relative change of the average number of internal movements and
the relative change in the average number of inpatients admitted to the unit for varying number
of double bedrooms in the unit with respect to the base layout of eight double bedrooms.
Furthermore, Figure 9 shows that when the unit’s capacity is increased, the average number of
internal movements increases faster than the growth in capacity.
Considering this information it seems that the optimal number of single and double
bedrooms cannot be determined explicitly since different incentives will lead to different
conclusions. For example, reviewing Figure 9 shows that reducing the number of double
bedrooms to 5 would reduce the number of internal movements by 60% and the number of
admitted patients by 8%. Depending on who the decision maker is, it may be worth it to reduce
capacity by three beds. Looking at Figure 10(a) shows that the 8% reduction corresponds to an
average of admitting one fewer patient to the unit. The results of this experimentation may not
y= 0.0033x3- 0.1735x2+ 3.0936x- 18.727
R² = 0.9533
y: avg. num. of internal moves x: avg. num. inpatients
0 0.5 1 1.5 2 2.5
18 19 20 21 22 23 24 25 26 27
A
ve
ra
ge
N
u
m
b
e
r
o
f
In
te
rn
al
M
o
ve
m
e
n
ts
26
state conclusively the number of single and double bedroom to have within the unit but the
[image:33.612.155.454.177.425.2]results can provide the means to develop a business case for a certain unit configuration.
Figure 9: Percent Change in the Average Number of Inpatients Per Day in the Unit and the Average Number of Internal Movements as a Result of Different Double Bedroom Configurations
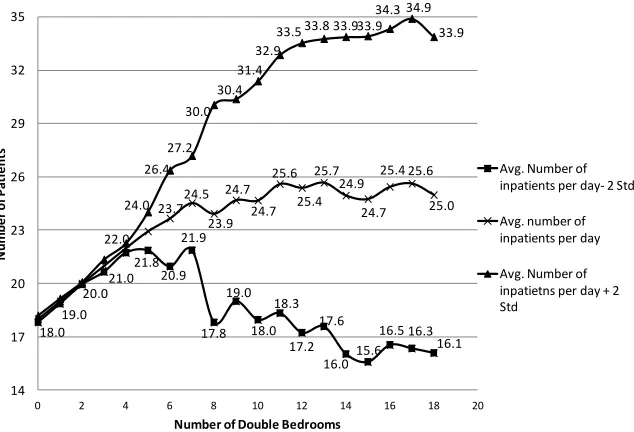
Furthermore, Figure 10 (a) and 10 (b) show that increasing the number of double beds in
the unit not only allows an increase in the average number of admitted inpatients and inpatient
movements, but also in their variability. If variability in the number of admitted inpatients was
negligible, it will be easy to determine the exact number of additional resources needed to cope
with the increasing number of patients. However, in order to mitigate the effects of the
increasing variability in the number of inpatients and internal movements, unit administrators
can reduce the number of double-patient rooms in the unit or they can rely on securing a buffer
(or a “safety stock”) of additional resources to cope with potentially high inpatient demand.
27
other resources (e.g., nurses and cleaning personnel) necessary to provide a given service level of
% to patients seeking admission to the unit. A service level of % implies that there is a
% probability that the unit will not be able to cope with incoming patient demand due to
insufficient resources (e.g., beds). We propose that the safety stock levels of different resources
necessary to cope with the increasing variability in demand can be determined using standard
manufacturing practices [26]. Assuming a constant lead time for receiving an order of additional
resources, L, the safety stock, ss, is expressed by √ , where is a standardized
normal value for the service level , and is the variance of the number of admitted inpatients
associated with the unit layout.
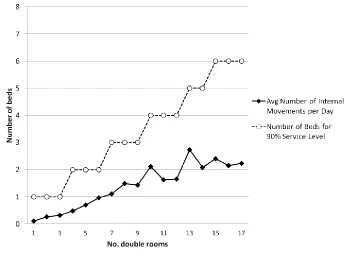
For example in the case of beds, Figure 11(a), shows the necessary safety stock of beds
(i.e., number of beds to block) to provide a 90% service levels for the unit, as the number of
double-bed rooms in the unit increases (for L=1). Figures 11(b) and 11(c) report similar results
but for inpatient arrival distributions, that have on average 1 and 2 more patients per day than
what is currently faced by the unit, respectively. Figures 11 (a), (b), (c) indicate that there are
safety stock levels of beds that are robust to changes in the average patient arrival rate, and
provide a desired service level. For example, at the current configuration of eight double-patient
rooms, the unit would need to ensure access to 3 additional beds to cope with the uncertainty in
28
Figure 10 (a): The Average Number of Inpatients and 2 Standard Deviations from the Mean Versus the Number of Double Bedrooms
Figure 10 (b): The Average Number of Internal Movements and 2 Standard Deviations from the Mean versus the Number of Double Bedrooms
18.0 19.0 20.0 22.0 21.8 20.9 21.9 17.8 19.0 18.0 18.3 17.2 17.6 16.015.6 16.5 16.3 16.1 23.724.5 23.9 24.7 24.7 25.6 25.4 25.7 24.9 24.7 25.4 25.6 25.0 21.0 24.0 26.4 27.2 30.0 30.4 31.4 32.9
33.5 33.8 33.933.9 34.3 34.9 33.9 14 17 20 23 26 29 32 35
0 2 4 6 8 10 12 14 16 18 20
N u m b e r o f P at ie n ts
Number of Double Bedrooms
Avg. Number of inpatients per day- 2 Std
Avg. number of inpatients per day
Avg. Number of inpatietns per day + 2 Std
0.1 0.20.4 0.5
0.7 0.91.2 1.3
1.6 1.71.9 2.02.2 2.0 1.9 2.2 2.5 1.9 0.9 1.5 2.0 2.6 3.1 3.8 4.7 5.4 6.3 7.0 7.8 8.3 9.3 9.3 9.5 10.8 11.8 10.4 0.0 2.0 4.0 6.0 8.0 10.0 12.0 14.0
0 2 4 6 8 10 12 14 16 18 20
N u m b er o f In te rn al Mo ve m en ts
Number of Double Bedrooms
[image:35.612.153.470.115.331.2] [image:35.612.149.460.390.607.2]29
Figure 11 (a): The Number of Additional Beds Needed to Provide a 90% Service Level at the Historic Patient Demand Level
[image:36.612.132.488.96.351.2] [image:36.612.115.495.409.688.2]30
Figure 11(c): The Number Additional of Beds Needed to Provide a 90% Service Level at the Historic Patient Demand Level Plus Two Additional Patients on Average
4.3 Future Knowledge Consideration Methodology
The single period model was designed for use when inpatient demand is known as well as
all patients’ characteristics. However, hospital units may also have some additional information
about patients who may seek admission in the future. For example, there could be patients in the
ICU or in the Emergency Room who are expected to seek a bed in the PCCU by the next day.
Thus, in this section we propose an extension to the bed assignment model provided in section
4.1 that incorporates when the likelihood of seeking admission is known for patients currently
not requiring admission into the unit but who may do so in the upcoming days. Incorporating
future knowledge in today’s bed assignment decision-making may be advantageous, if for
example, keeping a bed unused allows for admitting a highly critical patient tomorrow, without
[image:37.612.126.480.111.383.2]31
This model considers a current planning period (period 1), where a hospital unit has a
number of patients already admitted in the unit. At this time, the unit contemplates a set of
patients seeking admission Pn, and a third set of patients, PT, who may seek admission one or
more periods into the future. Without loss of generality, all PT patients are assumed to be ICU
patients. The possibility of seeking admission for patients in PT is modeled by the parameter, pi,
which describes the likelihood that a patient i in the ICU will be discharged from the ICU on
any given day and requests admission to the PCCU. For sets Pa and Pn it was assumed that the
probability that these patients require a bed in the PCCU is one since these patients are known to
demand a bed in the unit, respectively. Further explanation on the generation of this probability
parameter is described in section 4.3.1. Moreover, a series of weights, are used to describe
the relative importance of the expected bed assignments in day k towards the overall bed
assignment plan. For example, information available for period 1 in the planning horizon would
be given the largest weight since it is the period during which the assignments are actually made
and the available information is the most accurate. The information of subsequent periods would
be given decreasing weights to reflect the growing uncertainty and their decreasing importance
towards the overall bed assignment plan.
There are particular assumptions in this model that differ from the implementation
discussed in section 4.1. First, patients already admitted in the unit can either remain in their
original assignments or can be moved to another bed within the unit, but they cannot be
discharged. This assumption results from the fact that admitted patients to the PCCU have a
longer LOS than a practical planning horizon for bed managing purposes. Second, patients who
32
onwards since these periods represent future assignments. Third, it is assumed that the ICU is
fully occupied at the time of making a bed assignment decision (i.e., at period 1). We also
assumed that the ICU is always at full capacity. Finally, it is assumed that if a patient in PT is
recommended for admission in a future period of the planning horizon, he or she cannot be sent
back to the ICU in any subsequent period.
The configuration of the unit (eight double bedrooms and 10 single bedrooms) is kept
consistent over all planning periods. Moreover, the criticality and isolation requirements
assigned in period 1 remain constant over all planning periods. Additionally, patients in set PT
are assigned criticalities higher than patients in sets Pa and Pn since being in the ICU indicates a
more critical condition. Moreover, the criticalities for ICU patients are assumed static (i.e., they
do not change after a patient has been assigned a bed in the PCCU) since patients' future health
conditions are uncertain.
The resulting model provides a bed assignment schedule for the current planning period
while inducing the lowest expected number of internal movements. The model considers all
restrictions used in the single-period model of section 4.1, plus additional constraints necessary
to consider future events.
The notation and formulation of the multi-period model is described as follows:
: set of patients currently admitted to the unit
33
set of patients who are currently not seeking admission and remain in the ICU but
may seek admission during the planning horizon
: set of all patients (i.e., )
: set of patients in the unit and seeking admission (i.e., )
: set of all available rooms
: triage room
D: discharge room,
U: ICU,
: number of beds available in room
H: set of planning periods (H=1…t)
: set of single-patient rooms.
: gender of patient
: isolation type of patient
: the assessed level of how much patient needs intensive medical care (it can
take a value 0-10)
the smoothing weight factor assigned for each planning period
{
: the probability associated with each patient seeks a room in the unit
34 Decision variables:
{
{
{
Maximize
∑ [∑ ∑ | ( )|]
∑ [∑ ∑ ( |
( )|) ( )
]
(0)
s.t.
∑ ( )
( ) ( )
( ) ( )
∑ ( ) ( )
∑ ( ) ( )
∑
( )
35
( )
( )
∑ ∑
( )
( )
( )
∑ ( )
( )
( )
As stated earlier, this model focuses on incorporating the use of future knowledge
regarding patients who may seek admission into the unit. A set, of patients is added to the
original formulation having the additional parameter, . The set H, was added to describe the
number of periods for which the decision maker will look into the future to make a decision now.
Furthermore, as mentioned earlier, a series weights, is included to describe the relative
importance of periods to the schedules.
It should also be noted in this multi-period bed assignment model, criticality is defined
as in the single-period model representation on a scale from (1-10) for patients seeking
admission and for those patients within the unit. A value of 10 is interpreted as a patient who is
highly critical. However, patients in PT, who are currently being treated in the ICU are assigned a
criticality value higher than those of admitted patients (Pa) and those currently seeking admission
36
The objective function in (0) consists of two weighted sum expressions. The first
summation maximizes the expected criticality in the unit while penalizing the expected number
of internal movements for patients currently in the unit and for those seeking admission. The
second summation corresponds to the expected criticality and penalty resulting from future
admission of any ICU patients who do not seek admission in the unit during period 1.
Constraint (1) ensures that all patients are assigned to a room in each period. Constraint
(2) ensures that for every period, a patient is assigned to a double room only if the room already
has a patient with the same gender. Constraint (3) ensures that for every period, a patient can be
assigned to an occupied double room if both patients have the same isolation requirements.
Constraint (4) prohibits more than one gender in a double bedroom for each period. Constraint
(5) prohibits more than one isolation condition in a double bedroom for each period. Constraint
(6) ensures room capacity is not exceeded. Constraint (7) ensures that for each planning period,
patients assigned to a single-bedroom cannot be moved to another single-bedroom. Constraint
(8) ensures that admitted patients are not moved to the Triage area. Constraint (9) ensures that
admitted patients and those seeking admission to the unit are not assigned to the ICU during any
period. Constraint (10) ensures that patients in PT are not given a room in period 1. Constraint
(11) and Constraint (12) are necessary to set initial conditions for patients seeking admission and
those already admitted. Constraint (11) assigns every patient in set Pn to the “Triage” area during
period 0. Constraint (12) assigns the initial bed assignments to Pa patients which can be
interpreted as where the patients are assigned for period 0. Constraint (13) does not allow
37
Lastly, Constraint 14 controls if patients can be discharged from the unit during any period. This
constraint can be modified by changing the µ parameter.
4.3.1 Estimating the Probabilities of Requiring a Bed in the PCCU in a Given Day
This section describes how to estimate the parameter pi used in the model to describe the
probability that a patient i (in the ICU but not seeking admission to PCCU today) is discharged
from the ICU and requires a bed in the PCCU during a later day.
Unfortunately, historical data regarding LOS and hospitalization rates in the ICU at our
partner hospital were not available for this part of the study; hence, this section relies on a study
available in literature to develop our estimates. In particular, we take advantage of Ong et al.
[35] who surveyed the LOS of 4902 ICU patients over 7 years in a United States Hospital. As a
result, Ong et al. [35] categorizes ICU patients according to the LOS distribution as presented in
38
Figure 12: LOS Distribution from ICU Patients
X axis = length of stay (days)
Y axis = percentage of all intensive care unit (ICU) patients.
The demand for a bed in the PCCU by an ICU patient i for a given day is a Bernoulli
random variable with probability pi. Therefore, the number of days until an ICU patient requires
a bed in the PCCU, N, follows a geometric distribution with parameter p. Therefore, the
probability that an ICU patient requires a bed in the PCCU x days after the day of planning is
given by P(N=x) = ( ) , which indicates that the patient stays (x-1) consecutive days in
the ICU before requiring admission to the PCCU in day x.
Since the expected value of a geometrically distributed random variable corresponds to
the reciprocal of its parameter p, we can estimate the value of p by the reciprocal of the expected
number of days for a patient to first seek a bed in the PCCU (i.e., p=1/E[N]). Since ICU patients
have different LOSs in the ICU, based on Ong et al [35] categorization, the value of p for a given
39
corresponding to the patient’s LOS category. For example, consider a category 1 patient
expected to stay in the ICU for 1 or 2 days. Thus the probability that this patient seeks a bed in
the PCCU is estimated by the average of ½ and 1, which results in ½ ( ½ + 1/1 )= ¾. The
resulting estimated values for p for all ICU patients according to their LOS are given in Table 2.
Table 2: Estimated Probability Parameters for Each LOS Category
4.4 Experimentation of Future Knowledge Consideration Model
We use the future knowledge model described in section 4.3 to explore, whether
considering information about the future results in improved bed assignment plans compared to
plans resulting from considering patient information only for the day in which planning occurs.
Therefore, we propose an experimental setting in which the future knowledge model is solved
using a 22 factorial design, for which each problem instance is solved over different planning
horizons. A full description of this experimental approach is described in the following two
sections. Patient characteristics for the elements of these problem sets (i.e., each patient's gender,
criticality, and isolation requirement) are randomly generated similarly to the single- period
experimentation. A detailed explanation on how these patient sets and their characteristics were
randomly simulated is included in the Appendix F.
LOS Categories
(days)
Calculation of p Estimated p
1-2 1/2( 1/2 +1) 0.75
3-7 1/2(1/3 +1/7) 0.23
8-15 1/2(1/8 + 1/15) 0.10
16-29 1/2(1/16 + 1/29) 0.05
40
In a preliminary analysis we aim to determine the most effective experimental setting for
evaluating the performance of applying the future knowledge model over different planning
horizons. This exploratory exercise, evaluated the bed assignments resulting from the solution of
our model for a small set of problem instances that differ in the number of patients in their sets
Pn and Pa, and changes in the criticality values for patients in the ICU (PT). Given this
understanding of the model, a set of narrowly scoped experiments were designed considering
different numbers of patients in sets Pn and Pa, where ICU patients (PT) have criticality values of
11-15.
4.4.1 Exploratory Sampling
We consider a baseline configuration in the PCCU with eight double bedrooms and ten
single bedrooms according to the current arrangement used in the single period model
experimentation. To explore the effect on bed assignments from the criticality values assigned to
the ICU patients, we constructed three distinct problem conditions with differing numbers of
patients in sets Pa, Pn, and PT that resulted in differing number of beds available per condition.
For each of these problem conditions all patient characteristics were randomly generated with the
exception of the relative criticality of PT patients (ICU patients). From each problem condition
we created two problem instances (or data sets), one having a criticality value of 20 for all ICU
patients (data8a, data10a, data14a), and the other set having randomly generated criticalities
ranging from 1-10 for the ICU patients ( data8b, data10b, and data14b ). The future knowledge
model was then applied to each of these six data sets for five different planning horizons (i.e., 1
41
results were used to determine how the different criticality values assigned to ICU patients
influences bed assignment plans.
The results of the application of the future model in this experiment are presented in
tables 4-9, which show that the number of patients admitted was the same for every period in
each data set (See columns “# Admit” in tables 4-9). The differing criticality values did not
have an effect on the number of patients admitted or on the types (Pn vs PT) of patients admitted
into the unit.
Table 3: Data Sets used for Comparing Different Assigned Criticality Values for PT Patients
the columns display the following information PA (admitted): Patients assigned a bed in the unit
PN (admitted): Patients seeking a bed in the unit during period 1 PT (admitted): Patients in the ICU seeking a bed in period 2 or later
Beds Open: The number of beds unassigned in the unit before period 1 PA(admitted) PN(seeking) PT (ICU) Beds Open
data8 18 4 18 8
data 10 19 3 18 7
42
Table 4: Data Set 8a Results Using Assigned Criticality (1-10)
the columns display the following information
H: (planning horizon): number of periods planned for Obj: the objective value function
Data: the label for the data set used
Period: the specific period in the planning horizon
# admit: the number and type of patients admitted each period admitted # int movements: the number of internal movements that occurred during each period Assigned Crit: the criticality values assigned for the ICU patients
H (planning
horizon) obj Data Period # Admit # int mov
Assigned Crit
1 118.405 8 1 4 (PN) 2 (1-10)
8 1 4 (PN) 3 (1-10)
8 2 4 (PT) 2 (1-10)
8 1 4 (PN) 3 (1-10)
8 2 4 (PT) 2 (1-10)
8 3 0 0 (1-10)
8 1 4 (PN) 3 (1-10)
8 2 4 (PT) 2 (1-10)
8 3 0 0 (1-10)
8 4 0 0 (1-10)
8 1 4 (PN) 3 (1-10)
8 2 4 (PT) 2 (1-10)
8 3 0 0 (1-10)
8 4 0 0 (1-10)
8 5 0 0 (1-10)
2
3
4
119.671
120.089
120.445