Abstract: Sorting of fruit into different grade is essential to fetch high price in the market. The fruits are graded based on height, size, area and weight. Each and every fruit changes the skin’s color in their life span. Hence, it is appropriate to grade them by processing color images of them and then applying estimation or recognition techniques on those images. Citrus (plant) grows even in temperature lands and it does not penetrate its root too deep. It is a precious commodity and used for various day to day activities. In this paper, Machine vision technique is used to sort citrus based on variety and quality. Primarily, the image is captured by a camera, placed at a particular distance. Then captured citrus image is classified into different categories, based on their color, size and quality. During the processing, the attributes are determined based on their defects in the surface of the citrus. Finally, the quality and breed are determined based on the three-color planes of color image and gray scale image respectively.
Keywords: Machine vision, Machine learning, Citrus, Unsupervised Algorithm, Classification
I. INTRODUCTION
The Citrus Limon is a species of evergreen tree in the plant family ‘Rutaceae’, native to Asia. The most vital fruit crops in the tropical and subtropical regions in the world. In terms of international trade, Citrus fruits are having the highest-value among the fruit crops. The two main markets for citrus fruit are: 1. Fresh citrus market and 2. Processed citrus market. Corresponding to suit of virtue, the distributors ask for volumes of similar quality and prime of life, the core of the fruits differ even when cultivated at the same place and duration. The difference in category, place and climatic conditions will form the basis of having a lot number of varieties of fruits. This has got very good chances to transship in the market overseas in any form. Moreover, this industry also provides support to the cultivators and also to people involved in distribution and commerce. There are certain essentials that are to be taken good care of, including the way it is been processed, confined, moved and graded. Thus, grading becomes very vital.
Estimating the features like size and shape of citrus using
Revised Manuscript Received on August 05, 2019
Sugumar D, Department of ECE, Karunya Institute of Technology and Sciences, Coimbatore-641114.
Harshavarthan V, Department of ECE, Karunya Institute of Technology and Sciences, Coimbatore-641114.
Kavisri S, Department of ECE, Karunya Institute of Technology and Sciences, Coimbatore-641114.
Aezhisai Vallavi M.S, Department of Mech, Government College of Technology-Coimbatore-641013
Vanathi P.T Department of ECE, PSG College of Technology, Coimbatore-641004.
image processing techniques for Automatic Grading, was implemented by S. M. Iqbal, et. Al [7]. Many modest approaches have been developed for obtaining the size and shape of fruits like sweet-lime and orange. Correspondingly, there were few methods proposed to calculate the region properties of lemon such as area, perimeter, etc. Automated Fruit Grading System, implemented by Mohammed A. H. Ali et al in 2017. They modeled the grading scheme, mainly grounded on the quality of the surface defect and decay. Here, they also included other parameters like size, shape and etc.
Primarily, automated machine vision-based fruit sorting and grading was implemented by C. S. Nandi et. al. Similarly, ripeness and grading of tomato is proposed by Ruchita R et al. and they have implemented image analysis on Raspberry Pi. To fix the ripeness scale for the fruit, firstly, they have estimated the size and shape then they have detected the grading by estimating the defects of tomato. They have formulated the color detection algorithm for classifying tomato in to three classes. They have demonstrated that the system was able to accurately determine the ripeness of tomato.
From this literature survey it is inferred that manual vision technique by experienced human often results in lack of objectivity, accuracy and stability. To overcome this, machine vision-based technique equipped with machine learning is proposed for classification and grading. We learned about the step by step process to classify and grade a fruit (1) Image acquisition, (2) Pre-processing, (3) Segmentation of defected regions, (4) Feature extraction (5) Ground truth, (5) Classification using proposed algorithms.
II. METHODOLOGY
The proposed method is based on computer vision techniques, which is used to grade citrus based on category, maturity and quality. The main objective is to identify the good and super quality citrus. Hence, those can be used for export purpose. Camera is used to capture the citrus images with uniform background, in which citrus should be placed at constant distance from the camera. Then, various pre-processing methods are implied on the image, so that feature can be extracted in an effective way.
Each variety of citrus has its own features, hence different attributes such as height, width, area, perimeter, eccentricity, centroid, magnitude, and phase of Fourier description is used to categorize the citrus.
Height: Base to top measurement of the citrus. Width: Side to side measurement of the citrus. Area: Two-dimensional shape
in the plane.
Citrus Classification and Grading Using
Machine Learning Algorithms
Centroid: Centre of mass of a geometric object of uniform density.
Eccentricity: Ratio of the distance between the foci of the ellipse and its major axis length.
Perimeter: Continuous line forming the boundary of a closed geometrical figure.
[image:2.595.352.498.94.196.2]Magnitude & Phase of Fourier descriptor (FD): way of encoding the shape of a 2-D object by taking the Fourier transform.
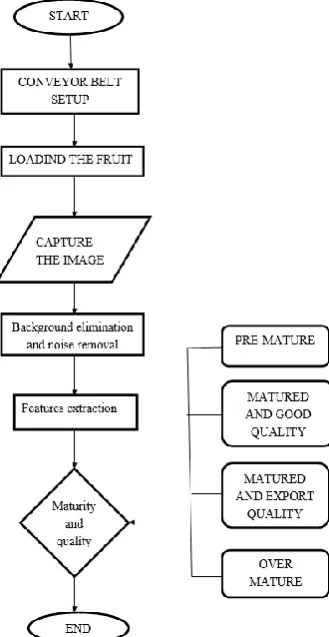
Fig 1 Block Diagram of Citrus Classification
Fig 2 Flow chart of Citrus Classification
III. DATASETS
The dataset consists of two categories citrus namely PKM and Local variety. In each case 300 samples in each were taken for training the model. For testing 25 samples in each were used. The samples are pre-processed by converting into grayscale/ black and white images and their region properties such as major axis length, minor axis length, area and perimeter are calculated. Among these the area parameter is taken to classify the type of the citrus variety. Second level of classification is done by calculating the yellow, green, brown
and black colored pixels separately and classifying the maturity of the fruit by the respective pixel area. For all the three-level classification, KNN classifier is used.
[image:2.595.64.272.166.273.2]Fig 3 Samples of PKM and their grayscale
Table I Attributes of PKM (First 10 samples only) S.
No
Major Axis
Minor
Axis Area Perimeter 1 77.572 66.012 4016 223.602
2 91.837 77.147 5558 264.688
3 87.057 75.519 5159 254.21
4 70.314 60.439 3319 204.439
5 75.913 63.335 3774 216.68
6 88.045 76.637 5295 259.387
7 124.21 89.261 8724 337.664
8 123.21
3 114.40 1105
3 374.285
9 117.65
5 85.695 7678 434.452
10 131.16
9 98.217 1011
1 359.844
[image:2.595.333.525.222.580.2]Fig 4 Samples of Local and their grayscale Table II Attributes of Local
(First 10 samples only)
S. No
Major Axis
Minor Axis Area Perimeter
1 135.48 124.02 1316
9
417.65
2 140.33 130.38 1435
5
426.94
3 152.57 149.28 1779
9
488.48
4 171.37 132.37 1433
2
[image:2.595.87.252.307.626.2] [image:2.595.326.554.610.830.2]5 143.79 129.13 1450
5
445.98
6 162.21 149.58 1904
5
498.75
7 146.17 132.60 1519
6
451.57
8 155.16 144.11 1753
4
476.18
9 153.43 145.15 1746
2
474.05
10 162.15 150.28 1913
1
[image:3.595.67.274.49.203.2]493.84 The major/minor axis length of Local is more when compared to the PKM variety. If the major/minor axis lies around 150/140 then the variety is Local, if lies around 120/95 then it is PKM. It means that the area is higher, then the variety is found to be Local. If the area is smaller, then the variety is PKM. If the area is around 17000 then the variety is Local, and if the area is around 9000 then the variety is PKM. The perimeter is higher (470) then the variety is Local. If the perimeter is small around 340 then the variety is PKM. These parameters help in classifying the fruit accurately. For level 1 classification (i.e. breed) the mean value of the all the size parameters were computed and shown in Table 3.
TABLE III MEAN VALUE OF THE PARAMETERS (LEVEL 1 GROUND TRUTH)
PARAMETERS PKM LOCAL
MAJOR AXIS 119.59 153.46
MINOR AXIS 95.99 140.79
AREA 9375.94 17009.33
PERIMETER 342.24 471.50
For level 2 classification (i.e. Quality), the mean values of color components were computed and shown in Table 4 for PKM and in Table 5 for Local.
Table IV Mean Value of color components for PKM (Level 2 Ground truth)
Type YELLOW GREEN BROWN
GOOD 4794.85 1638.61 284.28
BAD 2434.66 55.8 4633.93
Table V Mean Value of color components for Local (Level 2 Ground truth)
Type GREEN BROWN
GOOD 17168.41 1167.25
BAD 1882.73 14649.73
For level 3 classification (i.e. Maturity), the mean values of color components were computed and shown in Table 6 for PKM and in Table 7 for Local.
Table VI Mean Value Of Color Components For PKM (Level 3 Ground Truth)
Type YELLOW GREEN BROWN
RIPE 5946.06 160.73 391.46
RAW 1916.83 5333.33 16.33
[image:3.595.317.540.49.96.2]ROTTEN 2434.66 55.8 4633.93
Table VII Mean Value of color components for Local (Level 3 Ground truth)
Type GREEN BROWN
RAW 17168.41 1167.25
ROTTEN 1882.73 14649.73
IV. CLASSIFICATION
This section provides the method that is singled out of classification of multiple varieties of cultivated citrus. The algorithm categorizes using Multi Attribute Decision Making (MADM) based on the parameters like height, weight, eccentricity, perimeter, area, magnitude, etc. These attributes help in classifying the fruits in a very effective manner. Having considered the attributes like area and perimeter, the size of the fruit can be determined.
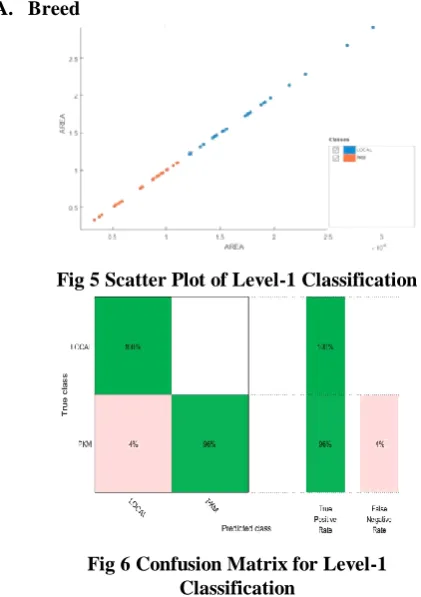
A. Breed
[image:3.595.308.519.247.546.2]Fig 5 Scatter Plot of Level-1 Classification
Fig 6 Confusion Matrix for Level-1 Classification
[image:3.595.79.262.356.441.2]Fig 7 ROC Curve for Level-1 Classification B. Quality
According to the quality, it is been classified into two varieties namely good and bad for both breeds. Defects in the citrus image are compared with the reference image to find the percentage of defects in the citrus, by which the quality can be found. The reference image is the perfect citrus image of that particular citrus variety. Good citrus will be of splendid features. Finally, poor class of citrus will have lacking specifications in almost all the features.
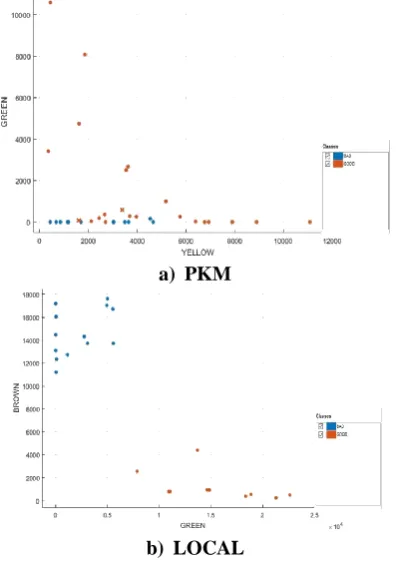
a) PKM
b) LOCAL
Fig 8 Scatter Plot Of Level-2 Classification (Quality)
a) PKM
[image:4.595.71.270.345.626.2]b) LOCAL
Fig 9 Confusion Matrix For Level-2 Classification (Quality)
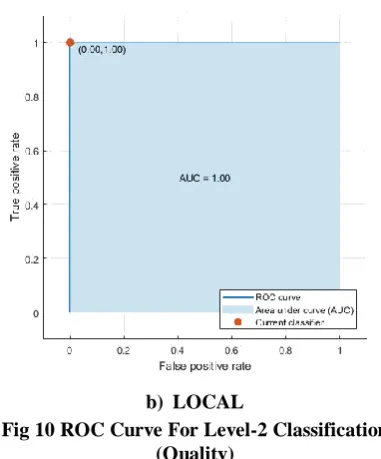
The above figure 8 a & b provides the information regarding level-2 classification (quality) of both PKM (Green Vs Yellow plot) and Local (Brown vs Green plot) varieties. Each legend color represents each classified fruit ORENGE -good and BLUE- bad of both varieties. From the Confusion matrix, it is inferred that Local breed were 100% successfully classified whereas the PKM were classified with false negative rate 13% and the ROC with AUC of 0.93 and .00 for PKM and Local respectively.
b) LOCAL
Fig 10 ROC Curve For Level-2 Classification (Quality)
C. Maturity
Third level of classification will be based on maturity, ripe or raw. Generally, all the fruits required about 45 to 60 days to mature after flowering. The maturity of the fruit can also indicate by building of shoulders and near the stalk there will be a light sink. Color of the ripened citrus changes from dark green to pale green to yellow develops on the fruit shoulders.Fully ripe citrus doesn’t last long and hence can’t be exported and also birds can also damage ripened citrus too, in order to avoid wastage of citrus, as soon as the citrus matures the gardeners picks the fruits, and don’t let citrus to ripe fully. But if the citrus is not ripe, the pulp, juices and sugars inside the fruit will not be developed completely.
a) PKM
b) LOCAL
Fig 11 Scatter Plot of Level-3 Classification (Maturity)
a) PKM
[image:5.595.307.541.49.394.2]b) LOCAL
Fig 12 Confusion Matrix for Level-3 Classification (Maturity)
a) PKM
b) LOCAL
Similar to level 2, the level 3 classification are obtained. The above figure 11 a & b provides the information regarding level-3 classification (maturity) of both PKM (Green Vs Yellow plot) and Local (Brown vs Green plot) varieties. Each legend color represents each classified fruit BLUE- Raw ORENGE -Ripe and YELLOW- Rotten of PKM variety, BLUE- Rotten and ORENGE – Raw of Local variety. From the Confusion matrix, it is inferred that Local breed were 100% successfully classified in to raw and rotten. But the PKM were classified with false negative rate 13% for rotten class and the ROC with AUC of 0.93 and 1.00 for PKM and Local respectively.
V. CONCLUSION
In this paper, the citrus classification and grading system was developed and proposed. On the captured image of the citrus, various image pre-processed techniques were applied to extract the features. Finally based on the feature extracted, citrus is classified into PKM (used in households) and Local (Narthangai) and then the maturity of the citrus is calculated based on the mean value of the green and yellow color component in the image. The quality of the classified citrus is identified and the results are displayed. Results have shown that the citrus grading algorithm is designed viable and accurate.
REFERENCES
1. Chandra Sekhar Nandi, Bipan Tudu and Chiranjib Koley,” A Machine
Vision Technique for Grading of Harvested Mangoes based on Maturity and Quality”, in IEEE Journal on Sensors in 2016.
2. Krishna Singh, lndra Gupta, Roorkee Uttrakhand, Sangeeta Gupta,
“International Journal of Signal Processing, Image Processing and Pattern Recognition, SVM-BDT PNN and Fourier Moment Technique for Classification of Leaf Shape”, in December 2010.
3. Mohammed A. H. Ali and Kelvin Wong Thai, “Automated Fruit
Grading System”, IEEE 3rd International Journal on Robotics and Manufacturing Automation (ROMA) in 2017.
4. Vinay Kumar, Binod Kumar vimai, Rakesh Kumar, Rakesh Kumar and
Mukesh Kumar, “Determination of soil ph by using digital image processing technique”, Journal of Applied and Natural Science in 2014.
5. Chandra Sekhar Nandi, Bipan Tudu and Chiranjib Koley “An
Automated Machine Vision Based System for Fruit Sorting and Grading”, Sixth International Conference on Sensing Technology (ICST) in 2012.
6. Ruchita R. Mhaski, P.B. Chopade and M.P. Dale, “Determination of
Ripeness and Grading of Tomato using Image Analysis on Raspberry Pi”, International Conference on Communication, Control and Intelligent Systems (CCIS) in 2015.
7. S. Md. Iqbal, P.E. Sankaranarayanan, A. Gopal and Athira B. Nair, “Estimation of Size and Shape of Citrus Fruits Using Image Processing for Automatic Grading”, 3rd International Conference on Signal Processing, Communication and Networking (ICSCN) in 2015.
8. Seema, A. Kumar and G. S. Gill,” Automatic Fruit Grading and
Classification System Using Computer Vision”, Second International Conference on Advances in Computing and Communication Engineering in 2015.
9. Q. Li and S. Ren,“A real-time visual inspection system for discrete surface defects of rail heads”, IEEE Trans. Instrument Measurement in Aug. 2019.
10. Y. Li, Y. F. Li, Q. L. Wang, D. Xu, and M. Tan, “Measurement and
detect detection or the weld bead based on online vision inspection”, IEEE Trans. &strum. Measurement in Jul 2010.
11. J. K. Sainis, V. K. Chadda and R. Rastogi, “Applications of image processing in biology and agriculture”, Electronics Systems Division.
12. Mahendran R*, Jayashree GC and Alagusundaram K “Application of
Computer Vision Technique on Sorting and Grading of Fruits and
Vegetables”, Indian Institute of Crop Processing Technology, Ministry of Food Processing Industries, GOI Pudukkottai Road, Thanjavur 613 005, Tamil Nadu, India.
AUTHORSPROFILE
Dr. D. Sugumar has received B.E degree in Electronics and
Communication Engineering (2002), M.E degree in
Communication Systems (2007) and PhD in Multivariate and multidimensional blind source separation using IVA from Anna University in 2019. His research interest is Signal Processing for communication, RF designs and Antennas.
Harshavarthan V is pursuing B.Tech final year in Electronics and Communication Engineering in Karunya Institute of Technology and Sciences, Coimbatore. He is passionate about coding and interested in learning cutting edge technologies.
Kavisri S pursuing her B.Tech final year in Electronics and Communication Engineering in Karunya Institute of Technology and Sciences, Coimbatore. She is interested in Machine learning and AI.
Dr. M.S. Aezhisai Vallavi received her Bachelor of Engineering in Mechanical Engineering (2004), post-graduation in CAD/CAM (2006) and PhD (2017) in Machining of Composite Material from Anna University. She secured 3rd Rank in M.E from Anna University. Her areas of interest are Material Science and Metal Matrix Composites.