Analysis of the cause of the defect packaging of
capsule products using six sigma:
A
case study
(PT SM)
FinsariaFidiyanti1,*, and NovieSusanto1
1Department of Industrial Engineering, Diponegoro University, Jl. Prof. Soedarto, S.H., Tembalang, Semarang, Indonesia 50275
Abstract. This research aims to manage the amount of defective packaging of capsule products in the department of capsule product at PT SM. It is important because the number of defective packaging of capsule products is high and exceeds the limits of maximum, i.e. 5% of the total production. In addition, the defective packaging of capsule products cannot be reworked and will cause losses in terms of time and finances. This research uses the Six Sigma method to find out the capabilities of the production process from the defective packaging of capsule products. Application of the method of Six Sigma through DMAIC process to eliminate the number of defective products and Fishbone diagram is used to identify the cause of the defect and provide recommendations on improvements to the production process. The data for this research is the amount of production, defective packaging of capsule products and interviews with the department of quality control, department of capsule product and operator. Data processing using Six Sigma methods showed that the value of sigma is 3.41σ with the number of DPMO is 27,951.202. Using Fishbone diagram, there are 9 causes of the defective packaging of capsule products.
1 Introduction
The industrialized world has grown very rapidly. This is due to the needs of the society of a product improved in terms of quality as well as quantity supported by rapid advances in technology. With a large number of those needs, new industries have emerged that resulted in the onset of competition in the industrialized world, including the herbal industry.
PT SM is a company engaged in the field of herbal medicine processing since 1940 and has certification that is equivalent to pharmacy standardization. Although it has become one of the largest herbal medicine company in Indonesia, PT SM has problems such as the large number of quality defects. A large number of defects that arise can affect productivity and losses both in terms of financial and time.
From the observations, the number of defects occurred in the department of capsule product section packaging. The number of defective packaging of capsule products exceeded the maximum i.e. 5% of the total production. In addition, the packaging product cannot be reworked so that it will cause losses in terms of time and finances. A large number of defective packaging of capsule products caused by the quality control not yet implemented properly. The company just did on logging the number and types of defects without identifying the defect causes even further. Therefore, it is necessary to improve quality control by minimizing the number of defective packaging of capsule products.
Thus, on the basis of the problem which is owned by the PT SM, this study aims to manage the process of quality control of packaging of capsule products by identifying the types and causes of disability. In addition, this research will also provide recommendations for improvements to manage the amount of defective packaging of capsule products.
This research uses the method of Six Sigma through DMAIC process (Define, Measure, Analyze, Improve and Control) and Fishbone Diagram. Six Sigma method is used to find process capability [1] on the department of capsule product section packaging, while Diagram Fishbone used to find out the causes of defects in the packaging of capsule products. The method of Six Sigma through DMAIC process has been used in previous studies. One of those researches is the research of Prabu Kolochi, Makesh, J K Naveen Raj, S.R. Devadasan & r. Murugesh in 2013 that use methods of Six Sigma through DMAIC process to find out the casing stage on the production of small and medium pumps [2]. This research was undertaken with the experimental design in the form of observations to obtained values of sigma 3.90σ. Other research is Kumar et al (2008) use the same method to improve customer [3] and Rohini and Mallikarjun (2011) that uses the DMAIC process in the healthcare industry in India [4]. It is illustrated that the method of Six Sigma through DMAIC process has a very broad implementation in various fields. Six Sigma method is performed to find out the sigma level of the production process of packaging of capsule products through the DMAIC process for planning quality control continuously [5] in order to achieve zero defects.
2 Literature Review
2.1 Six Sigma
According to Gasperz, Six Sigma is a quality improvement vision towards the target of 3.4 failures per one million opportunities for every transaction of goods and services products [6]. The goal is to increase the efficiency of business processes by means of emphasizing the removal of errors, removing waste and minimize the rework of defect products in order to increase the customer satisfaction so that the company's value has also increased.
Define
Is the process of identification and determination of priority issues for improving quality of goal setting. This stage consists of problem identification, SIPOC, and CTQ.
Measure
Is the process of identification of product defects mapping, performance measurement process to set goals increase. This stage uses a control chart for identification of any condition of uncontrolled in the process and the calculation of the DPMO and sigma levels. Analyze
The process of analyzing and reviewing the data collected to determine the priority list of the source variation. The instrument used to determine the root cause of the problem is the fishbone diagram.
Improvement
Stage of the improve process by removing the cause of the defect. This stage is done by making changes to achieve increased quality towards zero defects.
Control
Stage to ensure the control is done well underway and continuous, also prevent the occurrence of the failure. This stage is done with documentation and dissemination of successful procedures as the standard guidelines.
3 Research Methodology
The data processing on this research using a quantitative approach, so that needs to calculate of adequacy test, uniformity test and normality test of the data obtained. Adequacy test is used to ensure that data that has been collected is quite objectively. This test is performed by comparing N ' and N where N’ was obtained from calculation. If N’ ≤ N, the data is considered sufficient. Uniformity test is used to ensure the uniformity of the data collected comes from the same system. This test is performed by calculating the upper limit and lower limit. If the data contained in both the limit, the data is considered uniform. Normality test used to assess the distribution of the data on a group of data. This test using SPPS software. If KS < 0.235 or P-value > 0.05, the data is considered to be normally distributed. If the data is sufficient, uniform, and normal, then performed the data processing by using the method of Six Sigma DMAIC process. On DMAIC process, using SIPOC diagram on stage define, u control chart on stage measure and fishbone diagram on analyzing phases.
4 Result and Discussion
DMAIC Process
4.1 Define
4.1.1 Problem Identification
4.1.2 Identification of Key Process (SIPOC)
Figure 1 shows the SIPOC diagram of the packaging process of capsule product.
Fig. 1.SIPOC Diagram of the Packaging Process of Capsule Product
4.1.3 Identification of Critical to Quality (CTQ)
CTQ (Critical to Quality) is a key quality characteristic and it is directly related to the specific needs of the customer. From the results of the interview with the department of quality control, department of capsule product and operator, gained 3 types of defects that often occur, they are:
1) Image Position Won't Fit (image not printed in the right position) 2) Shaded Results (there is a shadow on the image)
3) Color does not match (color image does not suitable to the standard)
4.2 Measure
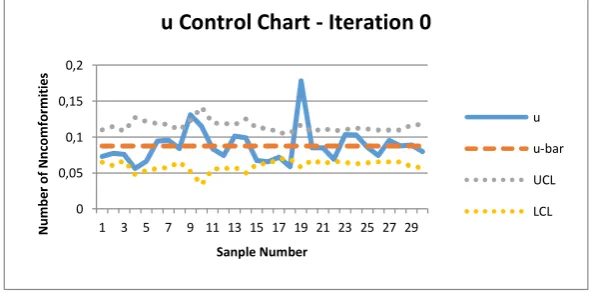
4.2.1 u Control Chart
[image:4.595.148.444.525.671.2]Iteration 0
Figure 2 illustrates the results of the u control chart in iteration 0, there are 3 data that is out of control and need for elimination.
Fig. 2.u Control Chart –Iteration 0
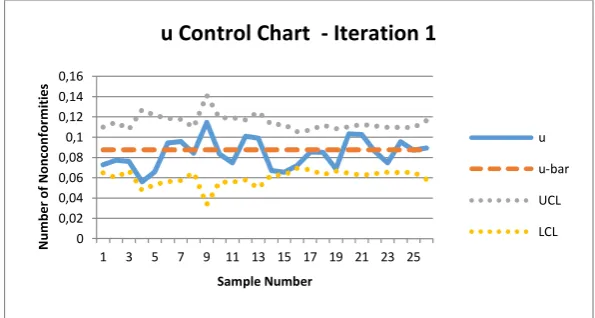
Iteration 1
Figure 3 illustrates the results of the u control chart in iteration 1, all data in control. 0
0,05 0,1 0,15 0,2
1 3 5 7 9 11 13 15 17 19 21 23 25 27 29
Sanple Number
u Control Chart - Iteration 0
u u-bar
Fig. 3.u Control Chart –Iteration 1
4.2.2 Measurement of the level of DPMO and Sigma Levels
Determination of Value of Sigma Period
TOP (Total Opportunities) = Total product produced x Number of CTQ = 1542 x 3 = 4626
DPO (Defect Per Opportunities) = = = 0,024 probability of defect for one occurence
DPMO = DPO x 106= 0,024 x 106= 24211
Sigma Period = NORMSINV((1000000-DPMO)/1000000)+1,5 = 3,47 Determination of Value of Sigma Process
TOP (Total Opportunities) = 37160 x 3 = 111.480
DPO = = 0,028 probability of defect for one occurence
DPMO = 0,028 x 106= 27951,202
Sigma Period = NORMSINV((1000000-DPMO)/1000000)+1,5 = 3,41 Figure 4 and Figure 5 shows the diagram of comparison of sigma value and diagram of comparison of DMPO value.
Fig. 4.Diagram of Comparison of Sigma Value 0
0,02 0,04 0,06 0,08 0,1 0,12 0,14 0,16
1 3 5 7 9 11 13 15 17 19 21 23 25
Sample Number
u Control Chart - Iteration 1
u
u-bar UCL
LCL
2,7 2,8 2,93 3,1 3,2 3,3 3,4 3,5 3,6 3,7
1 3 5 7 9 11 13 15 17 19 21 23 25 27 29
Period
Comparison of Sigma Value
Sigma Period
[image:5.595.158.441.515.658.2]Fig. 5.Diagram of Comparison of DPMO Value
Sigma level from the calculation is 3.41 σ.
4.3 Analyze
4.3.1 Increasing Sigma Value
It is assumed, every period (30 days) the company should be able to increase the value of sigma of 0.1 to achieve the value of 4σ.
Increasing sigma (%) = = = 14,75%
DPMO to be achieved is 6209.72, then:
Decreasing DPMO (%) = =
[image:6.595.60.539.481.642.2]= 77,78%
Table 1.Recapitulation of Sigma and DPMO Value.
Period Number of Units
Sigma
value CTQ DPMO DPO TOP
Number of Defects
1 37160 3.41 3 27951.202 0.02795 126716 3542
2 37160 3.508 3 24328 0.02433 130370 3172
3 37160 3.607 3 20704 0.02070 134024 2775
4 37160 3.705 3 17080 0.01708 137678 2352
5 37160 3.803 3 13457 0.01346 141332 1902
6 37160 3.902 3 9833 0.00983 144986 1426
7 37160 4.000 3 6209.72 0.00621 148640 923
From the table, it can be targeted within ± 7 months to reach 4σ.
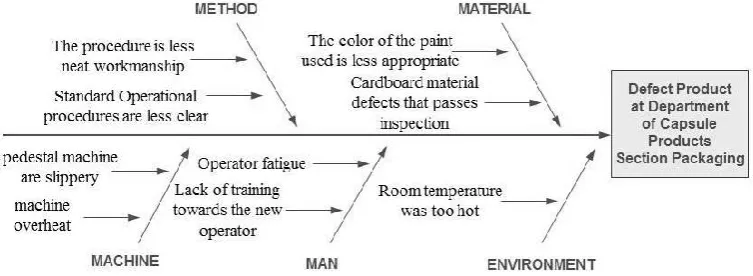
4.3.2 Fishbone Diagram
Figure 6 shows root and cause of the defective packaging of capsule products using fishbone diagram.
0 10000 20000 30000 40000 50000 60000 70000
1 3 5 7 9 11 13 15 17 19 21 23 25 27 29
Period
Comparison of DPMO Value
DPMO Period
Fig. 6.Fishbone Diagram of the Defective Packaging of Capsule Products
4.4 Improvement
Some of the proposed improvements that can be made:
1) Make of Standard Operational Procedure clearly and detail for each process to minimize defect products and reduce the occurrence of waste material.
2) Conducts an inspection of the color of the paint prior to the printing process.
3) Tighten the inspection on quality control department in order for the defect cardboard material that is obtained from suppliers can not enter the production process.
4) Replace the base printing engine with a textured base so it can not change the position of the cardboard when the process of printing.
5) Checked the temperature of the machine periodically to avoid overheat engine when the printing process.
6) Additional of rest period into 45-60 minutes to reduce the level of tiredness on workers. 7) Conduct training for the operator to equate the capabilities of operators as well as
provide knowledge in accordance with standard procedure.
8) Provides additional air conditioner in order to make the room cooler and accelerated the drying process of results printing.
5 Conclusion
From the research, the problem is the number of the defective packaging of capsule products exceeded the maximum i.e. 5% of the total production and cannot be reworked so that it will cause losses in terms of time and finances. To improve the quality of the product, quality control and quality improvement are required. Using Six Sigma, it is found that the actual sigma value is 3.41σ. It needs to improve sigma for improvement of product quality. Sigma improvement needs +/– 7 months to reach 4σ.Some problems that happened are image position won’t fit, shaded result and color do not match. Some of the recommendations that can be given are make of Standard Operational Procedure clearly and detail, tighten the inspection of materials, replacement of the base printing machine with a textured base, checked the temperature of the engine periodically to avoid engine overheat, addition of a rest period into 45-60 minutes, conduct training for operators and provide additional air conditioner.
References
2. P. Kolochi, J. Makesh, K. N. Raj, S.R. Devadasan, R. Murugesh, Int. J. of Process Managem. and Benchmarking, 3, 386 (2013)
3. S. Kumar, M. Sosnoski, Int. J. of Productivity and Performance Managem., 58, 254 (2009)
4. R. Rohini, J. Mallikarjun, Procedia –Social and Behavioral Sci., 25, 273 (2011) 5. P. S. Pande, R. P. Neumann, R. R. Cavanagh, The Six Sigma Way Bagaimana GE,
Motorola & Perusahaan Terkenal Lainnya Mengasah Kinerja Mereka. Yogyakarta, Indonesia: ANDI (2002)
6. V. Gasperz, Total Quality Management. Jakarta, Indonesia: Gramedia Pustaka Utama (2005)
7. Kementerian Perindustrian Republik Indonesia. Industri Jamu Tumbuh 10 Persen dan
Serap 15 Juta Orang. Retrieved from
http://www.kemenperin.go.id/artikel/17906/Industri-Jamu-Tumbuh-10-Persen-dan-Serap-15-Juta-Orang(2017)