International Journal of Innovative Technology and Exploring Engineering (IJITEE) ISSN: 2278-3075, Volume-8 Issue-6S, April 2019
Abstract: Water is the most important substance on the earth and its conservation is the need of the hour. If there were no water, there would be no life on earth. Apart from drinking it to survive there are abundant, other industrial environmental, economical sustainability persists because of prominent use water. Consumption of water is a major challenge in the modern distribution plants. Very accurate measurements are required in order to safeguard the water if not it leads to major loss not only in terms of money but also the energy. If these calculations are manual then there is a high chance of miss calculation, which has drastic effect. WHO states that more than 840 million people lack even a basic drinking water facility and nearly 160 million people are depending on surface water. By their analysis, they predicted that by the end of 2025 half of the world’s population would be living in after stressed areas. In this paper a hardware equipped hybrid water conservation and monitoring system is discussed which will monitor and forecast the water usage of a particular house. Here we use various sensors for water level and to calculate the rate of flow of water in a tank and data is dispatched and after receiving the values from the sensors, the prediction and forecasting are done using various algorithms like SVM, RFC and on this basis; the monthly or yearly consumption is calculated. Wireless Sensor technology is used to avoid the massive wastage of water, which is caused main due to uncontrolled use of water in huge apartments/offices.
Index Terms: RFC (Random Forest Classifier), SVM (Support Vector Machine), WHO (World health Organization), Flow sensor, water monitoring.
I. INTRODUCTION
Water is the essential resource for any country’s growth. It is imperative to conserve water and use it productively. Due to the expanding population, growing agriculture, rising industrialisation scenario, the demand for water has undoubtedly increased over the years. Even though the efforts are being made by building, numerous number of wells, reservoirs and dams there is still a long way to go.
1. 71% of the earth is covered in water and out of this ninety-seven percent of all water is salt water, which is actually not suitable for drinking.[1]
Revised Manuscript Received on December 22, 2018.
John Livingston, Computer Science Department, Karunya Institute of Technology and Sciences, Coimbatore, India.
M Raj Sandeep Simeon, Computer Science Department, Karunya Institute of Technology and Sciences, Coimbatore, India.
Bommi Vikas, Computer Science Department, Karunya Institute of Technology and Sciences, Coimbatore, India.
P Hari Chandan, Computer Science Department, Karunya Institute of Technology and Sciences, Coimbatore, India.
2. Only 3% of water on Earth is freshwater, and only 0.5% is available for drinking.[1]
3. The other 2.5% of freshwater is completely locked in ice caps, glaciers, atmosphere, soil, or under the earth's surface, or is too polluted for consumption. With the increase in population and having such, a small percentage of all the water on Earth fit for Consumption we must preserve and conserve the water resource as much as possible.
A. Sources of water resources:
Water resources are natural resources of water that are potentially useful. Uses of water include agricultural, industrial, household, recreational and environmental activities. All living things require water to grow and reproduce.
B. Ground water:
It is actually the freshwater present deep inside the surface space of rocks. Sometimes it is useful to make a partition between groundwater near the surface water and deep groundwater in an aquifer.
Frozen water: Glaciers are converted into surface water after the runoff and there are several schemes which had been proposed to convert icebergs into sustainable drinking water but still this is been done for research purpose.[2]
Water usages – personal household, Industry, water scarcity
The most common water uses include: a. Drinking and Household Needs. b. Recreation.
c. Industry and Commerce. d. Agriculture.
e. Thermoelectricity/Energy /Environment.
A. Agriculture:According to the recent estimations, 70% of water globally is used for irrigation out of which nearly 30% is unsustainable. According to water resources – Wikipedia.org to produce the food for the present day population it requires a deep canal, which is of 100 meters wide and 10 depth and should be as long as 2100 kilometres long. More than 2,000 litres of water is taken to produce enough food to satisfy one person's daily dietary need.[3]
B. Industries: The world industries are using 22% of the water currently. Water is widely used as solvent in manufacturing departments and it is used in renewable power generation.
A Hybrid Approach for Water Utilization in Smart
Cities Using Machine Learning Techniques
The electricity produced in such a way is of less cost and non-polluting because the hydroelectric power plant is supplied by the sun .Heat from the sun evaporates water, which condenses as rain in higher altitudes and flows.
C. Domestic use [household]: According to recent calculation, 8% water throughout the globe is for domestic purposes. Each person require at least 50liters per day. The developed countries, which has adequate water resources use drinking water even for domestic use where as people are not even having water pipe connections in some part of the world.
D. Need for water conservation: The practise of reducing the unnecessary water usage is called as water conservation and according to the fresh water watch, fresh water is a limited resource and so water conservation is the need of the hour. As the house owners, we all know the costly maintenance of the inefficient water usage. So water conservation is very important and is critical for the environment and also our wallets.[6]
II. LITERATUREREVIEW
SCADA network Supervisory Control and Data Acquisition (SCADA)
These systems are actually intended to fetch field information and transfer it to a primary computer facility and display the information to the operator using visualisation tools or textually thereby allows the user to monitor or control an entire system.
SCADA can:
1) Turn devices on or off 2) Display real time data
3) Provide the system wide views of operation 4) Trend data and alarms
SCADA consists of both hardware and software. First SCADA system for equitable water distribution commenced in DELHI - which has a good amount of Non-revenue water (40-50%) and the reduction was one of the major issues to be addressed for efficient usage of drinking water. Workstations can be clients to SCADA Servers across a local-area or wide-area Ethernet network. SCADA
Software also supports redundant configurations for maximum system availability. And the workstation can become the system programming terminal for both local and remote stations. It provides an accurate view of data across a wide variety of client devices with various screen sizes and resolutions.[4]
i) Monitoring and Controlling Tap Water Flow at Homes
Using Android Mobile Application
Kuganesan kumar et al, gives an idea on automatic water monitoring, normally the users are busy with their daily schedule and they might forgot to switch on/off a tap. So that they developed, an online application, which is useful to controlling and monitoring the house water flow and controlling water tap by using the graphical user interface.[5]
ii) Implementation of a novel SCADA architecture for a 210 MW Thermal Power Plant
Jerry Daniel j et al, had proposed an approach about Implementation of SCADA architecture, SCADA is called as Supervisory control and data acquisition system of software and hardware. This system will control and monitor any process from remote locations and gathers the real time data. [4]
iii) Cost effective model for Real Time Water Quality Monitoring and Controlling
S Nagaraju et al, discussed an approach for controlling and monitoring water quality using IoT in minimal cost. Majorly 6 to 8 sensors are implemented in this model so it will show quality, moisture level, conductivity, pH, flow etc., later sensor data is stored in cloud and the visualization is done.[6] iv) Smart Water Flow Monitoring and Forecasting system Gaurav Gosavi et al, proposed the idea where monitoring and forecasting of a household domestic water usage is done by using few sensor and it will visualizes the water flow consumption of each house to users and admin, later it used for paying the monthly usage bill. [7]
v) Machine Learning Algorithms and Their Application in Water Resources Management
Manish Kumar Goyal et al, has an approach in the usage of machine learning algorithms in water management and their applications. These algorithms also useful in solving the problems of water scarcity and their control measures. Manish and his team explained few algorithms with different functionality and specification by using ML. we can easily develop an algorithm, which will make automation of water flow and level according to the user’s previous water flow usage and level.[8]
Random Forest Classifier (RFC)
Random Forest Classifier, which is show in Fig 2.0, is a machine learning calculation, which is used for the prediction of handwritten digits. At first, it randomly selects from the subset of training set and creates a set of decision tree to decide the final object of the test object.
It is a direct execution of learning algorithm. We can judge from the name itself it create forest and makes it somehow random. It is built by using group of decision trees, most of the time trained with the bagging method.
Below you can have a look of how a random forest would look like with two trees. [8]
Fig. 2.0 RFC diagram The best quality of the
random forest algorithm is that it is trouble-free to
International Journal of Innovative Technology and Exploring Engineering (IJITEE) ISSN: 2278-3075, Volume-8 Issue-6S, April 2019
importance on the prediction. Sklearn provides a great tool for this, which measures the features the importance by checking how much the tree nodes feature.
The random forest is a very handy and easy to use algorithm, because its default hyper parameters often produce a good prediction result.
The only problem is that if there are more decision trees then the classifier will not fit the model. Using this sample data, we predict some of the outputs.
Using Cramer V to measure link between categorical variables
Date/Time Variables
Table. I
The table I shows the variables of day and time where it has two entities such as date_record and construction_year, which has various values depending on the values that are collected.
[image:3.595.337.521.50.127.2]
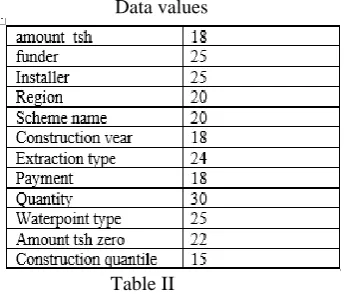
Data values
Table II
Table II depicts the data values and it has categorical variables such as amount, funder, installer, etc. and their values.
Quantity vs values
Table III
The table III shows the quantity vs values data. It has four different quantities and a row for unknown quantities.
Quantity classification
Table IV
The final table (Table IV ) quantity classification, which gives the classified details to measure the link between variables.
III. PROPOSED MODEL AND BLOCK DIAGRAM: An IoT Based water prediction and forecasting model using machine learning for smart cities.
Step 1: Identify the required sensor location for inflow and outflow monitoring and fix the necessary sensors in the give location.
Step 2: calculate inflow and outflow values from the streaming sensor data using dynamic data collection method.
Step 3: The data collected from the sensors will be send to the cloud for further processing and storage.
Ex:Entropy for two classes
E(s) = -p+log2p+ -p-log2p- Where P + is the proportion of examples in the class +
P - is the proportion of examples in the class –From the table data, the first step is to select an attribute and find the entropy for each node. From the entropy values, we need to find the Information value using this we get the information gain value.
The highest gain value will be the root node of the decision tree.
Gain ratio: Modification of the information gain, which reduces the bias,
To choose an attribute it takes the size and number of branches.
Gain_ratio(attribute)=gain(attribute)/(intrinsic_info(att ribute))
We can judge from the name itself it create forest and makes it somehow random. It is built by using group of decision trees. The above mentioned is the process for decision tree. Step 4: Analyze the cloud data using the prediction algorithms like Random Forest Classifier (RFC) and Support Vector machine (SVM). In case of any unknown water wastage, the sensor detects and sends an alert message to user and the admin.
Step 5: Finally, the daily and the monthly water data will be visualized and shown to the user via the mobile application and the user can check the future water predictions on request.
The prime feature of this model is to monitor and forecast the water usage of a particular house. Here we use ultrasonic and water flow sensors for water level and to calculate the rate of flow of water respectively. After getting the values from the sensors the prediction or forecasting is done using various
algorithms like SVM
(support vector machine),
RFC (random forest
[image:3.595.86.260.418.565.2]the monthly or yearly consumption is calculated.
In the hardware part all these sensors are connected to a micro controller and the data/values collected are stored directly in the cloud database. Using these results, we do data visualization and project the water conservation analysis in a household.
In addition to this, the next part is turning this system into a completely automated model where each level of water usage is detected and displayed in the mobile application. This is done to reduce the water wastage and the user gets the alert message of knowing the cost of extra usage per litre if he/she crosses the daily usage. The complete controlling and monitoring of this model is done via the mobile applications and Fig 3.1 depicts the block diagram.
Fig 3.1 Block Diagram
IV. IMPLEMENTATION:
Microcontroller Advantages:
· Inexpensive
· Cross-platform
· Simple and clear programming environment
Water level sensor: It works by identifying some sound waves, which are inaudible by human ear. The maximum length this sensor can sense is 400cm. Its calculate the distance between sensor and the object based on the timing, this sensor is having 4 input which are connected to Micro controller and are used to check the water level at different
conditions The micro controller sends a pulse and receives back the pulse on same pin.
Flow sensor: Currently we are using YFS201 Hall Effect Water Flow Sensor both ½ inch and ¾ inch. By using this it is very simple to find. Water flow. This sensor comes with three wires: Red/VCC (5-24V DC Input), Black/GND and Yellow/OUT (Pulse Output). In this project we are interfacing sensor to Micro controller to find the water flow in different conditions.
Ethernet shield ESP8266: It is also called Wi-Fi module with SOC with integrated TCP/IP protocol stack, it gives Wi-Fi access to any microcontroller.it is useful for uploading applications. In this model we are transferring whole sensor data to cloud for analytics and virtualization.
Relay: It is an electrically operated switch which is used in controlling circuits by a low power signal. It is convenient to drive loads such as 12V relays from simple 5V outputs of the Micro controller or any other microcontrollers by using the 4 - channel relay driver. The user can simply leave the unused channels as such(disconnected)
Automation Valve: The electromechanical device in which the solenoid uses an electric current to produce the magnetic field to operate a particular mechanism, which in turn operates the water flow in a valve and this, is called as solenoid valve. The basic principle to open and close the solenoid is based on the force exerted by the magnetic field on plunger. So finally, this is used to control the flow of liquid in various levels of action.
V.CONNECTION HARDWARE’S DATA TO THE CLOUD:
STEP 1: Interface water flow sensor and water level sensor with Micro controller.
STEP 2: Interface Esp8266 with Micro controller & will enter localhost IP.
STEP 3: Create a mysql database on localhost in phpmyadmin and connect to thinkspeak.com
STEP 4: Write a web service to link database with php script.
STEP 5: Will send sensor data from Esp8266 to web
service, which will insert it into database and finally display result from database on front-end web page.
VI. RESULTSANDANNALYSIS
International Journal of Innovative Technology and Exploring Engineering (IJITEE) ISSN: 2278-3075, Volume-8 Issue-6S, April 2019
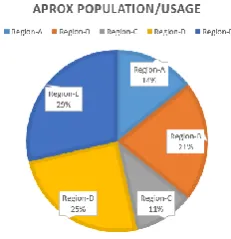
Fig 6.1 Approx. Population / usage
From the Fig 6.1 for the further testing of the experimental model Region-A is taken and there are five houses in this part.
[image:5.595.312.517.54.191.2]Fig. 6.2 gives the bar graph details of the Region-A based upon number of people and the water usage (in litres). As shown below the total number of people in House-A1, A2, A3, A4, A5 are 4, 8, 7, 2, 5 respectively and the water usage for those houses are 400, 600, 900, 310, 750 respectively which are measured in litres. So the total number of people living in Region-A is 26 and their combined daily water usage is 2960 litres.[9]
Fig. 6.2 Region wise household water usage per day [7]
The household water is of two categories domestic and non-domestic usage, which consists of hygiene uses (washing, shower), drinking water, toilet flush, washing machine, kitchen uses and amenities (gardening).
Fig 6.3 depicts four major details such as water usage, reusability, day requirement and monthly projection.
As show in the fig. 6.3 the House-1 has a water usage of 147 litres per day and out of these 50 litres are reused so the total reduced water usage of House-1 will be 147 – 50 which is 97 litres/day. The monthly projection is done by multiplying 97x30, which is 2910 litres per month.
Fig. 6.3 Household water usage
From the Fig. 6.3 electric power and cost is analysed of each house in the Region-1 based on the formula energy = mass x g x height whereas mass is volume x density.
In Fig 6.4 House-1 has 147 litres water input and to find the energy it is calculated as 147 x 9.81 x 5 = 7210.35 J and converting to Kilo Watt Hour gives the result as 0.002KWH per day. This can be projected per month by multiplying it with 30, which gives 0.060KWH.
So the monthly cost is 0.060 which is <1 so the basic cost is ₹20.[10]
[image:5.595.311.515.384.513.2]Fig. 6.4 Power usage and cost analytics of each house
Fig. 6.5 Monthly water usage
VII. CONCLUSION
The above-proposed model is helpful for the monitoring of water in the real time and to
[image:5.595.60.266.412.506.2] [image:5.595.309.532.568.674.2]the water level and the flow is calculated accordingly, there would be a valve, which can autonomously control the on/off operations. This system is cost efficient and highly effective. The hardware (sensors) are connected to the microcontroller, which deals and coordinated the water calculations.
This particular device has a prominent use in the field of water distribution, farming, industrial usage etc., Since the whole system can be controlled through a mobile application we can remotely operate and conserve a lot of water. The future enhancements for this project would be done by equipping the model with high-level advanced sensors, which can even process the minute details.
Here the design and development of low cost system for real time monitoring of water quality and controlling the flow of water is done using IoT. The proposed system consists of sensors for water quality monitoring and a valve for controlling the water flow in the pipeline. This device is low in cost, high efficient and flexible. These are connected to Micro controller core controller and IoT module. Finally, sensed values viewed and controlling is performed by internet and through Wi-Fi to mobile devices.
This system can be used in many fields like water distribution system, industries and aqua farming. This monitoring and controlling process can be performed at anytime and anywhere in the world. In future, we can include advanced sensor for better detection of contaminants in water and can install the system in several locations for high and effective coverage.
REFERENCES
1. [“Central Intelligence Agency(CIA)-Library,” 2019.
2. [D. O. F. Columbia, “Pulitzer Center at EFF : Climate Change, Telling the Human Story,” pp. 1–6, 2019.
3. [“Agriculture.” (https://en.wikipedia.org/wiki/Agriculture)
4. J. J. Daniel et al., “Implementation of a novel SCADA architecture for a 210 MW thermal power plant,” Proc. - 2014 Int. Conf. Data Sci. Eng. ICDSE 2014, pp. 182–187, 2014.
5. K. Kumar, “Monitoring and Controlling Tap Water Flow at Homes Using Android Mobile Application,” Am. J. Softw. Eng. Appl., vol. 6, no. 6, p. 128, 2017.
6. K. Gopavanitha and S. Nagaraju, “A low cost system for real time water quality monitoring and controlling using IoT,” 2017 Int. Conf. Energy, Commun. Data Anal. Soft Comput. ICECDS 2017, pp. 3227–3229, 2018.
7. G. Gosavi, G. Gawde, and G. Gosavi, “Smart water flow monitoring and forecasting system,” RTEICT 2017 - 2nd IEEE Int. Conf. Recent Trends Electron. Inf. Commun. Technol. Proc., vol. 2018–Janua, pp. 1218–1222, 2018.
8. D. H. Burn, “Machine Learning Algorithms and Their Application in Water Resources Management,” pp. 165–178, 2000.
9. A. W. Use, “Average Water Usage,” pp. 2–5, 2019.
[Online Traffic calculator - T A N G E D C O (http://tneb.tnebnet.org/tariff_new.html)
AUTHORSPROFILE
Mr. John Livingston.S, M.Tech.,(Ph.D) is working as a Teaching faculty in department of Computer science and Engineeing Karunya University,Coimbatore, South India. His area of research is Big data analytics, Image analysis and Interpretation. He is also an Assocate member of IEI.
M. Raj Sandeep Simeon is a final year Bachelor of Technology student in the department of Computer Science at Karunya University, Coimbatore, South India. His previous survey paper is D-ARCH: A detailed analysis of drone challenges policy enforcements and
security solutions.
Bommi Vikas is a final year Bachelor of Technology student in the department of Computer Science at Karunya University, Coimbatore, South India. His previous survey paper is D-ARCH: A detailed analysis of drone challenges policy enforcements and security solutions.