Abstract: Risk assessment has become essential tool for construction of project in a safe and secure manner. In this paper, one of the Multi-Criteria Decision-Making (MCDM) method is used i.e. AHP (Analytic Hierarchy Process) to rank the investment alternatives from a risk point of view, by taking into consideration the preferences of the investor or decision maker. The proposed approach not only involve identification of potential risks but also analyze the risks and mitigate them, so that it can lead to the overall success of a project.
Index Terms: AHP, MCDM, Risk Assessment. I. INTRODUCTION
Risk management has become a mandatory demand for construction projects. Hazard identification, risk assessment and risk control are encompassed in risk management process. Risk is assessed by using Quantitative and Qualitative methods. Risk management is the methodical process of analyzing, identifying, and responding to risk relieved to a project and maximizing the possibility and significance of positive attributes and shrinks the possibility and significance of attributes adverse to project objectives. Project risk is an unknown condition or event that, if occurs, has a favorable or unfavorable effect on a project’s goal. Components of risk are an event that may or may not happen, the possibility of the happening of that event and the impact of the happening of that event.
A. Identification of different risks/hazards
1) Project Risk: Software projects are intangible in nature because of which software project undergoes various risks in the form of budget, schedule, resource, personnel and customer related problems which is very difficult to monitor and control. This type of risks is known as project risk.
2) Technical Risk: Technical risk of software project is associated with the software requirement specification, potential design, implementation, interfacing, testing and maintenance problems. However, these type of risks occur
Revised Manuscript Received on July 09, 2019
Suneeta Mohanty, School of Computer Engineering, KIIT Deemed to be
University, Bhubaneswar, India.
Sharmistha Roy, Faculty of Computing and Information Technology,
Usha Martin University, Ranchi, India.
Mrinmoy Ganguly, School of Computer Engineering, KIIT Deemed to
be University, Bhubaneswar, India.
Prasant Kumar Pattnaik, School of Computer Engineering, KIIT
Deemed to be University, Bhubaneswar, India.
due to lack of technical knowledge of the development team.
3) Business Risk: Business risks occur due to non-technical aspects of project development such as budgetary loss, personnel commitments, lack of user satisfaction etc. As introduced by Zopounidis et al [1], Multi Criteria Decision Analysis (MCDA) is an evolving discipline during the past three decades. This is because a single objective or criterion can rarely be the sole basis of real world decisions. Several mathematical and operations research efforts have ended up in many usable frameworks that are applied in finance, mainly seeking the maximization of profits. The importance and effect of factors not directly related to Exploration and Production (E&P) projects have increasingly shown the need for them to be considered in all the phases of any given project. Project economics and technical issues are no longer isolated or independent from environmental, social and geopolitical risk factors. Traditional project evaluations and economic analyses perform well as evaluation tools if the problem is well stated, and if there is a single evaluation criterion. However, in reality, the modeling of financial problems is based on a different logic, which must take into consideration:
1) Existence of multiple criteria for the selection.
2) Existence of conflicting situations within these multiple criteria.
3) The subjectivity of the evaluation process (such as probabilities).
4) Uncertainty factors that have to be considered and that could drastically change the outcome of an investment. One of the main concerns at the time of making E&P project evaluations is that there should be proper unbiased consideration given to the probability parameters, ultimately providing the required numbers on which the final decisions are based. A typical example is the probabilities assigned to important petro physical and geological data, which yield the estimated resources in place.
These numbers are often assigned by estimators, based on their experience and judgment. Nevertheless, it still is one of the crucial sources of uncertainties in the appraisal of new discoveries, since original oil in place(OOIP) or original gas in place (OGIP) will be one of the key parameters used to estimate profitability of any project.
Risk Assessment for Project Construction Based
On User Perspective: An Experimental Analysis
Using AHP
II. LITERATUREREVIEW
Innumerable techniques have been offer for assessment and analysis risk ranging from simple traditional methods to advance techniques. For risk analysis Howard et al (1981) [2] used impact diagram methods. A susceptivity examination method was accepted by the author Norris (1992) [3] to predict the result of amount of a single independent on the dependent variable. Monte Carlo simulation (PMBoK, 2004) [4] was also indicating to assess simultaneous change in numerous independent variables. Decision analysis is done using decision matrices and decision trees (PMBoK, 2004) [4] along with MCDM techniques such as the simple attribute and multi-attribute rating technique (Von Winterfeldt & Edwards, 1986) [5]. Whereas, for decisions making the Analytic Hierarchy Process (AHP; Saaty, 1990) and other decision making algorithms was used to facilitate under insecure or unknown situations. For detain and non-fulfillment to complete the work in the specification of cost and timeframe, Mohamed Sayed Bassiony, Ahmed Abd El-Karim etal explain that main source of disputes lies in construction of projects. In project construction, the major challenges for the owner lies in project risk mainly in delivering the project on time. Unpredicted increase in delays and cost in construction projects are trigger by environments, contractor, owner etc. in which various types of risk factors may arise simultaneously. Even though increasing in cost and schedule during project construction has received huge attention of researchers, but because of uninterrupted development and changes in the field, the author has examined construction industry in Egypt to plan analysis and risk strategy. Research on risk management mostly focus on the result of risk management on firm value (Hoyt et al, 2011; Gordon et al, 2009; Beasley et al, 2008) [6, 7, 8], capital requirement and measuring risk (Toneguzzo, 2010; Panning, 2006) [12, 13], factors that generate firm to implement risk management (Acharyya, 2009) [11] and how to execute risk management (Pagach et al, 2011; Nocco et al, 2006) [9, 10].
In this paper, we have focus on the application of AHP in risk management specially risk identification and risk assessment. The following literature discuses the research area of risk management.
Iyer et al (2010) [14] take into account several work on enterprise risk management (ERM) and analyzes it. The objective of the analysis are on the outcome of risk management to firm performance, to determine the factors that play role in implementation of risk management, the extent of risk management implementation and, the applied and theoretical version of risk management.
Ping Zhuang et al (2008) by visualization method maps core research group of enterprise risk management. The most important eleven research groups that are identified: risk management practices, process safety management, risk reduction, market conditions, insurance company, quality management, financial risk management, electricity price, risk factors, health risks and risk assessment.
For controlling risk the author Verbano et al 2011 [15] view the new path of extension and application of the process of dealing with risk. the survey acknowledge with nine principal path of development: risk administration in strategic , risk administration in disaster, risk administration in insurance, risk administration in supply chain, risk
administration in project, risk administration in financial, risk administration in enterprise, risk administration in engineering, risk administration in clinical. For managing risk in every area various tools are used. AHP is among them. For risk administration in supply chain and risk administration in project, only AHP is used. For risk administration in financial and economic decision making MCDM tool is largely used. Researchers in finance are bound to use analytic decision making tool because of problem complexity and importance of the decision. AHP has its own methodology and principle for making the decision. In different area AHP is widely used like household population prediction, Pareto-optimal solutions, setting of priorities and options for projects in the electric utility industry, federal government, medicine, politics and the most important and recognized application: business. Several specialized journals have also published numerous articles dedicated to the approach of problems through the AHP in areas like Socio-Economic Planning Sciences, Mathematical Modeling and Operations Research, among others. Only the brief but helpful explanations of Chang et al. [16], and reservoir planning applications of Gerbacia et al. [17], have been put in working models that aid the decision making process at different scales and levels of importance.
AHP technique merges qualitative and quantitative factor and divides all into level. For deriving the highest priorities from the similar element of comparison matrix, under the consideration of common attribute and common criterion or sub-criterion [19]. Dissimilar elements are also in the group in order to increase the method. AHP applications have contained both solitary and parallel hierarchies.
Author Zopounidis et al (2002) [18] describe the application of MCDA in finance. In different area MCDA can apply like monetary planning, credit and insolvency risk, country risk assessment, management of the portfolio and its selection, risk capital, corporate performance assessment, funding a project decision, and mergers and acquisition. MCDA technique is also used for differents field of study like AHP, UTADIS (Utilities Additives (UTA) and Utilities Additives Discriminates), ELECTRE (Elimination Et Choix Traduisant la Realite), PROMETHEE (Preference Ranking Organization Method of Enrichment Evaluations), MAUT (Multiattribute Utility Theory), MHDIS (Multi-Group Hierarchical Discrimination).
Guodong Ni et al., in 2010 [21] have put forward a hybrid model based on AHP method, Delphi method and fuzzy mathematics theory which identifies the risk, determine the risk factors which builds the assessment matrix and establish the fuzzy model for analyzing the matrices. This model is applied on vicarious management corporation (VMC) projects to characterize the project risks using risk breakdown structure, assess them and also signify the importance of risks assessment. The model proves to be an efficient and feasible one having potential value in assessing the risks of VMC projects.
Chen and Wang in 2009 [22] have focused in their paper on International project risks as many constructors are involved in abroad and oversea projects. The assessment begins with the classification of risk using Hierarchical Risk breakdown structure. The purpose of this hierarchical model is to fragment the risk factors into more details for efficient assessing. Based on the hierarchical risk structure,
a risk index model is framed which evaluates the risk source using AHP model, assess the risk factors using fuzzy approaches and depending on the result prioritize the international projects accordingly.
Liu Bochao [23] in his research work focused on emerging area of supply chain risk management where classification and refinement of risks are carried out based on supply chain risk sources. The incoming and outgoing flow of business depends on supply chain and risk on supply chain is a potential threat which can damage the entire system. Based on different types of risks, a risk assessment and correlation model is constructed using AHP and Fuzzy techniques which help in risk quantification. This model will help in calculation of supply chain risks and helps in risk assessment and decision making in supply chain system.
Wei et al., in 2010 [24] established a hierarchy structure for selection of risk factors in E-government information systems based on the OCTAVE (Operationally Critical Threat, Assets and Vulnerability Evaluation) theory.
The structure is evaluated using risk assessment method which combines Fuzzy AHP and EBP Neural Network method. the model is tested in China Information Security Risk Assessment Forum for proving the efficiency and accuracy of the assessment process. The proposed model is compared with ANN method which shows that it gives accurate result in lesser time.
Lei L., in 2014 [25] proposed a fire assessment system for electric vehicles which is based on AHP method as it gives better solution for weight problems and multi-objective decision theory. Consistency of the system was also analyzed using AHP method which meets the compliance requirements. This fire risk assessment model is helpful for building fire safety checklist of electric vehicles. Finally the model is tested in a typical village in the city of Beijing which gets a high degree of agreement and efficiency.
Lei and Xieqin in 2015 [26] in 2015, proposed a risk assessment model for analyzing the damage factors in tunnels. The model is evaluated using fuzzy synthetic evaluation (FSE) method which includes selection of risk factors, ranking them accordingly, quantifying and fuzzification of the risk factors, assignment of weights to each risk factor and sub-factor and finally aggregating the result to give the final treatment. The factors affecting the tunnel includes ground level, excavation width, overburden depth, bias pressure, adverse geology, ground water, technology level and management level of construction units.
Zhi et al., in 2017 considered a company for assessing the risk factors associated in the company. The authors proposed a security risk assessment model which combines entropy-weight along with AHP method. the uncertainty of risk factors and weight vector are calculated using modified entropy-weight method which is combined using AHP method to improve the subjective result of the risk factors. The model is experimented in real time situation to verify the validity of the result and its applicability.
[image:4.595.310.541.408.589.2]III. PROPOSEDMODELFORRISKASSESSMENT In this paper the risk is divided into two parts and further into twelve sub-category and every sub category have their own constrains. Our main aim is to find the best suitable location for constructing the project. In this paper, we have selected three locations for planning the project like Delhi, Bhubaneswar (BBS) and Kolkata. Every location has their own strength and weakness among them we need to find which location is best construction and have minimum risk. This AHP framework was accepted from the real life project designing. A risk-based hierarchy consisting of the potential risk items threatening the construction planning is shown in Fig. 1. In this framework we divided the risk into two part i.e. internal risk and external risk. Internal risk are classified into 6 category Financial and Economic, Design, Management Problem, Technical, Low Technology Level and commercial. Similarly, external risk is classified into 6 category like Physical, Natural disaster, Political and Environmental, Scarcity of Reserves and Difficult Development. For performing the comparison of the pairwise matrix among the element of hierarchy, there is total 14 corresponding matrix are built which help the expert to make a comparison. At first, we make the pairwise comparison between the attribute of the criteria which is found in the top most portion of the hierarchy and then we perform on sub-criteria which is present on the
second level and so on. In all the level of numerous risks compare to each other to know their overall weight of risk assessment for project planning. In the comparison matrix when ever any element is compared with itself then the value is one and the remaining value in the pairwise matrix is on the basis of sanity pairwise scale. The value 3, 5, 7, and 9 proportional to the verbal judgments “moderately extra supreme”, “powerful extra supreme”, “very powerful extra supreme”, and “extremely powerful extra supreme” (and 2, 4, 6, and 8 for settlement between the antecedent values). Reciprocal values are automatically entered in the transpose position. Consistency of the set of judgments is measured by the consistency ratio (C.R.), which we explain now [5]. Consistency ratio= Consistency index (CI)/random index. Therefore we required to calculate the consistency index which is required for calculate of consistency ratio.
CI= Max Eigen vector-n / n-1
Consistency indices for a randomly generated matrix [19].
n 1 2 3 4 5 6
RI 0.00 0.00 0.520 0.890 1.110 1.250
n 7 8 9 10 11 12
RI 1.350 1.40 1.45 1.49 1.52 1.54
Consistency ratio is known as CR in AHP. The author Saaty show that if CR <0.1 or less than 0.1 then the judgment is consistent or acceptable and if the value of CR is greater which mean judgment is inconsistent and you make it consistent.
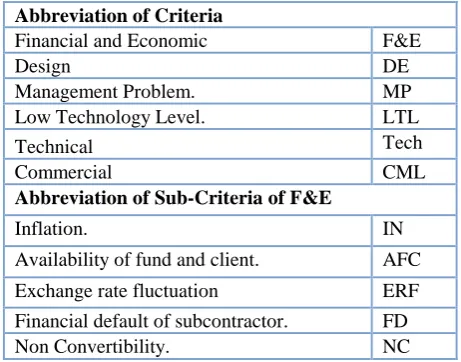
Abbreviation of Criteria
Financial and Economic F&E
Design DE
Management Problem. MP
Low Technology Level. LTL
Technical Tech
Commercial CML
Abbreviation of Sub-Criteria of F&E
Inflation. IN
Availability of fund and client. AFC
Exchange rate fluctuation ERF
Financial default of subcontractor. FD
Non Convertibility. NC
Step 1 & 2: In order to ease the simplification process, we show the full calculation technique for the Internal Risks sub group or branch from our hierarchy model. For implementation of the pairwise comparison we required to generate comparison matrix of the sub criteria which is involve in the decision. Cell value in comparison matrix is from Saaty’s pairwise comparison scale. For instance, if we assume design is very strong more dominant than financial and economic, then for designing financial and economic cell
of its value i.e. 1/7. Same way assign the value for all cells in comparison matrix which shown in Table 1.
When the importance of the criteria/sub-criteria is compared by itself like F&E vs. F&E, DE vs. DE, MP vs. MP on such case cell value is always 1. Therefore diagonal value is always 1 in pairwise comparison matrix. The value which is used to represent the criteria which is present in the hierarchy, it is not necessary that all data are of same unit e.g. if we talk about the quality of labor then it is represented in some different unit or if we talk about the cost it measure in Rs. So to make all the criteria in the same unit we need to perform normalization of matrix. Normalization is the second step in decision making. For executing normalization we add the values in each column and then divide each cell by total of the column which shown in Table 2. From this normalized matrix, we get the final priorities or overall in Table 2 by calculating of each row average
.
e.g. (0.049+0.008+0.03+0.124+0.02+0.07)/6 = 0.05.
[image:5.595.317.560.202.459.2]Table 1. Pairwise comparison matrix w.r.t internal risk
Table 2. Normalization of matrix
IV. SYNTHESIZINGOFJUDGEMENTSFOR CRITERIAOFLEVELIIIOFTHEHIERARCHY The core of the AHP resides in the prioritization, and in order to obtain useful results these must be checked for consistency.
As earlier if CR <0.1 or less than 0.1 then the judgment is consistent or acceptable and if the value of CR is greater which mean judgment is inconsistent and you make it consistent.
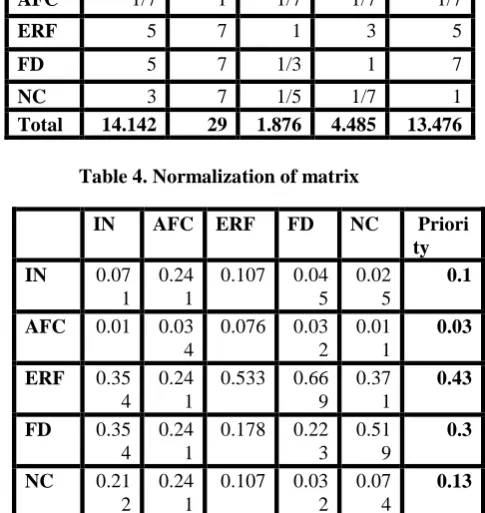
Now we come one step below in the hierarchy, and we compare the sub-criteria of each criterion with the same process which is adopted for parents. Here we compare the sub-criteria of Financial and Economic as shown in Table 3. The normalization of the matrix is performed in Table 4.
Table 3. Pairwise comparison matrix w.r.to Financial and Economic
Table 4. Normalization of matrix
V. SYNTHESIZINGOFJUDGEMENTSFORSUB
CRITERIAOFLEVELIVOFTHEHIERARCHY Step 3: Then we need to measure the overall weight of all the criteria and sub-criteria. This can be calculated by multiplying each sub-criteria weight with its parent’s weight. For example: Availability of fund and client. (Individually weighted as 0.03) and its parents is Financial and economic (individually weighted as 0.05), therefore final weight of Availability of fund and client within the complete hierarchy, will be the product of both weights (parent and son), or 0.03 x 0.05 = 0.0015.
Note that the sum of all of the weights is equals 1. This means that, the priorities are normalized.
Likewise, by applying the previously described procedure to the other major branches of internal risk and External risk, we can appreciate the weights of all the conforming criteria which shown in Table 5.
F&E DE MP LTL Tech CML
F&E 1 1/7 0.2 3 0.2 0.5
DE 7 1 1/6 8 1/3 1/8
MP 5 6 1 9 5 0.2
LTL 1/3 1/8 1/9 1 1/3 5
Tech 5 3 0.2 3 1 1/3
CML 2 8 5 0.2 3 1
Total 20.33 18.27 6.68 24.2 9.87 7.16
F& E
DE MP LTL Tec
h CM
L Weig hts F& E 0.0 49 0.00 8 0.0 3 0.12 4
0.02 0.07 0.05 DE 0.3
44 0.05 5 0.0 25 0.33 1 0.03 4 0.01 7 0.13 MP 0.2
46 0.32 8 0.1 5 0.37 2 0.50 7 0.02 8 0.27 LT L 0.0 16 0.00 7 0.0 17 0.04 1 0.03 4 0.69 8 0.14 Tec h 0.2 46 0.16 4 0.0 3 0.12 4 0.10 1 0.04 7 0.12 CM L 0.0 98 0.43 8 0.7 49 0.00 8 0.30 4
0.14 0.29
IN AFC ERF FD NC
IN 1 7 1/5 1/5 1/3
AFC 1/7 1 1/7 1/7 1/7
ERF 5 7 1 3 5
FD 5 7 1/3 1 7
NC 3 7 1/5 1/7 1
Total 14.142 29 1.876 4.485 13.476
IN AFC ERF FD NC Priori
ty
IN 0.07
1 0.24
1
0.107 0.04 5
0.02 5
0.1
AFC 0.01 0.03
4
0.076 0.03 2
0.01 1
0.03 ERF 0.35
4 0.24
1
0.533 0.66 9
0.37 1
0.43
FD 0.35
4 0.24
1
0.178 0.22 3
0.51 9
0.3
NC 0.21
2 0.24
1
0.107 0.03 2
0.07 4
[image:5.595.41.289.460.661.2]Table 5. Priority and overall weights for criteria and sub-criteria
Criteria/Sub-Criteria Priority (Weight)
Overall Weights
Financial and economic
Inflation.
Availability of fund and client. Exchange rate fluctuation. Financial default of subcontractor. Non Convertibility. 0.1 0.03 0.43 0.3 0.13 0.005 0.0015 0.0215 0.015 0.0065 Design
Incomplete design scope. Defective design Design change. Error and omission. Inadequate specifications 0.17 0.3 0.4 0.09 0.04 0.0221 0.039 0.052 0.0117 0.0052 Management problem
Lack of qualified labor. Language barrier. Lack or expensive labor. Labor dispute and strike. Labor productivity Defective work Equipment failure 0.2 0.08 0.14 0.11 0.18 0.16 0.13 0.054 0.0216 0.0378 0.0297 0.0486 0.0432 0.0351 Technical Owner changes.
Material, labor and equipment resourcing.
Delay in preparation of submittals. Poor coordinate.
Delays in obtaining NOC from authorities.
Quality of Integrity of design. Inefficient planning. Delay in approvals
0.16 0.15 0.22 0.09 0.05 0.1 0.13 0.1 0.0192 0.018 0.0264 0.0108 0.006 0.012 0.0156 0.012 Commercial
Delay in payment. Inadequate claim of administration.
Poorly tailored contract form. Third party liability. Conflict in contract document.
0.16 0.28 0.19 0.27 0.1 0.0464 0.0812 0.0551 0.0783 0.029 Low level technology
Lack of exploration technology. Lack of production technology.
0.19
0.72
0.0266
0.1008
Lack of suitable equipment. 0.08 0.0112 Act of God
Flood Earthquake Land slide Fire Wind. Lighting. Drought. 0.13 0.09 0.15 0.3 0.07 0.14 0.12 0.026 0.018 0.03 0.06 0.014 0.028 0.024 Political and Environmental
Changing in law and regulation Requirement for permit and their approved. Pollution and safety rules.
Expropriation. Embargoes.
Threat of war/ terrorism attack
0.2 0.17 0.26 0.14 0.12 0.11 0.022 0.0187 0.0286 0.0154 0.0132 0.0121 Law inconsistencies
Tax rate increase. Strict environment protection regulation.
Barrier in capital export
0.37 0.33 0.3 0.0481 0.0429 0.039 Physical
Damage to structure. Damage to equipment. Labor injuries.
Material and equipment fire and theft
0.26 0.19 0.34 0.22 0.0884 0.0646 0.1156 0.0748 Scarcity of reserves
Poor resources abundance Low remaining reserve. Inadequate proven reserve High reserve depletion. Poor well information for appraisal 0.03 0.25 0.26 0.29 0.16 0.0009 0.0075 0.0078 0.0087 0.0048 Difficult development
Comparison of investment alternatives:Direct pairwise comparisons are made in this phase among each of the investment alternatives. Now we rate, in a pairwise way, each alternative from the point of view of each of the risk factors we are ultimately considering in our analysis.
The comparisons are preformed on similar questions asked for the criteria ranking; such as: “From the point of view of Lack of ground access, which of the following investment options would represent the most potential problems/risks?” After consideration of our options, we obtained the following priorities.
Table 6. Weight factor for Inflation (IN)
Table 7. Weight factor for Availability of Fund and Client (AFC)
[image:7.595.46.563.109.457.2]Similarly, for our other risk branches we have obtained the following weights as shown in Table 8.
Table 8. Ranking of each alternative on every sub-criterion of F&E
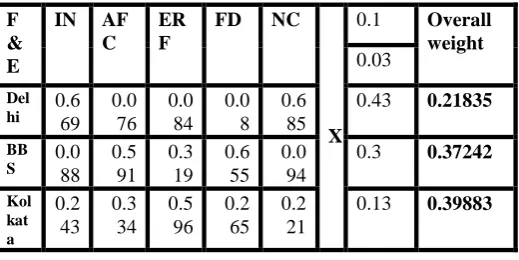
Step 4: Now finally rating of each alternative is multiplied by the weight of sub-criteria/ criteria.
Finally, according to the ranking (Kolkata > BBS > Delhi), Kolkata is best for sub criteria Financial and Economic Risk.
Similarly we need to find rating of each alternate from every criterion and sub criteria. Therefore the final ranking is shown in Table 9.
At last by summing up of column we calculate the final ranking of alternate which help to understanding of the entire scenario as represented in Table 10.
Ranking of alternatives:
Bhubaneswar (BBS) > Delhi > Kolkata
Table 9. Ranking of alternative on every criteria
Table 10. Final ranking of the alternate
VI. RESULTANALYSIS
[image:7.595.33.293.528.658.2]The result of this model is totally depended on the calculation of priority and ranking of alternate. The alternate which have the highest ranking will have the highest priority. In our model Bhubaneswar (BBS) will have the minimum effort of risk as compare to Delhi and Kolkata for planning for the project and for construction. Every alternate have their own ranking (weight age) on the risk criteria. For instance, if we remove some criteria on that time Bhubaneswar may not be the best alternate.
Fig 2. Individual criteria weight for Delhi location
IN Delh
i
BBS Kolkata Normalization Priorit
y
Delhi 1 7 3 0.678 0.636 0.692 0.669
BBS 0.14
3
1 0.333 0.097 0.091 0.077 0.088
Kolkata 0.33
3
3 1 0.226 0.273 0.231 0.243
Total 1.47
6
11 4.333
Delhi BBS Kolkata Internal Risk
Financial and Economic
0.21835 0.37242 0.39883
Design 0.39505 0.38634 0.21861
Management Problem
0.32921 0.3816 0.28922
Low Technology level
0.55296 0.20197 0.23507
Technical 0.25799 0.53306 0.20882
Commercial 0.29153 0.34601 0.36234
External Risk
Law inconsistencies 0.29128 0.5486 2
0.1601
Act of god.(Natural disaster)
0.25227 0.479 0.26861
Physical 0.24865 0.4279
8
0.33349
Political and Environmental.
0.28411 0.4314 8
0.2843
Scarcity of reserves 0.30223 0.4517 0.23581
Difficult Developments
0.36269 0.3335 0.30377
Delhi BBS Kolkata
3.78632 4.89368 3.29897
AFC Delh
i
BBS Kolkata Normalization Priorit
y
Delhi 1 1/7 1/5 0.077 0.087 0.063 0.076
BBS 7 1 2 0.538 0.609 0.625 0.591
Kolkata 5 1/2 1 0.385 0.304 0.313 0.334
Total 13 1.6429 3.2
F & E
IN AF C
ER F
FD NC
X
0.1 Overall weight 0.03
Del
hi 0.669 0.076 0.084 0.08 0.685 0.43 0.21835 BB
S 0.0
88 0.5
91 0.3
19 0.6
55 0.0
94
0.3 0.37242 Kol
kat a
0.2 43
0.3 34
0.5 96
0.2 65
0.2 21
[image:7.595.309.546.645.828.2]Figure 2 explain that for Delhi location, low level technology is have highest weight which means that technology present in Delhi location is quite higher as compare to all criteria. And the graph is also show the individual weight of each criterion for Delhi location.
Fig 3. Individual criteria weight for Bhubaneswar (BBS) location
[image:8.595.57.292.358.500.2]Same way figure 3 show the individual weigh of each criteria and sub-criteria for Bhubaneswar (BBS) location and also show tell that which criteria effect less when we are selection Bhubaneswar location for construction planning.
Fig 4. Individual criteria weight for Kolkata location On the same manner figure 4 shows about the entire weight for Kolkata location. Lower weight criteria, that creates more problems for construction of any project in Kolkata location. E.g. law inconsistencies create more problems for construction of any project.
And final figure 5 shows the best among the three alternate. This means that for construction of any project from available alternate, Bhubaneswar (BBS) Location is best option among the alternate.
Fig 5. Final ranking (Highest rank highest priority) VII. CONCLUSION
Risk assessment is a tool which helps in decision making regarding investment of project construction in various locations. Construction of project is influenced by multiple risk factors associated to it. In this proposed work, the primary focus is to build a framework for ranking the alternatives based on various decision parameters. In our study, risk assessment is considered to be very important activity during project investment. The paper explores different internal and external risk factors that can affect the project construction. The proposed methodology implements a Multi-Criteria Decision Making algorithm (namely AHP algorithm) for analyzing and evaluating different risk factors and provides an effective decision making in choosing the best project location based on several risk factors. This decision tool reduces biased decision making and facilitates consensus decision making by a group of decision makers. Finally, the result analysis shows the ranking of project locations based on both internal and external risk factors. Overall result shows that Bhubaneswar (BBS) is having the best rating among all the alternatives followed by Delhi and then Kolkata for investment in project construction. Hence, the proposed methodology can be considered an effective risk assessment tool as it form an integral part of safety and secure project investment.
REFERENCES
1. C. Zopounidis, and M. Doumpos, "Multi-criteria Decision Aid in
Financial Decision Making: Methodologies and Literature Review," Journal of Multi-Criteria Decision Analysis, vol. 11, 2002, pp. 97-107.
2. R.A. Howard, J.E. Matheson, Influence diagrams, in: R.A. Howard,
J.E. Matheson (Eds.), Readings on the Principles and Applications of Decision Analysis, Strategic Decisions Group, Menlo Park, CA, 1984, pp. 719-762.
3. C. Norris, “The management of risk in engineering projects.” MPhil
Dissertation. Manchester England: University of Manchester Institute of Science and Technology, 1992.
4. P. PMBoK, “A guide to the project management body of knowledge”.
Edition. Newtown Square, PA: Project Management Institute, 2004.
5. D. Von Winterfeldt, and W. Edwards, “Decision analysis and
behavioral research”, 1, Cambridge: Cambridge University Press, 1986.
6. R. E. Hoyt, and A.P. Liebenberg, “The value of enterprise risk
management”. Journal of Risk and Insurance, vol. 78 issue. 4, 2011,
pp. 795-822.
7. L. Gordon, M. Loeb, and C. Tseng, “Enterprise risk management and
firm performance: A contingency perspective.” Journal of Accounting
and Public Policy, vol. 28 issue. 4, 2009, pp. 301-327.
8. M. Beasley, D. Pagach, and R. Warr, “Information conveyed in hiring
announcements of senior executives overseeing enterprise-wide risk
management processes”. Journal of Accounting, Auditing and
Finance, 23 (3), 2008, pp. 311-332.
9. D. Pagach, and R. Warr, “The characteristics of firms that hire chief
risk officers”. The Journal of Risk and Insurance, vol. 78, issue 1,
2011, pp. 185-211.
10. B. Nocco, and R. Stulz, “Enterprise risk management: Theory and
practice:. Journal of Applied Corporate Finance, vol. 18 issue. 4,
2006, pp. 8-20.
11. M. Acharyya, “The influence of enterprise risk management on insurer
stock market performance” An event analysis. 2009 Enterprise Risk
Management Symposium.
12. J. P. Toneguzzo, How to
[image:8.595.65.281.647.781.2]Simkins (Eds.), Enterprise risk management: Today's leading research for tomorrow's executives, John Wiley and Sons, 2010 pp. 189-216.
13. W. H. Panning, “Managing the invisible: Measuring risk, managing
capital and maximizing value.” April 2006, Enterprise risk management symposium.
14. S. R. Iyer, D. A. Rogers, and B. J. Simkins, “Academic research on
enterprise risk management.” In J. Fraser & B. J. Simkins (Eds.), Enterprise risk management: Today's leading research and best practices for tomorrow executives, New Jersey: John Wiley & Sons, 2010, pp. 419-43.
15. C. Verbano, and K. Venturini, “Development paths of risk
management: Approaches, methods and fields of application”. Journal
of Risk Research, vol.14, issue. 5, 2011, pp. 519-550.
16. Y. Chang, C. Chen, X. Wang, and K. Liu, "An Innovative Method:
Risk Assessment for Exploration and Development of Oil and Gas," paper SPE 104458 presented at the 2006 SPE Eastern Regional Meeting, Ohio, October.
17. W. Gerbacia, and H. Al-Shammari, "Multi-Criteria Decision Making
in Strategic Reservoir Planning Using the Analytic Hierarchy Process," paper SPE 71413 presented at the 2001 SPE Annual Technical Conference in New Orleans, Louisiana, September.
18. C. Zopounidis, and M. Doumpos, “Multi-criteria decision aid in
financial decision making: Methodologies and literature review.” Journal of Multi-Criteria Decision Analysis, vol. 11, issue. (4-5), 2010, pp. 167-186.
19. T. L. Saatya et al "On the Invalidity of Fuzzifying Numerical
Judgments in the Analytic Hierarchy Process" in ISAHP 2007, Viña del Mar, Chile, August 3-6, 2007
20. S. Chunmei, et al., “Information Network Risk Assessment Based on
AHP and Neural Network”, Proceedings of 10th International Conference on Communication Software and Networks (ICCSN), 6-9 July 2018, pp. 227-231, 2018
21. N. Guidong, et al., “Research on the Risk Assessment Method of
Vicarious Management Corporation Based on the Fuzzy AHP Method”, Proceedings of the International Conference of Information Science and Management Engineering, 7-8 August, pp. 531-535, 2010.
22. P. Chen and J. Wang, “Application of a Fuzzy AHP Method to Risk
Assessment of International Construction Projects”, International Conference on Electronic Commerce and Business Intelligence, 6-7 June, pp. 459-462, 2009.
23. B. Liu, “Supply Chain Risk Assessment Based on AHP and Fuzzy
Comprehensive Evaluation”, Proceedings of International Conference on Management of e-Commerce and e-Government, 23-24 October, pp. 317-322, 2010.
24. G. Wei, “Research on E-government information security risk
assessment- Based on Fuzzy AHP and Artificial Neural Network model”, Proceedings of the First International Conference on Networking and Distributed Computing, 21-24 October, pp. 218-221, 2010.
25. L. Lei, “Study on the Fire Risk Assessment of the Electric Bicycle
Based on the AHP”, Proceedings of the 7th International Conference on Intelligent Computation Technology and Automation, 19-20 December, pp. 729-732, 2014.
26. H. Lei and X. Huang, “Risk assessment in Tunnel Portal based on
Fuzzy AHP Comprehensive Evaluation”, Proceedings of the International Conference on Intelligent Transportation, Big Data and Smart City, 19-20 December, pp. 692-695, 2015.
27. Z. Hua, et al., “A Novel Risk Assessment Model on Software System
Combining Modified Fuzzy Entropy-Weight and AHP”, Proceedings of the 8th IEEE International Conference on Software Engineering and Service Science (ICSESS), 24-26 November, pp. 451-454, 2017.
AUTHORSPROFILE
Dr. Suneeta Mohanty is working as a Assistant Professor, in School of Computer Engineering, KIIT Deemed to be University, Bhubaneswar. Her interests focus on Cloud Computing, Network Security, Wireless Sensor Network.
Dr. Sharmistha Roy is working as a
Assistant Professor, in Faculty of Computing and Information Technology, Usha Martin University, Ranchi, India.
Moreover, she has received Gold medal during her M.Tech. Her interests focus on Cloud Usability, Security, and Software Engineering.
Mrinmoy Kumar Ganguly completed his
M.Tech from KIIT University, Bhubaneswar and B.Tech from Rajiv Gandhi Proudyogiki
Vishwavidyalaya [RGPV]
University, Bhopal, Madhya Pradesh, India.
Apart from this, he is internationally certified
in CCNA from Cisco and MCITP from
Microsoft.
Dr. Prasant Kumar Pattnaik is working as