AGGREGATION INFLUENCES CORAL SPECIES RICHNESS
AT MULTIPLE SPATIAL SCALES
RONALDH. KARLSON,1,4HOWARDV. CORNELL,2ANDTERENCEP. HUGHES3
1Department of Biological Sciences, University of Delaware, Newark, Delaware 19716 USA
2
Department of Environmental Science and Policy, University of California, Davis, California 95616 USA
3ARC Centre of Excellence for Coral Reef Studies, James Cook University, Townsville, Queensland 4811, Australia
Abstract. The spatial dispersion of individuals across multiple spatial scales can significantly influence biodiversity patterns. Here we characterize the dispersion of corals in reef assemblages distributed across a 10 000-km longitudinal biodiversity gradient from Indonesia to the Society Islands, using a multiscale sampling design. Our results indicate that most coral species were aggregated among 10-m transect samples across this vast distance. Using observed and randomized species sampling curves, we show that aggregation reduced the number of species per transect, site, and island sample on average by 13–27%. Across site, island, and regional scales, aggregation also reduced the area under species sampling curves by an average of 2.7–6.5%. The level of aggregation was relatively constant across spatial scales within regions and did not vary among habitats. However, there was significant variation among regions using transect samples across individual sites. Specifically, aggregation reduced the species richness per transect and the area under species sampling curves nearly twice as much in the Indonesian biodiversity hotspot than in the Society Islands. As a significant component of the spatial structure of coral assemblages, aggregation should be integrated into our understanding of coral community dynamics and the development of conservation strategies designed to protect these communities.
Key words: biodiversity; community structure; coral reefs; dispersion; spatial scale; species sampling curves.
INTRODUCTION
Understanding the spatial structure of ecological assemblages is fundamental to biodiversity studies and the development of strategies designed to conserve biodiversity. Individual species vary in several attributes influencing their abundance and distribution patterns (e.g., fecundity, longevity, distributional limits, habitat and species associations, and dispersal capabilities), and these patterns change across local, regional, and biogeographic scales. Likewise, multispecies assemblag-es vary in structure at different spatial scalassemblag-es as a consequence of many geographical, evolutionary, and ecological processes (Myers and Giller 1988, Levin 1992, Ricklefs and Schluter 1993, Giller et al. 1994, Karlson 1999). Thus, characterizing and understanding spatial structure across multiple scales is an important yet challenging objective.
Here we examine the spatial structure of species-rich coral assemblages occurring across a 10 000-km biodi-versity gradient in the Indo-Pacific (Karlson et al. 2004, Connolly et al. 2005). In particular, we assess the effects of spatial aggregation on species richness at multiple spatial scales. When individuals of some species are aggregated, they occur in fewer samples than expected
under random dispersion, thereby depressing estimates of richness and community similarity (He and Legendre 2002, Plotkin and Muller-Landau 2002, Green and Ostling 2003, Veech et al. 2003). The magnitude and scale of this depression needs to be assessed, because it can potentially affect community attributes inferred from species richness estimates (e.g., species–area relationships, local–regional species richness relation-ships, and the degree of species overlap among samples [Coleman et al. 1982, Plotkin and Muller-Landau 2002]).
In the species-rich tropics, the best studies of spatial aggregation have been conducted in forests (He et al. 1997, Condit et al. 1996, 2000, Plotkin et al. 2000). In a 50-ha plot in the Pasoh forest of Malaysia, He et al. (1997) found 599 predominantly common species to be aggregated, 145 mostly rare species to be randomly dispersed, and only one species to be uniformly dispersed. Within six, fully mapped tropical forests including the Pasoh forest, Condit et al. (2000) determined that dispersion patterns in each forest were quite similar. Among 1768 species with at least one tree per hectare, 1490 species (84%) were significantly aggregated at the 0–10 m scale.
Nonrandom dispersion has also been found in coral assemblages, but there are few fully mapped plots larger than a few square meters (see Reinicke et al. [2003] for a notable exception) and spatial data are sparse. Studies of Manuscript received 17 March 2006; revised 12 July 2006;
accepted 18 July 2006. Corresponding Editor: K. Winemiller.
4E-mail: [email protected]
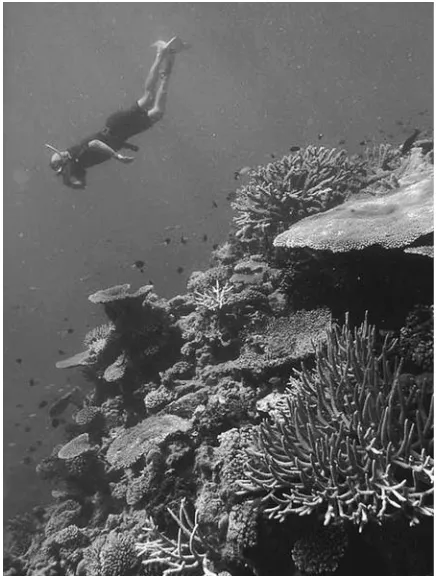
coral aggregation have often focused more on larval settlement behavior and asexual fission at a scale of a few meters (e.g., Lewis 1970, Carlon and Olson 1993, Zilberberg and Edmunds 2001) than on the quantifica-tion of spatial dispersion across larger scales. Thus no broad generalizations regarding dispersion in corals have been possible to date. Early reports on a few species at local spatial scales found aggregated (Lewis 1970, Dana 1976), random (Stimson 1974, Dana 1976), and even uniform dispersion (Stimson 1974). Here we examine species-level spatial patterns in the highly diverse Indo-Pacific coral fauna (see Plate 1). We determine how dispersion varies across multiple spatial scales and how it influences species richness patterns. We show that most corals are aggregated, thereby depress-ing species richness across regional, island, and site scales. In addition, we document some unexpected scale invariance in the degree of aggregation observed within regions.
METHODS
We quantified spatial dispersion in coral assemblages sampled along 1800, 10-m line transects on 15 Indo-Pacific islands in five regions (Indonesia, Papua New Guinea, the Solomon Islands, American Samoa, and the Society Islands of French Polynesia). We sampled four sites on each island and three habitats per site (reef flats, crests, and slopes). In each habitat, 10 replicate 10-m transects were sampled within a small area (;200–300 m2) that was relatively homogeneous with respect to
habitat structure and species composition. In total, 333 coral species were identified and measured among .41 000 sampled colonies. We used two methods to assess coral dispersion patterns. At the broadest scale, we quantified species-specific dispersion among all transects across the five regions. This characterized the combined effects of factors operating at multiple scales: regional endemism, habitat specialization, site-specific affinities due to environmental factors, and some life history attributes (seeIntroduction). We then quantified assemblage-wide dispersion at regional, island, and site scales of analysis using species sampling curves and randomization methods (Gotelli and Colwell 2001).
To assess species-specific dispersion, we used ID,
Morisita’s index of dispersion (Southwood and Hender-son 2000), and standardv2tests. Because there were so many tests, we corrected the rejection levels using the sequential Bonferroni procedure, where the test criterion for theith species isPi(1(1a)[1/(1þki)]), wherea¼ 0.05 andk¼333 tests (Rice 1989). For brevity, we did not assess species-specific dispersion within each region, island, or site. Such an effort would require up to 21 645 tests (333 species3[5 regionsþ15 islandsþ45 sites]) and generate much more detail than required here.
Species sampling curves were generated by plotting the cumulative number of species (Sob) against the
cumulative number of colonies (X) averaged over 100 replicate randomizations of sample order. These curves
are referred to in the literature as smoothed species– individual curves or species accumulation curves (Gotelli and Colwell 2001). To remove the effect of aggregation, randomized species sampling curves (Sr) were generated
in which colonies were randomly assigned to samples. The number of colonies per sample remained unchanged in each of 100 randomizations of sample order, and colony sampling occurred without replacement. By sampling without replacement, the two sampling curves are constrained to converge when all colonies in all samples are used to determine cumulative species richness. In the absence of aggregation, the two curves are identical. When aggregation is present, most of the observed sampling curve falls below the randomized sampling curve (i.e., species richness is depressed).
Two geometric attributes of the species sampling curves were used to quantify the aggregation of corals, the relative difference in the elevation of each pair of observed and randomized sampling curves, and the relative difference in the area under them. The former was assessed with estimates of the mean number of species per sample. Estimates for the area under these curves were determined across the full range of sample sizes. A similar approach has been used previously by Plotkin et al. (2000) to analyze the effects of aggregation on species–area curves for tropical forests. Because species sampling curves are nonlinear and species richness tends to level with sampling effort, we first determined the best-fitting, second-degree polynomial regression equation (S¼b0þb1Xb2X2) for each curve.
The degree to which the average species richness per sample was depressed due to aggregation isDS, where DS¼SrSobin transect, site, or island samples at site,
island, and regional scales of analysis. The quantitiesSr
and Sob were determined by solving the polynomial
equations using the mean number of colonies per sample (X¼the total number of colonies across all samples divided by the number of samples). The polynomial equations were also integrated and solved for the areas under the sampling curves. The difference in the areas is DA, whereDA¼ArAob. Because the quantitiesDSand
DA varied directly with the numbers of species and colonies sampled, we used the relative measures DS/Sr
andDA/Arto standardize them for comparisons among
differentially rich samples. These proportional devia-tions from the random expectadevia-tions increase with the degree of aggregation.
across each region (n¼3 islands). We avoided pooling and randomizations across habitats, because there is some significant depth-related species segregation and because species abundance distributions vary among habitats (Connolly et al. 2005). Consequently, we had three sample unit sizes (transect, site, and island samples) and three progressively larger scales of analysis (sites, islands, and regions) for each habitat. For each of the six combinations of sample unit size and scale of analysis, we used stepwise multiple regression analysis to evaluate the sensitivity of relative aggregation (DA/Ar)
and relative depression in species richness per sample (DS/Sr) to four independent variables. These were (1) the
total number of colonies across all samples, (2) the total number of species across all samples, (3) the ordered rankings of regions (from west to east), and (4) the ordered rankings of habitats (by relative distance from shore).
RESULTS
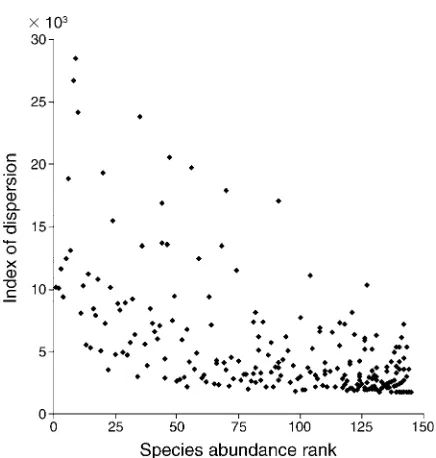
Most coral species (230 of 333) exhibited significant aggregation across the 1800 transects (Morisita’s indices of dispersion,v2.2001, df¼0.05, 1799). This number of significant results is much higher than expected based on chance alone. More abundant species had dispro-portionately higher variance (V) relative to the mean
(M) than did less abundant species [V ¼ 5.51M1.24, standard error of the exponent ¼ 0.01, R2 ¼ 97%]. However, abundant species also exhibited wide variation in this index of dispersion (Fig. 1). Linear regression of the index of dispersion against the abundances of all species explained less than half of the variation (R2¼ 43%when regressed against rank abundance,R2¼37% when regressed against log mean abundance). The 77 most abundant coral species (each with .100 sampled colonies) all showed low positive values for the spatial aggregation parameter derived from the negative bino-mial distribution (k¼0.006 – 0.536 over this range of species). Such values are indicative of pronounced aggregation (Pielou 1977).
The species sampling curves were well described by second degree polynomial equations. Across all sample unit sizes and scales of analysis,.92%of the observed variation in cumulative species richness was explained by these equations (most polynomials explained.99% of the observed variation). For example, observed and randomized curves for 10 transects sampled at a reef crest site in Kimbe Bay, Papua New Guinea are illustrated in Fig. 2. The polynomial equations for these curves each explained 99.5% of the variation in the average cumulative species richness. It is clear in this example that aggregation reduced both the average species richness per transect (by 37%) and the area under the species sampling curve (by 10%).
Mean relative aggregation (DA/Ar) and mean relative
depression in the number of species per sample due to aggregation (DS/Sr) were significantly greater than zero
for all sample unit sizes and scales (Table 1). The quantity DA/Ar varied only slightly with sample unit
size, but not among the different scales of analysis for either transect or site sample units. Transect sample FIG. 1. Morisita’s index of dispersion for coral species
across 1800 transects plotted against rank abundance. Signif-icant aggregation occurred in 230 species with an index of dispersion .2.00 3 103 (tested against critical v2 values corrected using the sequential Bonferroni procedure). The most abundant species has a rank of 1, and tied values with the same rank and level of aggregation are not shown. All species ranked 1–97 were significantly aggregated. Numerical abundances ranged from 1 to 4484 colonies. Abundance ranks 25, 50, 75, 100, and 125 correspond to 402, 194, 93, 51, and 22 colonies, respectively.
FIG. 2. Observed and randomized species sampling curves for ten 10-m line transects at a single reef crest site in Kimbe Bay, Papua New Guinea. The difference in the area under these curves is indicated byDA, an absolute measure of aggregation. The difference in the mean number of species per transect is indicated byDS. In this example, there were 33 species among 325 sampled colonies in all 10 transects,DA¼721, andDS¼
[image:3.567.58.276.56.285.2] [image:3.567.286.503.464.586.2]units yielded lower estimates of DA/Ar (0.027– 0.035)
than site (0.065) or island sample units (0.060). Nevertheless, all mean values forDA/Arwere small in
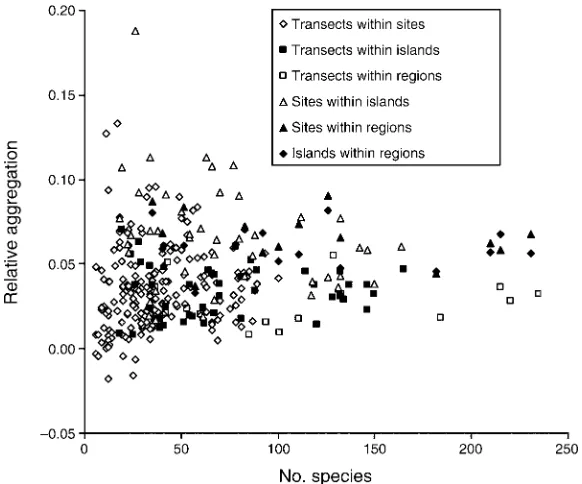
magnitude. They differed significantly from zero, yet they fell well below values one might expect for extreme aggregation (estimated to be 0.200– 0.250). The maxi-mum individual value forDA/Arwas 0.188 for four site
sample units from reef flats on Tutuila in American Samoa (Fig. 3). The mean values forDS/Srindicate that
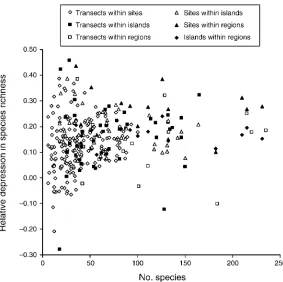
aggregation reduced species richness per sample on average by 13–27% (0.129– 0.266 in Table 1). These means were similar across most sample unit sizes and scales of analysis except for the higher values generated by site samples and analyzed at the regional scale. The maximum individual value forDS/Srwas 0.457 for 40
transect sample units, again from the four reef flat
locations on Tutuila (Fig. 4). Aggregation at these sites reduced the average species richness per transect by almost one half and the average species richness per site by more than one third (0.388).
In multiple regressions, the number of species sampled was not a significant predictor of DA/Ar or DS/Sr
regardless of sample unit size or scale of analysis (Tables 2 and 3). This result emphasizes the stability of these measures across differentially rich sites, islands, and regions. It is also apparent that these measures tended to be less variable among speciose sites, islands, and regions (Figs. 3 and 4). As noted above, the maximum individual values came from samples collected on relatively depau-perate reef flats in American Samoa. However, minimum values also came from reef flats in the easternmost regions of American Samoa and the Society Islands.
TABLE1. Coral aggregation among replicate transect, site, and island sample units at site, island, and regional scales of analysis.
Sample unit
Scale of
analysis N
DA/Ar DS/Sr
Mean6SE t Mean6SE t
Transect site 180 0.03560.002 19.235*** 0.12960.007 17.706*** Transect island 45 0.03460.002 14.630*** 0.15960.019 8.463*** Transect region 15 0.02760.004 7.629*** 0.13460.034 3.941** Site island 45 0.06560.005 13.591*** 0.17860.011 15.889*** Site region 15 0.06560.004 16.479*** 0.26660.023 11.724*** Island region 15 0.06060.003 17.815*** 0.16560.010 16.207***
Note:Mean relative aggregation (DA/Ar) and the relative depression in species richness due to aggregation (DS/Sr) are reported
as means6SE for all estimates across all regions and tested for nonrandomness using Student’sttests (H0:l¼0), withtvalues
appearing in parentheses. **P0.01; ***P0.001.
The total number of estimates across all five regions.
FIG. 3. Relative aggregation (DA/Ar) of corals across all sample unit sizes and scales plotted against the total number of species
[image:4.567.142.433.422.664.2]The relationship between number of sampled colonies andDA/Arwas significant in two of the six regressions
(Table 2). SubstitutingDS/SrforDA/Ar, only one of six
regressions was significant (Table 3). These three cases in the two sets of regressions all used site samples formed by pooling the 10 transects at a site. The regression coefficient in each case was negative, indicating a reduction in the effects of aggregation with increasing numbers of colonies. This effect can be removed in future studies by using comparable numbers of colonies, but our analysis here is based on a balanced design with fixed numbers of transects, resulting in quite variable numbers of colonies ranging from 707 on reef flats in American Samoa to 5537 on reef slopes in the Society Islands.
Both DA/Ar and DS/Sr were sensitive to regional
location, revealed in regressions using transect sample units at the site scale, but not using larger sample unit sizes or scales (Tables 2 and 3). In contrast, these relative measures of aggregation were insensitive to habitat ranking. Thus we detected significant spatial variation in the degree of aggregation in coral assemblages at the regional scale, but found no local variation among habitats. This result emphasizes regional differences in the degree of local spatial heterogeneity within sites that are independent of the numbers of species and colonies sampled. The significant regression coefficients for the regional effect on relative aggregation were negative, reflecting an eastward decline in the degree of aggrega-FIG. 4. Relative depression in species richness per sample (DS/Sr) of corals across all sample unit sizes and scales plotted against
the total number of species at each scale.
TABLE2. The sensitivity of relative aggregation (DA/Ar) to number of colonies and regional ranking. Mean square due to error
(MSE) is reported with the regression coefficient (b) andFtest for each significant independent variable entering the regression model.
Sample unit
Scale of
analysis MSE
No. colonies Regional rank
R2
b F df b F df
Transect site 5.603104 – 4.553103 13.30*** 1, 178 7%
Transect island 2.373104
Transect region 1.883104
Site island 8.813104 –2.593105 8.73** 1, 43 17%
Site region 1.783104 –5.933106 5.40* 1, 13 29%
Island region 1.693104
Note:The number of species and habitat ranking were not significant predictors of relative aggregation for any sample unit size or scale of analysis.
[image:5.567.138.421.59.341.2] [image:5.567.59.501.584.672.2]tion. Mean values forDA/Arvaried significantly among
regions (F4, 175 ¼ 4.56, P , 0.005) with the largest
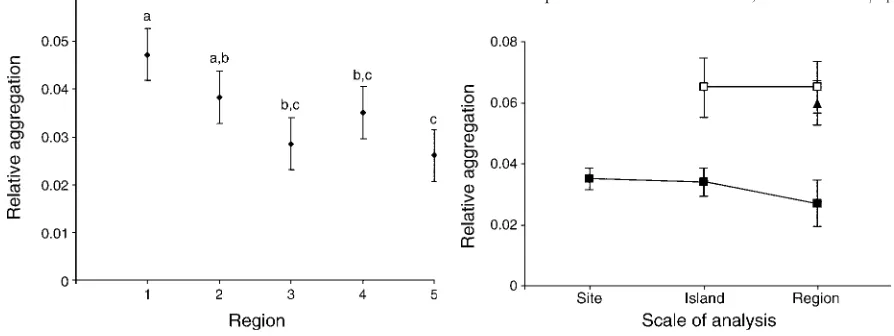
difference being between Indonesia (0.047) and the Society Islands (0.026) (Fig. 5). Mean values forDS/Sr
also varied significantly among regions (F4, 175¼3.30,P ,0.02 ) with the largest difference again being between Indonesia (0.159) and the Society Islands (0.094).
DISCUSSION
Our results demonstrate pervasive strong aggregation in coral assemblages at multiple spatial scales. At the broadest scale, most species were aggregated among transect samples across the entire biodiversity gradient (Fig. 1). At site, island, and regional scales of analysis, there was significant aggregation in coral assemblages (Table 1). The relative measure of aggregation (DA/Ar)
remained stable when transect and site samples were evaluated at different scales within regions (Fig. 6). Thus samples at different sites and islands within regions were similar in terms of species composition. However, the
mean values for DA/Ar among transect samples were
approximately half of that for site and island samples. This may be a sampling effect. On average, there were only 23 colonies and 10 species per transect across all habitats and regions (1800 transects) and most species (;65%) were represented by only one to three colonies in the 10 replicate transects per location; 37% of the species were represented by a single colony (Connolly et al. 2005). Such small numbers of colonies for so many species is likely to have constrained our measures of aggregation by limiting the random placement of colonies of the same species among different transects. This underestimation of aggregation is likely to have been much less severe using pooled samples. On average, there were 231 colonies and 37 species among 10 pooled transects in site samples, and 925 colonies and 74 species among 40 pooled transects in island samples.
Aggregation depressed the average number of species per sample for all sample units at all scales of analysis (Table 1). On average, the magnitude of this depression was 2–15 species per sample representing 13–27%of the random expectations. At the extreme, values for DS/Sr
TABLE3. The sensitivity of the relative depression of species richness per sample (DS/Sr) to number of colonies and regional
ranking. Mean square due to error (MSE) is reported with the regression coefficient (b) and F test for each significant independent variable entering the regression model.
Sample unit
Scale of
analysis MSE
No. colonies Regional rank
R2
b F df b F df
Transect site 9.113103 –1.583102 9.87** 1, 178 5%
Transect island 1.583102 Transect region 1.753102
Site island 4.993103 –5.553105 7.06* 1, 43 14%
Site region 7.723103 Island region 1.553103
Note:The number of species and habitat ranking were not significant predictors ofDS/Srfor any sample unit size or scale of analysis.
*P,0.05; **P,0.01.
FIG. 5. Mean relative aggregation (695%LSD intervals) of corals among 10 transects at the site scale. Regional codes are 1, Indonesia; 2, Papua New Guinea; 3, the Solomon Islands; 4, American Samoa; and 5, the Society Islands. Three homoge-neous groups are: ‘‘a,’’ regions 1 and 2; ‘‘b,’’ regions 2, 3, and 4; and ‘‘c,’’ regions 3, 4, and 5 (Fisher’s LSD tests,P,0.05).
FIG. 6. Mean relative aggregation (695% CI) among transect (solid squares), site (open squares), and island (solid triangle) samples evaluated within sites, islands, and regions. Cross-scale stability of this measure of aggregation is evident for transect samples (F2, 237¼0.91,P¼0.404) and site samples
[image:6.567.66.509.94.180.2] [image:6.567.63.510.473.641.2]reached a maximum depression of 46%per transect and 39%per site on the relatively depauperate reef flats we sampled in American Samoa. This effect emphasizes the need to evaluate local richness across multiple scales within assemblages with significant aggregation. Mean values for DS/Sr were relatively stable (0.129–0.178 in
Table 1) among transect samples at all scales, site samples at the island scale, and island samples at the regional scale. However, DS/Sr rose to 0.266 for site
samples at the regional scale. This result may be related to a wide variety of environmental and demographic factors that generate variation in species abundance and distribution patterns across these Indo-Pacific sites (e.g., Connolly et al. 2005, Dornelas et al. 2006).
Two surprising results emerge from the multiple regressions of DA/Ar and DS/Sr. First, we found no
significant effect of habitat on either measure of aggregation regardless of sample unit size or scale (Tables 2 and 3). It is well known that species richness varies among reef flat, crest, and slope habitats and that a variety of local environmental factors (e.g., episodic disturbances and exposure to environmental extremes) contribute to this variation (e.g., Connell et al. 2004, Karlson et al. 2004). That these same factors did not also contribute to significant differences in coral dispersion among habitats (e.g., due to differential levels of local asexual fission) is unexpected.
Second, we did find significant variation among regions inDA/ArandDS/Srusing the smallest samples
(transects) at the most local, site scale (Tables 2 and 3). These results suggest that there are regional differences in the local processes operating at this scale (Huston 1999, Karlson and Cornell 2002). To our knowledge, these results are unique in being detected across a 10 000-km biodiversity gradient, with the largest differ-ence among regional means occurring between Indone-sia and the Society Islands. In fact, the highest estimates of the meanDA/Aramong transect samples were from
Indonesia at all three scales of analysis (0.047 at the site scale and 0.042 at the island and regional scales). Nevertheless, these values were below those for most site and island samples (Fig. 3), and the regional trend was not significant when one analyzes these larger pooled samples. This may be partially due to the pooling process itself, because it reduces the number of samples and the degrees of freedom associated with the statistical tests. Therefore, more data (particularly at broader spatial scales) and statistical modeling may be needed to understand how the effects of local processes, sampling effort, data pooling, and the scale of analysis may interact to influence regional differences in the degree of aggregation in these assemblages.
Documenting differential levels of aggregation among regional coral faunas and the processes generating them may have important implications for the development of conservation strategies designed to preserve coral reef biodiversity. Assemblages characterized by higher levels of spatial aggregation will require larger Marine Protected Areas to maintain a given level of protection across all species, compared to less aggregated assem-blages. In addition, selection of only one or a few species for protection in highly aggregated assemblages would jeopardize a larger proportion of unprotected species. Thus, an improved understanding of the spatial structure of these speciose assemblages is critical for conservation efforts that are based on protecting multiple locations or selected species.
ACKNOWLEDGMENTS
We thank J. Wolstenholme, M. J. Boyle, L. Dinsdale, A. Green, A. Baird, S. Connolly, M. Kospartov, P. Osmond, and K. Osmond for their assistance in the field. Funding was provided by grants from the Australian Research Council, the National Science Foundation, and the National Geographic Society.
LITERATURECITED
Carlon, D. R., and R. R. Olson. 1993. Larval dispersal distance as an explanation for adult spatial pattern in two Caribbean reef corals. Journal of Experimental Marine Biology and Ecology 173:247–263.
Coleman, B. D., M. A. Mares, M. R. Willig, and Y.-H. Hsieh. 1982. Randomness, area, and species richness. Ecology 63: 1121–1133.
Condit, R., et al. 2000. Spatial patterns in the distribution of tropical tree species. Science 288:1414–1418.
Condit, R., S. P. Hubbell, J. V. LaFrankie, R. Sukumar, N. Manokaran, R. B. Foster, and P. S. Ashton. 1996. Species– area and species–individual relationships for tropical trees: a PLATE1. A diverse coral assemblage, typical of the central
[image:7.567.58.276.65.353.2]comparison of three 50-ha plots. Journal of Ecology 84:549– 562.
Connell, J. H., T. P. Hughes, C. C. Wallace, J. E. Tanner, K. E. Harms, and A. M. Kerr. 2004. A long-term study of competition and diversity of corals. Ecological Monographs 74:179–210.
Connolly, S. R., T. P. Hughes, D. R. Bellwood, and R. H. Karlson. 2005. Community structure of corals and reef fishes at multiple scales. Science 309:1363–1365.
Dana, T. F. 1976. Reef-coral dispersion patterns and environ-mental variables on a Caribbean coral reef. Bulletin of Marine Science 26:1–13.
Dornelas, M., S. R. Connolly, and T. P. Hughes. 2006. Coral reef diversity refutes the neutral theory of biodiversity. Nature 440:80–83.
Giller, P. S., A. G. Hildrew, and D. G. Raffaelli, editors. 1994. Aquatic ecology: scale, pattern and process. Blackwell Scientific Publications, Oxford, UK.
Gotelli, N. J., and R. K. Colwell. 2001. Quantifying biodiver-sity: procedures and pitfalls in the measurement and comparison of species richness. Ecology Letters 4:379–391. Green, J. L., and A. Ostling. 2003. Endemics–area
relation-ships: the influence of species dominance and spatial aggregation. Ecology 84:3090–3097.
He, F., and P. Legendre. 2002. Species diversity patterns derived from species–area models. Ecology 83:1193–1198. He, F., P. Legendre, and J. V. LaFrankie. 1997. Distribution
patterns of tree species in a Malaysian tropical rain forest. Journal of Vegetation Science 8:105–114.
Huston, M. A. 1999. Local processes and regional patterns: appropriate scales for understanding variation in the diversity of plants and animals. Oikos 86:393–401. Karlson, R. H. 1999. Dynamics of coral communities.
Population and community biology series, Volume 23, Kluwer Academic, Dordrecht, The Netherlands.
Karlson, R. H., and H. V. Cornell. 2002. Species richness of coral assemblages: detecting regional influences at local spatial scales. Ecology 83:452–463.
Karlson, R. H., H. V. Cornell, and T. P. Hughes. 2004. Coral communities are regionally enriched along an oceanic biodiversity gradient. Nature 429:867–870.
Levin, S. A. 1992. The problem of pattern and scale in ecology. Ecology 73:1943–1967.
Lewis, J. B. 1970. Spatial distribution and pattern of some Atlantic reef corals. Nature 227:1158–1159.
Myers, A. A., and P. S. Giller, editors. 1988. Analytical biogeography. An integrated approach to the study of animal and plant distributions. Chapman and Hall, London, UK. Pielou, E. C. 1977. Mathematical ecology. John Wiley and
Sons, New York, New York, USA.
Plotkin, J. B., and H. C. Muller-Landau. 2002. Sampling the species composition of a landscape. Ecology 83:3344–3356. Plotkin, J. B., M. D. Potts, N. Leslie, N. Manokaran, J.
LaFrankie, and P. S. Ashton. 2000. Species–area curves, spatial aggregation, and habitat specialization in tropical forests. Journal of Theoretical Biology 207:81–99.
Reinicke, G. B., D. K. Kroll, and H. Schuhmacher. 2003. Patterns and changes of reef-coral communities at the Sanganeb-Atoll (Sudan, central Red Sea): 1980–1991. Facies 49:271–298.
Rice, W. R. 1989. Analyzing tables of statistical tests. Evolution 43:223–225.
Ricklefs, R. E., and D. Schluter, editors. 1993. Species diversity in ecological communities: historical and geographical perspectives. University of Chicago Press, Chicago, Illinois, USA.
Southwood, T. R. E., and P. A. Henderson. 2000. Ecological methods. Third edition. Blackwell Science, Oxford, UK. Stimson, J. 1974. An analysis of the pattern of dispersion of the
hermatypic coralPocillopora meandrinavar.nobilisVerrill. Ecology 55:445–449.
Veech, J. A., T. O. Crist, and K. S. Summerville. 2003. Intraspecific aggregation decreases local species diversity of arthropods. Ecology 84:3376–3383.