Ymchwil gymdeithasol Social research
Number: 43/2013
Evaluating the Foundation Phase:
The Outcomes of Foundation
Phase Pupils (Report 1)
Evaluating the Foundation Phase:
The Outcomes of Foundation Phase Pupils (Report 1)
Rhys Davies, Chris Taylor, Trisha Maynard, Mirain Rhys, Samuel Waldron and David Blackaby
(Wales Institute of Social & Economic Research, Data & Methods (WISERD), Cardiff University)
Views expressed in this report are those of the researchers and not necessarily those of the Welsh Government
For further information please contact: Name: Launa Anderson
Department: Knowledge and Analytical Services Welsh Government
Cathays Park Cardiff
CF10 3NQ
Tel: 029 2082 5274
Email: [email protected]
Welsh Government Social Research, 2013 ISBN 978-0-7504-8525-8
Table of Contents
Glossary of Acronyms... i
EXECUTIVE SUMMARY ... ii
1 Introduction...1
2 Conceptualising the Foundation Phase Population ...8
3 Characteristics of Foundation Phase Schools ...13
4 The Foundation Phase and Absenteeism ...16
5 Comparing Key Stage 1 and Foundation Phase Outcomes ...33
6 The Relative Outcomes of Foundation Phase Pupils at Key Stage 2...43
7 Conclusions...55
References ...59
Appendix A. Contents of the National Pupil Database ...60
Index of Figures
Figure 1: Overview of Stepped Wedge Design for Evaluating the Foundation Phase...2 Figure 2: Inequalities in Absenteeism – Sessions Attended ...31 Figure 3: Inequalities in Absenteeism – One or More Unauthorised Absences ...32 Figure 4: Inequalities in Year 2 Attainment: Pilot and Early Start Schools ...42 Figure 5: Inequalities in Key Stage 2 Attainment: Pilot Schools...54
Index of Tables
Table 1: Simplified Representation of the Coverage of the Foundation Phase ...10 Table 2: Population of Children Covered by the Foundation Phase
(Reception+), by Phase of Roll-out ...10 Table 3: Demographic Characteristics of FP Pupils (Reception+), by Phase of Roll-out ...14 Table 4: Number of Children to every Adult in FP schools (Reception+), by Phase of Roll-out ...15 Table 5: Percentage of Days Present (Year 1/2; 2007/08 onwards), by Phase of Roll-out ...18 Table 6: Percentage of Pupils with an Unauthorised Absence (Year 1/2;
2007/08 onwards), by Phase of Roll-out ...19 Table 7: Multivariate Estimates of the Effect of the Foundation Phase on Absenteeism, by Phase of Roll-out ...22 Table 8: PSM Analysis of the Effect of the Foundation Phase on Absenteeism ...29 Table 9: Comparing Key Stage 1 and Foundation Phase Assessments...36 Table 10: Continuity Between Key Stage 1 and Key Stage 2 Maths
Assessments...37 Table 11: Continuity Between Key Stage 1 and Key Stage 2 English
Table 12: Inequality in Year 2 Maths Outcomes – Percentage Achieving
Glossary of Acronyms
CIA Conditional Independence Assumption
FP Foundation Phase
FSM Free School Meals
KS1 Key Stage 1 National Curriculum KS2 Key Stage 2 National Curriculum
LLC Language, Literacy and Communication Skills
MD Mathematical Development
NAfW National Assembly for Wales NPD National Pupil Database
PSDWCD Personal and Social Development, Well-Being and Cultural Diversity
PSM Propensity Score Matching PTR Pupil Teacher Ratios
ref Reference Category (multivariate statistics) SEN Special Educational Needs
WLD Welsh Language Development
WISERD Wales Institute of Social & Economic Research, Data & Methods
EXECUTIVE SUMMARY
Introduction
1. The Foundation Phase is a Welsh Government flagship policy of early years education (for 3 to 7-year-old children) in Wales. Marking a radical departure from the more formal, competency-based approach associated with the previous Key Stage 1 National Curriculum, it advocates a
developmental, experiential, play-based approach to teaching and
learning. The Learning Country: a Paving Document (NAfW 2001a) notes that following devolution, Wales intended to take its own policy direction in order to ‘get the best for Wales’. Getting the best for Wales appeared to involve meeting the challenges of the globalised marketplace (raising levels of basic skills1); overcoming social disadvantage; building a strong, enterprising society that embraces multiculturalism; and promoting the language and traditions of Wales. Participation was seen as a key approach.
2. This report arises from the independent evaluation of the Foundation Phase in Wales, commissioned by the Welsh Government and led by the Wales Institute for Social and Economic Research, Data and Methods (WISERD).
3. This is the first in a series of reports that will examine outcomes available from analysis of the National Pupil Database (NPD). In particular it
presents findings on rates of absence and teacher assessments for all children in Wales who were aged four to seven between 2004/05 and 2010/11.
4. Further reports analysing data from the NPD are expected to be
published throughout the period of the evaluation as additional year-on-year data is collected and made available to the evaluation team.
5. The main aim of this report is to compare the outcomes for children who followed the Foundation Phase with the outcomes of children who previously followed Key Stage 1 of the National Curriculum. The report presents findings relating to a number of key outcomes including:
1
(a) rates and nature of absenteeism
(b) teachers assessments made at Year 2 (i.e. assessments that take place at the end of Key Stage 1 or the Foundation Phase)
(c) teachers assessments made at the end of Key Stage 2 (i.e. at Year 6).
6. The report also considers the two main limitations of this analysis. First, the impact of the Foundation Phase is to lead to changes in a broad range of outcomes that cannot be captured by narrowly defined ‘bottom line’ outcome measures that are collected via teacher assessments. Second, whilst the report aimed to take advantage of the sequential roll-out of the Foundation Phase so that ‘like with like’ comparisons can be made, the content and structure of the analysis has ultimately been determined by the availability of data.
Inequalities in Outcomes
7. An important feature of the Foundation Phase was to reduce inequalities in social and education outcomes. However, the analysis reveals that the introduction of the Foundation Phase is not, to date, associated with changes in the differences in outcomes between population sub-groups, such as those defined by gender, ethnicity and socio-economic
background. The persistence of inequalities is observed in terms of both absenteeism and attainment. Those groups who exhibit the largest disadvantages in terms of educational outcomes include those who are eligible for Free School Meals (FSM) and those who have Special Educational Needs (SEN). Even among these groups, where the potential for narrowing inequalities is greatest, the patterns that existed prior to the introduction of the Foundation Phase are demonstrated to persist following its introduction.
Attendance
8. In terms of absenteeism, the available evidence to date does not suggest that the introduction of the Foundation Phase has been associated with an improvement in levels of pupils’ overall attendance, measured in terms of the proportion of sessions pupils are in school.
9. Furthermore, there is evidence to suggest that in schools who introduced the Foundation Phase during the Early Start Stage of its roll-out, the
incidence of unauthorised absence increased following the introduction of the Foundation Phase. However, this finding among Early Start schools is not repeated among the wider school population.
10. However, among schools in the Final Roll-out Stage of the Foundation Phase (the majority of schools in Wales), unauthorised absenteeism among Year 1 pupils declined following the introduction of the Foundation Phase.
Teacher Assessments at End of Year 2
11. In terms of teacher assessments, the analysis was not able to determine whether the introduction of the Foundation Phase has affected levels of pupil attainment at Year 2. The introduction of the Foundation Phase was accompanied by changes in the methods by which pupils were assessed, both in terms of the subject areas covered and the levels against which pupils were graded. Whilst it was intended that there would be a degree of consistency between the two assessment regimes, with the expected level of attainment at Key Stage 1 (Level 2) being equivalent to the expected level of attainment under the Foundation Phase (Level 5), in practice this has been demonstrated not to be the case.
Key Stage 2 Teacher Assessments
12. Due to the discontinuity in assessment methods at Year 2 following the introduction of the Foundation Phase, teacher assessments made at Key Stage 2 provide the only consistent basis upon which the educational outcomes of pupils can be compared utilising the administrative records contained within the NPD. However, this analysis is hampered by the current availability of Key Stage 2 outcome data for children who went through the Foundation Phase.
13. However, despite this, it does appear that the relative performance of early cohorts of Foundation Phase pupils from Pilot schools at Key Stage 2 appears to have improved compared to the attainment of earlier cohorts of pupils from these same schools.
15. At this stage the results are not conclusive and are sensitive to the
estimation techniques used. Furthermore, results based upon these early cohorts of pupils cannot be generalised to the wider population of
Foundation Phase pupils. Nonetheless, there is some tentative evidence to suggest that performance in English, maths and science at Key Stage 2 has improved among Foundation Phase pupils.
Future Analysis
16. This report represents the first iteration of analysis based upon
administrative data held on the NPD. During the course of the evaluation, further versions of this analysis will be undertaken. The next stage will aim to incorporate data from 2011/12. This year will represent the first year when all children aged 6/7 will have been assessed via the
Foundation Phase. Although no comparisons in outcomes can be made between Foundation Phase and Key Stage 1 outcomes, the availability of this data will be particularly important in terms of understanding the effect of the Foundation Phase on absenteeism.
17. The availability of 2011/12 data will also enable a further year of children who undertook the Foundation Phase in Pilot settings who are assessed at Key Stage 2 to be incorporated in to the analysis.
1 Introduction
1.1. This report arises from the independent evaluation of the Foundation Phase in Wales commissioned by the Welsh Government, led by the Wales Institute for Social and Economic Research, Data and Methods (WISERD). The three year evaluation (2011-2014) has four main aims:
• to evaluate how well the Foundation Phase is being implemented and highlight ways in which improvement can be made
• to evaluate what impact the Foundation Phase has had to date
• to assess the value for money of the Foundation Phase
• to put in place an evaluation framework for the future tracking of outputs and outcomes of the Foundation Phase.
1.2. The Foundation Phase appears to mark a radical departure from the more formal, competency-based approach to early childhood education that has sometimes been associated with the National Curriculum. Drawing on evidence from good early years programmes in
Scandinavia, Reggio Emilia and New Zealand (Te Whãriki) that indicate the adoption of an overly formal curriculum and extensive formal teaching before the age of six or seven can result in lower standards of attainment in the longer term, it promotes an experiential, play-based approach to learning for children aged three to seven. It emphasises the centrality of the child and the significance of children’s wellbeing and advocates a balance of child-initiated and practitioner-directed2 (or practitioner-initiated) activities within stimulating indoor and outdoor environments.
1.3. The Foundation Phase was introduced to primary (or infant) schools in three stages. First, during 2004/05, the Foundation Phase was
2
implemented in 22 schools3, referred to as Pilot schools. Children born during 2000/01 were the first cohort to follow the Foundation Phase programme via these Pilot schools. Second, in 2007/08, the
Foundation Phase was implemented in a further 22 schools, referred to as the Early Start schools. Children born during 2003/04 were the first cohort to be assessed via the end of phase Foundation Phase
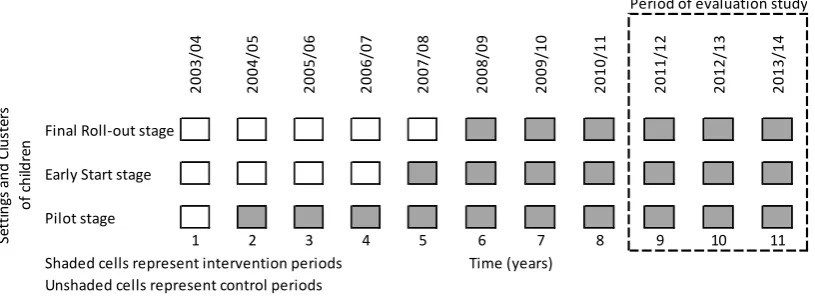
assessment in these Early Start schools. Finally, in 2008/09, the Foundation Phase was rolled-out to all remaining schools in Wales, with children born in 2004/05 being the first cohort to be in receipt of the Foundation Phase. These schools are referred to as the Final Roll-out schools. Figure 1 illustrates how the phased roll-Roll-out of the
[image:12.595.97.505.393.541.2]Foundation Phase relates to the evaluation.
Figure 1: Overview of Stepped Wedge Design for Evaluating the Foundation Phase 2003/ 04 2004/ 05 2005/ 06 2006/ 07 2007/ 08 2008/ 09 2009/ 10 2010/ 11 2011/ 12 2012/ 13 2013/ 14
Final Roll‐out stage Early Start stage Pilot stage
1 2 3 4 5 6 7 8 9 10 11
Shaded cells represent intervention periods Time (years) Unshaded cells represent control periods
Each cell represents a possible data collection point
Period of evaluation study
Se tt ing s an d Cl u ste rs of ch ild re n
1.4. In addition to the phased roll-out of the Foundation Phase to different schools, each school introduced the Foundation Phase to one cohort at a time, starting with children in nursery and/or reception classes. This meant that during the first few years of introducing the Foundation Phase to schools, children in the older cohorts would have been following the Key Stage 1 (KS1) National Curriculum whilst children in
3
The Foundation Phase also applies to nursery-age children in the funded non-maintained sector. A number of these were also included in the Pilot phase of its introduction. However, since this report is primarily concerned with the analysis of the National Pupil Database and statutory assessments undertaken, we only refer to the schools in this report.
the younger cohorts would have been following the Foundation Phase. This is further complicated by the significant presence of
mixed-aged/cohort classes in Wales, particularly in small primary schools; which means some schools would be delivering both curricula in the same classes by the same teachers but to different groups of children.
Aims of the Report
1.5. This is the first in a series of reports that the evaluation will undertake in analysing the National Pupil Database (NPD). The NPD contains administrative data for all children in schools in Wales. It includes some key information relating to the characteristics of children in schools and contains other details relating to their educational progress, principally teacher assessments and attendance data.
1.6. For the purposes of this report, the Welsh Government has extracted anonymised pupil-level data from the NPD for the period 2004/05 to 2010/11. The contents of these data extracts are detailed in Appendix A. Further reports analysing data from the NPD are expected to be published throughout the period of the evaluation as additional year-on-year data is collected and made available to the evaluation team.
1.7. There are two main aims for this report. The first aim is to establish an analytical approach to comparing outcomes for children who followed the Foundation Phase with children who followed its main predecessor, KS1. The second aim is to present findings from the initial analysis of data from the NPD relating to a number of key outcomes, principally (a) rates of absence and (b) teacher assessments, for all children in Wales who were aged four to seven between 2004/05 and 2010/11.
Analytical Approach
1.9. First, it provides the opportunity to compare outcomes before and after the introduction of the Foundation Phase by comparing outcomes for children in different cohorts. Although this provides fairly
straightforward analysis, the main limitation of this approach is that we are not comparing children who followed the Foundation Phase with its predecessor, KS1, in the same academic year.
1.10. However, the second approach to the analysis utilises the sequential roll-out of the Foundation Phase, outlined above, to allow us to compare outcomes for children who followed the Foundation Phase with outcomes for children who followed KS1, from the same academic year. It is this approach that underpins much of the analysis contained in this first report. For more details about the stepped wedge design of this approach see Taylor et al (2012).
1.11. The main limitation of this approach is that we have to rely on
comparing outcomes of children from different schools. Therefore, any underlying differences in the schools, particularly relating to any
selection bias in the choice of Pilot schools and Early Start schools, can potentially undermine the extent to which we can associate outcomes to the presence of the Foundation Phase.
1.12. Consequently, the first stage to the analysis begins with
conceptualising how the Foundation Phase was rolled-out and how the evolution of pupils who had participated in the Foundation Phase during different stages of the roll-out shapes the subsequent analyses (Chapter 2). Given the complex way in which the Foundation Phase has been introduced to different schools and different cohorts of
children this crucially relies on which teacher assessment (KS1 or End of Foundation Phase) recorded for a child as the main indicator of whether a child followed the Foundation Phase or not.
1.13. We then examine any differences in the relative characteristics of pupils within the three different sets of schools, based on their stage of implementing the Foundation Phase (Chapter 3). The available data includes information on age, gender, ethnicity, Free School Meal (FSM) entitlement and whether or not they have any Special Educational Needs (SEN). It is important that any differences in the characteristics of pupils within these schools are subsequently taken into account when examining available outcome data.
1.14. To further reduce the influence of any selection bias in the staged roll-out of the Foundation Phase, we also attempt to combine the two analytical approaches above. So not only are we interested in comparing outcomes of children in different schools in the same academic year, we also examine how outcomes of children from different cohorts but in the same schools change before and after the introduction of the Foundation Phase.
1.15. Following an initial descriptive examination of the characteristics of children in different stages of the Foundation Phase roll-out, the analysis then proceeds to examine available outcome data in relation to the implementation and possible impact of the FP. Two key areas of outcome data are considered, attendance data and teacher
assessment data. Attendance data is used to examine changes in the participation of children in primary education. Changes in attendance may reflect changes in the attitudes of parents towards education in the early years of their children’s schooling. Changes in attendance may also reflect improvements in the health and wellbeing of children who participate in the Foundation Phase. The NPD data is therefore used to examine what (if any) effect the Foundation Phase has had on
attendance in schools (Chapter 4).
respective phase of implementation of the Foundation Phase. There is a clear interest in examining whether the introduction of the Foundation Phase has led to demonstrable changes in outcome measures.
1.17. In addition, despite not being an explicit aim of the Foundation Phase, it is generally accepted that inequalities in educational outcomes was an important factor in its introduction (Maynard et al. 2013). For example, The Learning Country (NAfW 2001) highlighted the need to reduce the
gap in achievement between boys and girls in Wales. The analysis therefore also examines whether the introduction of the Foundation Phase is associated with changes in the differences in educational outcomes. In particular it considers differences in achievement between key groups of the population, such as those defined by gender, ethnicity and socio-economic background.
1.18. From the outset, it is important to acknowledge the limitations of the statistical analyses presented in this report. Firstly, it is important to stress that the Foundation Phase aims to lead to changes in a broad range of outcomes and areas of learning that cannot be captured by narrowly defined ‘bottom line’ outcome measures that are collected via teacher assessments. Secondly, the analysis contained within the report is constrained by the availability of data. For example, absenteeism data is only available from 2008. It is therefore not possible to compare levels of absenteeism in Pilot schools before and after the introduction of the Foundation Phase. The latest available Teacher Assessment data relates to 2010/11. We therefore do not have data on Foundation Phase outcomes from Final Roll-out schools which were first undertaken during the 2011/12 academic year. At the time of writing, only children who were among the earliest cohorts to participate in the Foundation Phase within Pilot schools have been assessed at Key Stage 2 (KS2). It is therefore not possible to assess the longer run effect of the Foundation Phase on more formative outcomes. Finally, whilst different phases of the ‘roll-out’ provide opportunities to compare schools according to their implementation
status, there are no formal ‘control’ schools within Wales with which to compare the outcomes to identify an FP ‘effect’. Whilst every effort is made to make ‘like for like’ comparisons between schools, it is not possible to accurately account for selection effects into the scheme during the roll-out of the Pilot and Early Start phases.
1.19. Finally, it is also important to stress that despite our best attempts to make ‘fair’ or ‘like for like’ comparisons of the Foundation Phase with its predecessor (KS1), it is never possible to fully say what the outcomes of a particular child would have been if they had followed both
curriculum programmes and received both corresponding teacher assessments4.
4
2 Conceptualising the Foundation Phase Population
2.1 Throughout the remainder of this report we identify three groups of pupils:
i. pupils in schools where the Foundation Phase had yet to be introduced (‘KS1’)
ii. pupils in Foundation Phase schools but who themselves were not assessed (or due to be assessed) via the Foundation Phase (‘FP Out’)
iii. pupils who followed the Foundation Phase and who were assessed via the Foundation Phase (‘FP In’).
2.2 As outlined in the previous Chapter, it is assumed that the introduction of the Foundation Phase within a school did not mean that all pupils within the school followed the Foundation Phase programme5. Following the introduction of the Foundation Phase, there was a transitionary period during which older pupils were still assessed against the subjects and levels of the KS1 National Curriculum. However, the size of this group of pupils that were assessed, or were due to be assessed, under KS1 gradually diminishes as these older cohorts progress on to KS2. When the first cohorts of Year 2 pupils are assessed via the Foundation Phase, it is assumed that the school had fully completed its transition to the Foundation Phase. From that point onwards, all pupils are assumed to fall within the coverage of the Foundation Phase.
2.3 The approach taken to identifying FP (‘FP In’) and non-FP (‘FP Out’) pupils in Foundation Phase schools is illustrated within Table 1. The timing with which pupils from Pilot and Early Start schools were actually first assessed via the Foundation Phase, was actually more complex than that implied by the description of the roll-out of the
5
However, it is quite possible that some schools started introducing elements of the Foundation Phase to other, older, children in their school.
Foundation Phase outlined in the introduction to this report. Among the Pilot schools, 11 schools started to assess pupils via the Foundation Phase in 2005/06. Ten of the remaining schools produced their first FP-based assessments during 2006/07. Of the 22 Early Start schools, 19 first produce FP-based assessments during 2009/10. The remaining three schools started to assess pupils via the Foundation Phase at different points in time. Although not illustrated in Table 1, these different start dates for Foundation Phase based assessments
amongst Early Start schools have been taken into account in defining the population of pupils who are covered by the Foundation Phase.
2.4 Applying this methodology, the derived population of children covered by the Foundation Phase is shown in Table 2. Among both the Pilot and Early Start schools, the numbers of children outside of the
Foundation Phase declines as older cohorts of non-Foundation Phase pupils who are assessed via KS1, pass through these schools. The transition from the KS1 National Curriculum to the Foundation Phase is most clearly observed among the Early Start schools. Among these schools, the availability of data from the NPD combined with the timing of the introduction of the Foundation Phase, means that it is possible to observe pupils within these schools: (a) prior to the introduction to the Foundation Phase, (b) during the transition phase following the
implementation of the Foundation Phase, and (c) after the time when all children within these schools are covered by the Foundation Phase.
10
Table 1: Simplified Representation of the Coverage of the Foundation Phase
FP Stage
First FP
Outcomes N 2004/5 2005/6 2006/7 2007/8 2008/9 2009/10 2010/11
Pilot 2005/06 11 =<Yr 1 All All All All All All
2006/07 11 =<Recept =<Yr 1 All All All All All
Early 2009/10 22 None None None =< Recept =< Yr 1 All All
Table 2: Population of Children Covered by the Foundation Phase (Reception+), by Phase of Roll-out
Pilot Early Start Final Roll-out
FP Out FP In FP Out FP In FP Out FP In Total
2004/05 1,076 847 2,941 0 95,704 0 100,568
2005/06 407 1,496 2,880 0 92,843 0 97,626
2006/07 52 1,862 2,830 48 90,549 0 95,341
2007/08 0 1,764 1,891 935 90,185 0 94,775
2008/09 0 1,687 940 1,903 90,570 0 95,100
2009/10 0 1,734 41 2,848 60,828 31,485 96,936
2010/11 0 1,648 0 2,959 30,734 63,445 98,786
[image:20.595.77.549.293.490.2]2.6 There are several caveats that need to be considered in relation to the representation of the Foundation Phase population described in Table 2. Firstly, a number of schools were subject to mergers, either prior to or following the introduction of the Foundation Phase. In some cases, the level of discontinuity associated with such events was low. An example of this would be an infant school merging with a neighbouring junior school on the same site to form a primary school. In other cases, mergers were associated with a more profound reorganisation of local schooling such as the closure of a school. Children from schools that have been subject to a merger have been retained in the analysis that follows. School identification numbers have been re-coded so that the experiences of children who attended these schools prior to a merger can be incorporated in to the analysis. However, it is acknowledged that in some schools, the introduction of the Foundation Phase may have taken place during a period when a school had also experienced other significant changes.
2.7 More significantly, the classification of a child as to whether or not they have been taught via the Foundation Phase is based upon whether or not that child is eventually assessed via the Foundation Phase. In practice, during the transition phase in which a school rolls out the Foundation Phase among successive cohorts of children, it is
questionable whether individual children can be classified in terms of whether or not they are in receipt of the Foundation Phase. Firstly, it is unlikely that the introduction of the Foundation Phase was immediately associated with a ‘step shift’ change in teaching methods. The
Foundation Phase may not have been fully implemented among those reception-aged children who were among the first cohorts to be
in school resources. The clearest example of this will be children in mixed age/year groups, where it would be difficult for older children to be isolated from changes introduced in the classroom as a result of the introduction of the Foundation Phase among younger cohorts. Ideally, it would be preferable to exclude data from these schools during their transition to the Foundation Phase. In practice, this would severely limit comparisons that can be made of children before and after the
introduction of the Foundation Phase within Pilot schools and Early Start schools. The assessment-based definition is therefore a pragmatic choice based upon the available data.
3 Characteristics of Foundation Phase Schools
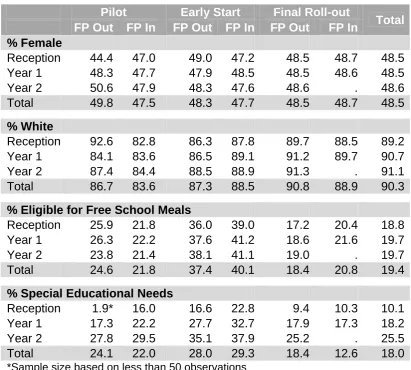
3.1 In this section we outline some of the key characteristics of pupils attending Pilot and Early Start schools relative to those within Final Roll-out schools. All Early Start schools were selected on the basis that they were located in areas covered by the Welsh Government’s Flying Start programme. Flying Start is an Early Years programme targeted at families with children under four years of age who are living in some of the most deprived areas of Wales6. The analysis in Table 3 confirms that children in Early Start schools are much more likely to be entitled to FSM; the proportion of pupils in Early Start schools in receipt of FSM (41%) is more than twice the level observed among Wales as a whole (19%).
3.2 The relatively deprived nature of Early Start schools is also reflected by the higher proportion of pupils in these schools classified as SEN. In particular, within Early Start schools approximately 29% of pupils were classified as SEN during the period covered by the NPD data, some 11 percentage points higher than that observed among Wales as a whole (18%). Across all schools, the incidence of SEN is higher among older pupils as it takes time for their needs to be identified. However, within both Pilot and Early Start schools there is some evidence to suggest that under the Foundation Phase, pupils are being identified as SEN at an earlier stage. By Year 2, the proportion of pupils identified as SEN is broadly comparable between FP and non-FP pupils. No differences emerge in the gender and ethnic composition of the Pilot and Early Start schools.
6
Table 3: Demographic Characteristics of FP Pupils (Reception+), by Phase of Roll-out
Pilot Early Start Final Roll-out
FP Out FP In FP Out FP In FP Out FP In Total
% Female
Reception 44.4 47.0 49.0 47.2 48.5 48.7 48.5 Year 1 48.3 47.7 47.9 48.5 48.5 48.6 48.5
Year 2 50.6 47.9 48.3 47.6 48.6 . 48.6
Total 49.8 47.5 48.3 47.7 48.5 48.7 48.5 % White
Reception 92.6 82.8 86.3 87.8 89.7 88.5 89.2 Year 1 84.1 83.6 86.5 89.1 91.2 89.7 90.7
Year 2 87.4 84.4 88.5 88.9 91.3 . 91.1
Total 86.7 83.6 87.3 88.5 90.8 88.9 90.3 % Eligible for Free School Meals
Reception 25.9 21.8 36.0 39.0 17.2 20.4 18.8 Year 1 26.3 22.2 37.6 41.2 18.6 21.6 19.7
Year 2 23.8 21.4 38.1 41.1 19.0 . 19.7
Total 24.6 21.8 37.4 40.1 18.4 20.8 19.4 % Special Educational Needs
Reception 1.9* 16.0 16.6 22.8 9.4 10.3 10.1
Year 1 17.3 22.2 27.7 32.7 17.9 17.3 18.2
Year 2 27.8 29.5 35.1 37.9 25.2 . 25.5
Total 24.1 22.0 28.0 29.3 18.4 12.6 18.0 *Sample size based on less than 50 observations
3.3 In rolling-out the Foundation Phase, there is a commitment to achieving a new (higher) adult-to-child ratio of 1:8 among pupils aged 3 to 5 and a ratio of 1:15 for those aged 6 to 7. An early indication of the impact of the Foundation Phase is whether these ratios are observed following the introduction of the Foundation Phase. Table 4 provides combined school level adult-to-child ratios for those in reception, Year 1 and Year 2. Due to the level of detail contained within the administrative data, it is not possible to present separate adult-to-child ratios for particular year groups – thereby distinguishing cohorts on the basis of whether or not they were covered by the Foundation Phase. Nonetheless, it can be seen that the introduction of the Foundation Phase is clearly associated with an improvement in the adult-to-child ratio. Amongst
Pilot and Early Start schools it can be seen in Table 4 that there is an immediate fall in the number of children per adult following the
introduction of the Foundation Phase. Within Pilot schools during 2005/06 and within Early Start schools during 2007/08, adult-to-child ratios are shown to improve by approximately 2.5 to 3 pupils per adult compared to the previous year. Among both Pilot and Early Start
schools, this decline is observed to continue in the years that follow the introduction of the Foundation Phase. Among the Final Roll-out
[image:25.595.88.466.445.626.2]schools, the improvement in the adult-to-child ratio has been more gradual with increases in the adult-to-pupil ratios appearing to emerge prior to the introduction of the Foundation Phase. Around the time of the introduction of the Foundation Phase among reception class children (2008/09), an improvement in the adult-to-child ratio of one pupil per adult is observed.
Table 4: Number of Children to every Adult* in FP schools (Reception+), by Phase of Roll-out
Year Pilot Early Start Final Roll-out Total
2004/05 18.3 17.8 18.5 18.5
2005/06 15.9 15.3 18.0 17.8
2006/07 13.7 16.6 17.5 17.4
2007/08 13.9 13.7 16.9 16.8
2008/09 12.6 13.3 15.5 15.4
2009/10 10.9 11.5 14.5 14.3
2010/11 11.6 10.9 13.6 13.5
4 The Foundation Phase and Absenteeism
Introduction
4.1 One area in which the Foundation Phase may have an important impact upon children is in relation to attendance. Increases in
attendance may reflect changes in attitudes (among both children and parents) towards primary education. It is therefore important to assess whether the introduction of the Foundation Phase has had an effect on levels of absenteeism.
4.2 All children receiving an education at school during the normal school day must be placed on the attendance register which records the attendance of all pupils during each half day session (morning and afternoon) during every day that the school is open to pupils. Where a pupil is recorded as absent, the register records whether the absence was authorised or unauthorised. Definitions of authorised and
unauthorised absences, as provided by the Welsh Government, are as follows7:
• Authorised absence - an absence with permission from a teacher or other authorised representative of the school. This includes instances of absence for which a satisfactory
explanation has been provided (e.g. illness, family bereavement or religious observance).
• Unauthorised absence - an absence without permission from a teacher or other authorised representative of the school. This includes all unexplained or unjustified absences.
4.3 Pupil-level absence data was collected from maintained primary schools for the first time in 2007/08. It is therefore not possible to provide any information on levels of absenteeism in Pilot schools prior to the introduction of the Foundation Phase. Furthermore, among Early
7
See http://wales.gov.uk/docs/statistics/2011/111214sdr2312011en.pdf
Start schools, 2007/08 was during the transition stage in which some cohorts of children were still to be assessed via KS1 of the National Curriculum. It is therefore noted that absenteeism data is not available for Early Start schools prior to the implementation of the Foundation Phase.
4.4 Absenteeism data only relates to children of compulsory school age (those aged five and above) and so the analysis that follows only relates to pupils within Year 1 and Year 2 of primary school (i.e. children in reception class are excluded from the analysis). The
analysis of absenteeism focuses upon two measures derived from the NPD.
i. Days present: this relates to the time that pupils are present in school, measured in terms of the proportion of half-day
sessions that pupils were in attendance.
ii. Unauthorised absence: this relates to the proportion of pupils who have had at least one unauthorised absence during the school year.
Levels of Absenteeism
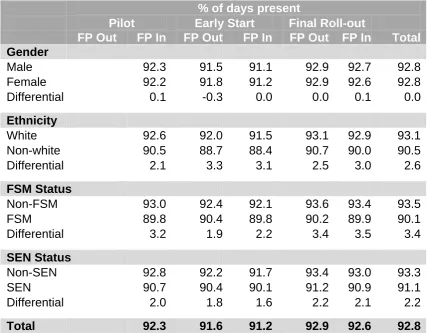
4.5 In terms of overall levels of absenteeism, Table 5 demonstrates that Foundation Phase Pilot schools exhibit levels of absenteeism that are comparable to Final Roll-out schools. Across all schools, levels of absenteeism are approximately three percentage points higher among pupils eligible for FSM. However, this differential does not appear to translate to lower school level attendance among pupils in Early Start schools where the proportion of pupils demonstrated to be eligible for FSM is higher.
Table 5: Percentage of Days Present (Year 1/2; 2007/08 onwards), by Phase of Roll-out
% of days present
Pilot Early Start Final Roll-out
FP Out FP In FP Out FP In FP Out FP In Total
Gender
Male 92.3 91.5 91.1 92.9 92.7 92.8
Female 92.2 91.8 91.2 92.9 92.6 92.8
Differential 0.1 -0.3 0.0 0.0 0.1 0.0
Ethnicity
White 92.6 92.0 91.5 93.1 92.9 93.1
Non-white 90.5 88.7 88.4 90.7 90.0 90.5
Differential 2.1 3.3 3.1 2.5 3.0 2.6
FSM Status
Non-FSM 93.0 92.4 92.1 93.6 93.4 93.5
FSM 89.8 90.4 89.8 90.2 89.9 90.1
Differential 3.2 1.9 2.2 3.4 3.5 3.4
SEN Status
Non-SEN 92.8 92.2 91.7 93.4 93.0 93.3
SEN 90.7 90.4 90.1 91.2 90.9 91.1
Differential 2.0 1.8 1.6 2.2 2.1 2.2
Total 92.3 91.6 91.2 92.9 92.6 92.8
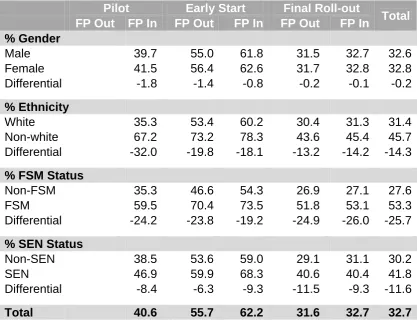
4.7 The relatively higher proportion of children eligible for FSM in Pilot and Early Start schools is more apparent when considering the incidence of pupils who have at least one unauthorised absence during the school year (Table 6). Across all schools, 32.7% of pupils are recorded as having one or more unauthorised absences. Within Pilot schools, this increases to 40.6% among pupils who have participated in the
Foundation Phase.
Table 6: Percentage of Pupils with an Unauthorised Absence (Year 1/2; 2007/08 onwards), by Phase of Roll-out
Pilot Early Start Final Roll-out
FP Out FP In FP Out FP In FP Out FP In Total
% Gender
Male 39.7 55.0 61.8 31.5 32.7 32.6
Female 41.5 56.4 62.6 31.7 32.8 32.8
Differential -1.8 -1.4 -0.8 -0.2 -0.1 -0.2
% Ethnicity
White 35.3 53.4 60.2 30.4 31.3 31.4
Non-white 67.2 73.2 78.3 43.6 45.4 45.7
Differential -32.0 -19.8 -18.1 -13.2 -14.2 -14.3 % FSM Status
Non-FSM 35.3 46.6 54.3 26.9 27.1 27.6
FSM 59.5 70.4 73.5 51.8 53.1 53.3
Differential -24.2 -23.8 -19.2 -24.9 -26.0 -25.7 % SEN Status
Non-SEN 38.5 53.6 59.0 29.1 31.1 30.2
SEN 46.9 59.9 68.3 40.6 40.4 41.8
Differential -8.4 -6.3 -9.3 -11.5 -9.3 -11.6 Total 40.6 55.7 62.2 31.6 32.7 32.7
4.8 Levels of unauthorised absence are highest among pupils in the Early Start schools. Among those pupils covered by the Foundation Phase, 62% are recorded as having had an unauthorised absence. This figure is six percentage points higher than levels of unauthorised absence among non-Foundation Phase pupils, possibly indicating that the
introduction of the Foundation Phase has contributed to higher levels of unauthorised absence.
4.10 As with overall levels of absence, differentials in unauthorised absence between population sub-groups do not appear to be affected by the introduction of the Foundation Phase.
Estimating the Effect of the Foundation Phase on Absenteeism
4.11 The preceding analysis has illustrated some of the variations in absenteeism that exists between various sub-groups of pupils. A problem that underlies these variations is that it is not clear what
separate and additional contribution each factor makes to the likelihood of an individual having higher or lower levels of absenteeism. For example, is the variation in attainment by ethnicity simply a
consequence of the fact that those from ethnic minority backgrounds are more likely to also be in receipt of FSM, and would therefore be expected to have higher levels of absenteeism as a result of their socio-economic background? Alternatively, is ethnicity itself associated with higher levels of absenteeism? Are differences in absenteeism between pupils with and without SEN also a consequence of socio-economic background, or is it the case that FSM and SEN status both have a separate and additional effect on absenteeism?
4.12 Of particular interest to the present analysis is to identify the possible influence of the Foundation Phase on absenteeism. Therefore, the question to be addressed is whether, given the individual
characteristics of pupils participating in the three roll-out stages of the Foundation Phase, are levels of absenteeism higher or lower than we would expect them to be.
4.13 To develop a better understanding of these issues, we utilise a
statistical approach that is able to identify how a range of individual and school-related characteristics contribute to observed levels of
absenteeism. Multivariate statistical techniques are employed to simultaneously estimate the separate and additional influence of different characteristics on pupil absenteeism, thereby enabling the
effect of participation in the Foundation Phase on absenteeism to be isolated and evaluated.
4.14 Two sets of regression models have been estimated. The first set examines the effect of the Foundation Phase on the overall levels of absenteeism. Here the methodology employs a basic Ordinary Least Squares specification and examines what factors contribute to our understanding of which pupils are present for more or less time during the academic year. The second set of models examine the effect of the Foundation Phase on levels of unauthorised absence. Here, pupils are distinguished in terms of whether or not they have had an unauthorised absence during the academic year. Logistic regression is then used to determine what characteristics are associated with the relative
likelihood of a child having an unauthorised absence. Within each set of regressions, four separate models are estimated in order to take advantage of the sequential roll-out of the Foundation Phase. Models are also estimated for specific year groups to ensure that ‘like for like’ comparisons are being made.
4.15 The results of the analysis are presented in Table 7. For ease of exposition, only results relating to the coverage of the Foundation Phase are presented. All statistical models simultaneously controlled for a range of other characteristics including gender, age, ethnicity, FSM eligibility and SEN status. These control variables are included at both an individual and school level (i.e. the percentage of pupils within a school who are white). Asterisks are used to denote the presence of statistically significant relationships at the 1% (***), 5% (**) and 10% (*) significance levels.
4.16 The upper panel of Table 7 presents results for overall levels of absenteeism (measured in terms of the percentage of sessions
Table 7: Multivariate Estimates of the Effect of the Foundation Phase on Absenteeism, by Phase of Roll-Out
Population
Full Sample
Final
Roll-out Early Start Year 1 Year 1 Year 1 Year 2
% change in attendance
Model 1 Model 2 Model 3 Model 4 Pilot Stage: FP Out
Pilot Stage: FP In 0.003
Early Start Stage: FP Out 0.005 ref ref
Early Start Stage: FP In 0.004 -0.001 0.002
Final Roll-out Stage: FP Out ref. ref. Final Roll-out Stage: FP In 0.004*** 0.004***
Relative likelihood of unauthorised (%) absence
Model 5 Model 6 Model 7 Model 8 Pilot Stage: FP Out
Pilot Stage: FP In 15.2
Early Start Stage: FP Out 53.2 ref ref
Early Start Stage: FP In 70.5*** 26.2 30.7
Final Roll-out Stage: FP Out ref. ref. Final Roll-out Stage: FP In -9.8*** -6.1* * p<0.10, ** p<0.05, *** p<0.01
4.17 In each model, an arbitrarily chosen category is selected to act as the reference group against which the effect of being a particular group of pupil is evaluated. Model 1 demonstrates that levels of attendance improved among Year 1 pupils in the Foundation Phase (FP In) compared to those who were not covered by the Foundation Phase (FP Out). Levels of attendance are also estimated to be higher among Year 1 pupils in both the Pilot and Early Start schools, but these differences are not statistically significant.
4.18 Model 2 repeats the analysis on the Final Roll-out schools only. Once again it is estimated that attendance improves by 0.4%. Analysis of the NPD data reveals that pupils attend school for approximately 370-375 sessions per year. An increase in attendance of 0.4% is therefore equivalent to approximately 1.5 sessions. Within Early Start schools there is also the opportunity to compare children who were covered by
the Foundation Phase to those who were assessed via the KS1 National Curriculum. No statistically significant differences are
observed between these two groups, either among Year 1 (Model 3) or Year 2 pupils (Model 4).
4.19 Due to the different modelling techniques used, the results relating to unauthorised absence are interpreted differently. The concept of ‘relative likelihood’ is fundamental to the interpretation of the results presented in this section. Before presenting these results, we describe what we mean by risk. In Table 6 it was demonstrated that within Final Roll-out schools, approximately 52% of Year 1 pupils that were eligible for FSM were recorded as having an unauthorised absence. By
comparison, 27% of pupils who were not eligible for FSM had an unauthorised absence. We therefore observe, based upon a
comparison of rates of unauthorised absence, pupils in receipt of FSM exhibit a higher relative likelihood of unauthorised absence. An
alternative way of expressing this increased risk of absence is to say that relative to those who are not eligible for FSM, those who are eligible are approximately twice as likely (52% divided by 27%) to have an unauthorised absence. Alternatively, those pupils eligible for FSM are approximately 100% more likely (52% minus 27% expressed as a percentage of 27%) as non-FSM pupils to have an unauthorised
absence. This is how estimates of relative likelihood that are estimated from the regression analysis are presented in the Lower Panel of Table 7.
4.20 Across the full sample of Year 1 children (Model 5), the incidence of unauthorised absence appears to have fallen amongst Year 1 pupils within Final Roll-out schools who followed the Foundation Phase (FP In) when compared to Year 1 children in these schools who were not in the Foundation Phase (FP Out). After controlling for the characteristics of pupils and schools, pupils within the Foundation Phase are
absence within Pilot schools, with a 15% increased risk of unauthorised absence among those children who were covered by the Foundation Phase.
4.21 Analysis therefore suggests that the introduction of the Foundation Phase within Final Roll-out schools has been associated with a
reduction in the incidence of unauthorised absences. However, this is contradicted by results derived for Early Start schools. The higher relative risk of unauthorised absence among children in Early Start schools who were in the Foundation Phase (a 71% increased risk) compared to those children who left these schools prior to Foundation Phase based assessments (53%), raises the possibility that the
introduction of the Foundation Phase within Early Start schools has contributed to an increase in the incidence of unauthorised absence. This is examined in further detail in Models 7 (for Year 1 pupils) and 8 (for Year 2 pupils). Comparing the situation of children within Early Start schools, the introduction of the Foundation Phase is estimated to be associated with an increased risk of unauthorised absence of between 25-30%, although this differential is not estimated to be statistically significant among either group of pupils. Such
inconsistencies could reflect their particular circumstances, with the Foundation Phase being introduced within relatively deprived schools during the Early Start Stage of the roll-out.
Counterfactual Impact Analysis of the Foundation Phase on Absenteeism
4.22 Among children in the Pilot and Early Start schools, participation within the Foundation Phase can be viewed as a treatment whereby their participation (treatment) could favourably or adversely affect an
outcome measure, such as attendance. Any appraisal of these impacts ideally requires an account of what would have happened to these children in Pilot and Early Start schools if they had not participated in the Foundation Phase (known as the counterfactual). A worthwhile
counterfactual therefore implicitly defines a control group or sample whose experiences accurately reflect the hypothetical, unobserved outcomes for the treatment group. A limitation of the regression
analyses described above is that, in some instances, the effect of being a pupil within a Pilot or Early Start school was being evaluated in
comparison to the wider population of non-Foundation Phase children. Pupils who were not characteristic of the children attending Pilot or Early Start schools were contributing to the analysis of observed relationships. If the Foundation Phase was implemented within
particular types of schools during its early inception, it would be more appropriate to restrict comparisons of absenteeism to only include schools and pupils who share similar characteristics to those attending the Pilot or Early Start schools.
4.23 The analysis of Chapter 2 suggests that schools among both the Pilot Stage and, in particular, the Early Start Stage were not selected at random and were therefore not representative of the wider population of primary (or infant) schools in Wales. Both groups of schools had a higher incidence of children with SEN and who were eligible for FSM. The effect of the Foundation Phase should therefore be examined with respect to Final Roll-out schools that share similar characteristics to the Pilot and Early Start schools.
4.24 Statistical matching techniques have been developed to provide methods for defining control groups and evaluating treatments in the absence of an initial ideal experimental allocation (see Rosenbaum, 2002; Caliendo and Kopeinig, 2008 and Peel and Makepeace, 2010 for introductions to statistical matching). The idea behind statistical
matching is simply to select a group of children in a way that makes them resemble the participants in the Foundation Phase in every respect, except for the fact of receiving the treatment. If this is done accurately then the outcome observed for the matched group
effect of the treatment (or intervention) is then straightforwardly
estimated as the difference between the average outcomes of the two groups. A more detailed overview of statistical matching (referred to as Propensity Score Matching (PSM)) is presented in Appendix B.
4.25 There are a number of different PSM techniques that can be applied. In the simplest case of the ‘nearest neighbour’ method, the control group is created by matching each treated person to the untreated person with the closest characteristics (as identified by the nearest propensity score). This technique may be refined by imposing a minimum
acceptable difference in scores (a calliper) and allowing an untreated person to be matched to only one treated person (matching without replacement) or more than one treated person (matching with
replacement)8. There is no objective ‘test’ of the correct method to be used and judgements are required to be made in the context of the characteristics of the datasets being matched. In the present analysis, we utilise nearest neighbour matching techniques that are conducted both with and without replacement and which employ different callipers in order to examine the sensitivity of the estimated results to the choice of specification. Statistical matching is implemented at the level of the individual pupil, although some matching variables are measured at school level. The same control variables used in the multivariate
analysis of attendance described above (see paragraph 4.15), are also used for the purposes of statistical matching.
4.26 The analysis is restricted to Early Start schools as it is only within these schools that comparisons of absenteeism can be made among pupils who were assessed both before and after the introduction of the
Foundation Phase. In theory, if statistical matching is implemented with a rich array of explanatory variables that can accurately account for the characteristics of pupils and schools, then there should be no
8
The statistical matching techniques employed here estimate approximate standard errors associated with treatment effects assuming independent observations. Clustering effects within schools is not taken in to account, but will be a focus of future analyses.
requirement for both ‘before’ and ‘after’ comparisons. In practice, the NPD only contains relatively limited information about the observable characteristics of pupils and schools. Therefore, many characteristics that could be associated with absenteeism remain unobserved. Even with richer data, it would be difficult to account for unobservable characteristics that may be associated with schools agreeing to participate in the early stages of the roll-out of the Foundation Phase, such as levels of motivation and commitment among staff. The ability to contrast the outcomes of Foundation Phase schools both before and after the introduction of the Foundation Phase therefore provides the opportunity to account for such selection effects.
4.27 The analysis includes both Year 1 and Year 2 pupils. The baseline year is 2007/08, during which all Year 1 and Year 2 pupils in Early Start schools will still have been assessed via KS1 of the National
Curriculum. The analysis for this year, therefore, provides a baseline comparison of levels of absenteeism of pupils in Early Start schools prior to the implementation of the Foundation Phase with ‘matched’ pupils from Final Roll-out schools. To consider the effect of the implementation of the Foundation Phase, the analysis is repeated for the 2009/10 school year. This year is the last year among Final Roll-out schools where both Year 1 and Year 2 children were still due to be assessed against the KS1 National Curriculum (reception children were the first cohort that were to be assessed via the Foundation Phase). By 2009/10, all pupils within Early Start schools would have been
assessed against the End of Foundation Phase Assessments.
4.28 The results of the PSM analysis are presented in Table 8. Estimated differentials are presented, and the matched sample sizes that
higher (0.7-1.3 percentage points) than those observed among a comparable sample of matched children from Final Roll-out schools. This differential remains unchanged in 2009/10, suggesting that the introduction of the Foundation Phase in Early Start schools has not influenced overall levels of absenteeism. In terms of unauthorised absence, it is again observed that the Early Start schools had a higher proportion of children who were recorded as having had at least one unauthorised absence. This differential is estimated to be
approximately 7-10 percentage points. It is noted that this matched differential is lower than the unmatched differentials presented in Table 6, which were of the order of 25-30 percentage points. This underlines an important aspect of statistical matching in terms of producing a more ‘balanced’ sample against which the effect of an intervention can be compared.
4.29 By 2009/10, the size of this differential increases to approximately 14-20 percentage points, indicating that compared to a matched sample of pupils from Final Roll-out schools, the introduction of the Foundation Phase within Early Start schools has contributed to a relative increase in the incidence of unauthorised absence. This result may appear to contradict the finding derived from the multivariate analysis in Table 7 that the introduction of the Foundation Phase was associated with a reduction in unauthorised absence among Year 1 pupils in Final Roll-out schools. However, it must be noted that the Counterfactual Impact Analysis is conducted within the context of the characteristics of the Early Start schools; i.e. schools within relatively deprived locations. The average effect of the Foundation Phase on absenteeism may differ to the effect estimated within Early Start schools due to the atypical nature of these schools.
Table 8: PSM Analysis of the Effect of the Foundation Phase on Absenteeism
Calliper
None 0.001 0.0001 Estimated % Point Differential Relative to Matched
Control Group
Sessions Present 2007/08
No replacement 0.68** 0.78*** 0.74**
(1,730) (1,605) (1,276)
With replacement 1.28** 1.20* 1.19*
(1,730) (1,715) (1,517)
2009/10
No replacement 0.57** 0.61** 0.99***
(1,745) (1,679) (1,244)
With replacement 1.33** 1.41** 1.55**
(1,745) (1,704) (1,612)
Unauthorised absences 2007/08
No replacement 7.63*** 7.41*** 7.76***
(1,730) (1,605) (1,276)
With replacement 9.88*** 10.26*** 8.37**
(1,730) (1,715) (1,517)
2009/10
No replacement 15.36*** 14.06*** 9.65***
(1,745) (1,679) (1,244)
With replacement 21.20*** 19.66*** 19.35***
(1,745) (1,704) (1,612)
* p<0.10, ** p<0.05, *** p<0.01
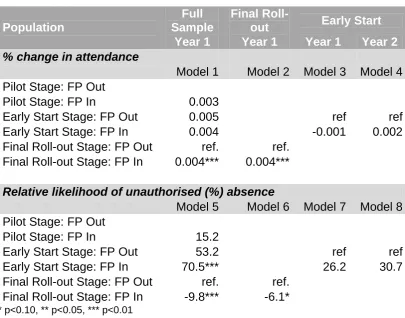
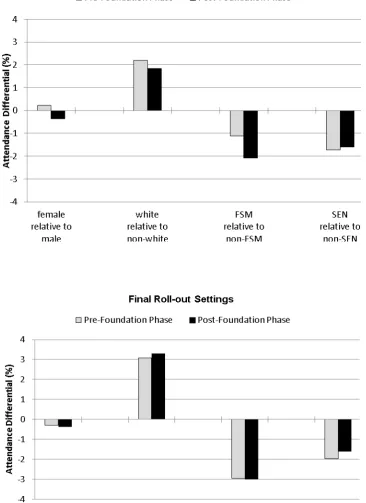
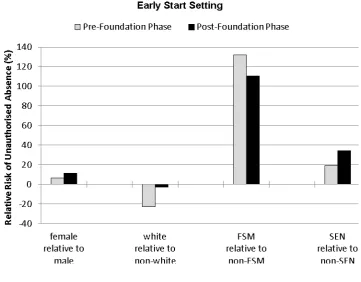
Inequalities in Absenteeism
4.30 The final section in this Chapter presents estimates derived from the multivariate analysis described above that relate to the inequalities in absenteeism that exist between different population sub-groups.
these Foundation Phase assessments. The analysis of Early Start schools includes pupils from both Years 1 and 2. The analysis of Final Roll-out schools is restricted to Year 1 pupils as no absenteeism data is yet available for Year 2 pupils.
4.32 For ease of exposition, the results of the analysis are presented graphically in Figures 2 and 3. The results for these two groups of pupils are shown side-by-side in the figures so that the effect of the introduction of the Foundation Phase on inequalities between different groups can be assessed. The bars are presented as groups of
categories representing different individual characteristics (e.g. gender, ethnicity). Within each group, one category is chosen to act as a
reference category against which the effects of other categories can be evaluated. For example, the effect of eligibility to FSM on absenteeism is evaluated relative to those pupils who are not eligible to FSM.
4.33 The analyses of overall levels of absenteeism (Figure 2) reveal that after controlling for other characteristics, levels of attendance are significantly higher among white than non-white pupils. In terms of unauthorised absence (Figure 3), the analysis reveals that those pupils in receipt of FSM are particularly susceptible to experience one or more periods of unauthorised absence. Both figures reveal that the patterns of inequality that existed prior to the introduction of the Foundation Phase persist following its introduction.
Figure 3: Inequalities in Absenteeism – One or More Unauthorised Absences
5 Comparing Key Stage 1 and Foundation Phase Outcomes
Introduction
5.1 The introduction of the Foundation Phase was accompanied by change in the methods by which pupils were assessed at the end of Year 2 (age 7). Those who were previously assessed according to the KS1 National Curriculum were graded to one of 6 levels, including working towards Level 1, Level 1 and so on up to Level 5. These grades were awarded for maths, science, English and Welsh. In practice, only a very small number of pupils achieved Level 4 or Level 5 by the end of Year 2. A majority of pupils achieved Level 2 in each of these subject areas, Level 2 being the expected level of attainment of Year 2 pupils.
5.2 Conversely, in the End of Foundation Phase Assessments pupils are graded to one of 7 levels (including working towards Level 1, Level 1 and so on up to Level 6) for Personal and Social Development, Well-being and Cultural Diversity Outcomes (PSDWC), Language, Literacy and Communication Skills (LLC) and Mathematical Development (MD). In English-medium schools, pupils are also assessed against the Welsh Language Development (WLD) area of learning. It is only a statutory requirement for schools to compile and report Foundation Phase assessments in two areas of learning, LLC and MD – and these are the focus of this analysis. Under the Foundation Phase, the
majority of Year 2 pupils are expected to achieve Level 5.
Assessing Comparability of Year 2 Outcomes
remaining majority of schools did so during the summer of 2012 – these outcomes will be available in a subsequent report by the evaluation team).
5.4 Welsh-medium schools are identified on the basis of whether or not they conducted assessments for Welsh at KS1. Welsh-medium schools cannot be identified via the Foundation Phase outcome data as no distinction is made regarding the medium through which Language, Literacy and Communication Skills are assessed. The KS1 based marker is therefore retained to distinguish between English and Welsh-medium schools following the implementation of the Foundation Phase. The analysis is also restricted to English, Welsh and Maths at KS1 and their nearest Foundation Phase subject equivalents; i.e. Language, Literacy and Communication (LLC) and Mathematical Development (MD).
5.5 It can be seen from Table 9 that the introduction of the Foundation Phase has resulted in a discontinuity in assessment data. As a result, it is difficult to assess whether the introduction of the Foundation Phase has resulted in improved outcomes at the end of Year 2.
5.6 It is apparent that fewer pupils achieve the expected level at
Foundation Phase (Level 5) than those who achieved the expected level at KS1 of the National Curriculum (Level 2) in these same
schools. The scale of this differential varies across subject areas, but it is generally of the order of 10 percentage points (a relatively narrow differential of 3 percentage points is observed for assessments in English/LLC in English-medium schools). Although it is conceivable these differences could reflect the lower ability levels of pupils undertaking the Foundation Phase, closer examination of the data suggests that the cause of this discontinuity appears to be related to the greater degree of gradation in the assessment levels available through the Foundation Phase. It appears that the availability of more detailed assessment categories at the lower end of the ability range
has encouraged the more frequent use of lower level assessment categories compared to the relatively limited range of ability levels available through the KS1 assessments.
5.7 Evidence for this downward bias in teacher assessments at Year 2 following the introduction of the Foundation Phase, is provided by comparing the level of continuity between outcomes at KS1 to KS2 with the level of continuity between Foundation Phase Assessments to KS2 outcomes.
5.8 At the time of writing, such an analysis can only be undertaken for pupils who attended Pilot schools. Insufficient time has yet to elapse for those pupils who have been assessed via the Foundation Phase within Early Start schools to also be assessed at KS2.
5.9 In Tables 10 (maths) and 11 (English) it is observed that there is a clear association between attainment at KS1 and KS2. For pupils who attained Level 1 at KS1, a majority went on to attain Level 3 (or below) at KS2. A similar relationship emerges between KS1 Level 2 and KS2 Level 4, and between KS1 Level 3 (or above) and KS2 Level 5 (or above).
36
Table 9: Comparing Key Stage 1 and Foundation Phase Assessments
National Curriculum Key Stage 1 Foundation Phase
English-medium Welsh-medium English-medium Welsh-medium
Level
English Maths Welsh English Maths Level LLC MD LLC MD
Disapplied 0.3 0.3 0.4 0.3
Not awarded 0.1 0.1 3.6 0.1 0.2
Towards Level 1 0.1 0.1 0.1 0.1
Level 1 0.3 0.3
Level 2 0.9 1.0 0.1
Towards Level 1 5.3 3.4 2.7 2.8 1.5
Level 3 4.1 5.8 5.6 3.3
Level 1 17.5 15.4 10.6 16.4 13.8 Level 4 21.0 22.7 21.6 21.5
Level 2 63.9 67.9 68.1 68.6 67.7 Level 5 59.0 53.9 56.0 55.3
Level 3+ 12.9 12.9 15.1 11.7 16.5 Level 6 14.7 16.3 16.6 19.8
% achieving expected Level (2+)
76.8 80.8 83.2 80.3 84.2
% achieving expected Level (5+)
73.7 70.2 72.6 75.1
Total 100 100 100 100 100 Total 100 100 100 100
Table 10: Continuity Between Key Stage 1 and Key Stage 2 Maths Assessments
Key Stage 2
Level<=3 Level 4 Level 5 Total
Key Stage 1
Level 1 71.5 27.8 0.7 100
Level 2 17.6 65.0 17.4 100
Level 3 0.8 34.9 64.3 100
Total 25.3 52.9 21.7 100
Foundation Phase
Level 1 (FP<=4) 50.6 46.0 3.4 100
Level 2 (FP 5) 6.7 71.5 21.8 100
Level 3 (FP6) 0.0 30.9 69.2 100
[image:47.595.90.425.385.576.2]Total 19.2 56.9 23.9 100
Table 11: Continuity Between Key Stage 1 and Key Stage 2 English Assessments
Key Stage 2
Level<=3 Level 4 Level 5 Total
Key Stage 1
Level 1 67.4 32.6 0.0 100
Level 2 15.5 68.4 16.0 100
Level 3 0.0 37.8 62.2 100
Total 20.6 57.9 21.5 100
Foundation Phase
Level 1 (FP<=4) 46.6 50.2 3.2 100
Level 2 (FP 5) 5.6 65.2 29.2 100
Level 3 (FP6) 0.0 35.2 64.8 100
Total 17.8 56.4 25.9 100
5.11 However, the strength of the relationship between attainment at Level 4 (or below) of the Foundation Phase and Level 3 (or below) at KS2 is weaker than that which existed at KS1. Almost half of pupils who attained Level 4 or below at the Foundation Phase (less than the
of the Foundation Phase is greater than the ability of children from these Pilot schools who were previously allocated to Level 1 of KS19.
5.12 A further side effect of this is that those assessed at Level 5 of the Foundation Phase are also more likely to achieve Level 5 at KS2 compared to those previously assessed at Level 2 of KS1. These patterns are consistent across both English and maths. The effect of participation in the Foundation Phase on outcomes in KS2 is explicitly considered later in this report.
Inequality in Year 2 Outcomes
5.13 The previous analysis has indicated that levels achieved via teacher assessments at KS1 are not straightforwardly comparable to those achieved through the Foundation Phase. It is therefore not possible to provide a simple assessment as to whether Year 2 outcomes have improved under the Foundation Phase. However, whilst differences in the levels of attainment cannot be assessed, it is still informative to consider whether inequalities in outcomes between population sub-groups have widened or narrowed following the introduction of the Foundation Phase. Tables 12 (maths) and 13 (English) show the proportion of pupils within the three types of schools who achieved the expected level at Year 2. For children outside of the Foundation Phase, this relates to KS1 Level 2 or higher. For those children who were assessed via the Foundation Phase, this relates to FP Level 5 or higher. The analysis is restricted to English-medium schools to enhance the level of comparability between KS1 and Foundation Phase subject areas.
5.14 The analysis in Tables 12 and 13 confirms that Pilot and Early Start schools are relatively disadvantaged compared to Final Roll-out
9
Although there is another interpretation of these comparisons relating to the ‘effect’ of the Foundation Phase on later KS2 outcomes. However, this is considered further later in the report.