CONTENTS
PAGE
Preface
2
Executive Summary
3
1 Introduction
5
2 Fit-for-purpose technology, systems and resources
6
●
Developments in schools
6
●
Developments in the learning and skills sector
13
3 Capability and capacity of the workforce, providers
19
and learners
●
Developments in schools
20
●
Developments in the learning and skills sector
31
4 Efficiency, effectiveness and value for money across
41
the system
●
Developments in schools
42
●
Developments in the learning and skills sector
50
5 Improving learner and system performance
54
●
Developments in schools
55
●
Developments in the learning and skills sector
62
6 Progress, impact and strategic challenges
66
2
There are many encouraging signs of progress and a growing evidence base demonstrating positive impact of technology and educational ‘e-maturity’ on a range of outcomes. We are now better able to understand and describe technology-related strategies which deliver benefits, and to identify priorities for the leadership of technology in education at national and local level.
Through this growing evidence base, Becta is enabled to provide strategic advice and guidance to its key stakeholders. Continuing discussions with these stakeholders and with national
organisations supporting change in education and the skills sector, will help us to ensure that the use of technology supports the development of an education and skills system which is fit for the 21st century.
Stephen Crowne
Chief Executive
PREFACE
Welcome to the Harnessing Technology Review 2007, a strategy-level review of what current research and evidence tells us about using technology for the benefit of learners. This publication builds on the Becta Reviews of 2005 and 2006, focusing discussion closely on the ambitions of the government’s e-strategy, Harnessing Technology.
The Review has three parts:
● A summary which identifies the main messages drawn from the evidence ● A detailed review of the evidence and its
implications
● An analysis of strategic issues and challenges.
3
EXECUTIVE SUMMARY
Use and impactTeachers and pupils are highly positive about the impact that using technology can have on motivation and engagement. However, in the schools sector, the widespread use of interactive whiteboards and display technologies, although highly motivating for learners, has led to a focus on using technology predominantly for whole class teaching, rather than for supporting independent or small group learning. While developments in the use of technology to support more personalised learning are evident, they are at an early stage. Technology is most often used to ‘push out’ resources and the opportunity for learners to choose their own pathways through them is rarely offered.
Moreover, while there is increasingly strong evidence that the use of ICT helps raise educational standards, this is dependent on the context in which the technology is used. This is especially true of interactive whiteboards, where impact on attainment relates to the precise nature or amount of use, and the extent of embedding into learning and teaching practices.
Professional development
The idea of using ICT, at least in some part of the teaching and learning process, is now commonplace in most schools and colleges. Teachers and lecturers prepare lessons using ICT, exploit presentation software and word processing and may expect students to access and use online resources and course documents.
Few practitioners, however fully exploit the possibilities for learning and teaching offered by technology, especially learning platforms, and although 46 per cent of secondary schools report having one, only 24 per cent of teachers report using it.
Schools have in place a range of technologies to facilitate access to shared ICT resources, but the amount of resource sharing and collaboration within the school, and at local and regional level, is currently limited. In contrast, there is evidence of collaboration in the FE and skills sector, often encouraged by the tradition of ‘in house’ resource development and a more limited commercial software market.
While the growing use of ICT by teachers indicates an increase in their competence with technology, teachers continue to seek training in specific technologies and are increasingly discriminating in both the topics and format of the professional development available to them.
This review provides an overview of ICT use in education based on the evidence available in 2007. Following several years of significant investment in infrastructure and connectivity, in improving learner:computer ratios and in promoting purchase of software to support learning through e-Learning Credits, the current picture is one of slower incremental growth, and a reaching of a plateau in some sectors.
Access to technology
The learner:computer ratio continues to improve, particularly in secondary schools, assisted by the growing availability of laptops and wireless networks. The use of ICT resources in lessons by teachers has continued to grow, both in schools and FE colleges, driven to a large extent by the adoption of interactive whiteboards and related technologies. Schools are also beginning to provide access to their networks from remote locations for staff and pupils. In secondary schools and FE colleges, learning platforms give practitioners and learners access to growing repositories of digital resources, increasing the range and quality of materials available.
In the FE sector, the learner:computer ratio is largely unchanged from the previous year. However, unlike the schools sector where adoption and use of learning platforms is slow, in FE the adoption and use of VLEs continues to grow, though the majority of colleges still fail to use this as their main platform. There is a noticeable increase in remote access to learning, which suggests a trend to allow learners access to their programmes at a time and place to suit them, but the primary function of learning platforms continues to be as repositories for course materials and resources.
4
Integration of systems
There have been improvements in connectivity and access to the internet in both schools and colleges, with improved reliability of connection giving practitioners increased confidence to use the technology live in the classroom. ICT for administration and management has also developed considerably in both sectors. The use of electronic attendance and registration systems is high in schools and there is evidence that they reduce both the number of
unauthorised absences and administrative time.
However, although schools have begun to appreciate the improved effectiveness and reduced costs that can result from centralised systems, few have achieved full integration of their curriculum and administration systems, and there is still considerable potential for further productivity gains by using ICT to support information management and assessment.
Interoperability issues still prevent further improvements in the use of technology, with schools and colleges facing the challenge of effectively integrating their management and learning systems. The effective information sharing and exchange that is needed to support child protection is still at an early stage of development in most schools and local authorities. Even when this underlying capability is in place, institutional and professional practice in using data to support learners needs to be encouraged and nurtured.
Strategic issues and challenges
A growing body of evidence demonstrates links between e-maturity and educational
improvement. Building e-maturity continues to be a challenge, however, both to schools and the FE and skills sector, and there is wide variation in its development. Achieving the benefits of learning platforms, and their integration with management information systems, is still some way off for the majority of schools and colleges, and they require ongoing support in recognising and realising these benefits.
Technology issues
Technical support continues to be an issue, particularly in primary schools, and the experience of broadband access is still inadequate in many schools. Linkage between learning platforms and
management information systems remains a problem.
Teaching and learning
Three quarters of teachers rarely or never use technology to support learners working together. Use of technology needs to become secondary to a larger learning and teaching agenda in which learners develop a wider range of skills and gain access to a more personalised curriculum.
Increased use of a range of technologies calls for new approaches to learner support and management, and with them, new approaches to professional development.
The challenge is that of developing the use of technology from enhancing and enriching learning to also extending and empowering it, developing a broader repertoire of practitioner skills.
Continuity of learning
Use of technology to support effective continuity of learning is still at an early stage, particularly in the schools sector. Issues of home access still need to be addressed, and both schools and colleges have some way to go in making educational information and resources accessible to learners (and their families) at times and locations that suit their learning preferences and choices.
Developing awareness and understanding of what technology-supported continuity of learning looks like for different learner groups and sectors is essential.
Partnerships
Continued investment in technology now enables schools, colleges, work-related learning and local agencies to share information and resources, and to gain better value for money in procurement. However, partnership working is still in its infancy and requires significant changes in working practices in order for the benefits to be realised.
Promoting awareness and models of maturity in the use of ICT is central to helping to increase the number of educational
organisations making effective use of ICT. Continued clarity and coherence of vision and leadership is essential at all levels in the system, and Becta will continue to provide strategic co-ordination and guidance to ensure that the power of ICT is harnessed to benefit all learners.
5
1
March 2005 saw the publication of the
Government’s e-strategy, Harnessing Technology, which set out a system-wide approach to the application of ICT in education, skills and children’s services. It sought to apply technology to transform the way in which educational institutions operate and are managed, and the way they connect with each other and enable interaction, for the benefit of learners, parents and carers. Technology should fulfil its potential as a critical enabler of educational change, directly supporting and connected with other government strategies including the DfES’s (now DCSF/DIUS) five-year strategy and the personalisation agenda.
The last 12 months have seen translation of the e-strategy into a single delivery plan (Becta, 2006a). This clarified the desired outcomes of the strategy, grouping them in a ‘balanced scorecard’ under the themes of:
● Fit for purpose technology, systems and resources ● Capability and capacity of the workforce,
providers and learners
● Efficiency, effectiveness and value for money across the system
● Improving learner and system performance.
This review broadly follows the same structure, gauging the extent to which there has been progress in meeting these outcomes in schools and the learning and skills (post-16) sector in England. Where comparative data is available, it is provided for the UK and from work carried out by the Organisation for Economic Co-operation and Development (OECD) and the European Commission.
The analysis presented in this review draws on recent surveys and research studies including:
● national statistics and large-scale and national level surveys
● national and large-scale research studies of ICT implementation and use
● projects to evaluate national ICT programmes ● inspection data and reports from Ofsted ● systematic reviews of literature relating to ICT
and education.
The final section charts overall progress and issues and challenges arising from this review in the context of the e-strategy and the Government’s wider ambitions for the education and skills sectors.
INTRODUCTION
Figure1.1: The strategic outcomes of the e-strategy
1.1 Leaders have the knowledge and skills to ensure technology for learning can be harnessed for the benefit of learners 1.2 Institutions and providers plan
and manage technology for learning effectively and sustainably
1.3 Practitioners exploit technology consistently to offer engaging and effective learning experiences
1.4 Practitioners, parents and learners can share and use information and data effectively for the benefit of learners 1.5 Improved learner capability in
using technology to support their learning
Capability and capacity of the workforce, providers and learners
2.1 All learners and practitioners have access to the appropriate technology and digital resources they need for learning
2.2 Every learner has a personalised learning space to enable them to learn when and where they choose
2.3 Technology-enabled learning environments are secure, supported and interoperable 2.4 There is a dynamic, vibrant and
responsive technology for learning market that can meet the needs of the system
Fit for purpose technology and systems
3.1 There is greater choice in learning opportunities and modes for all learners 3.2 Learners have increased
motivation for engagement in learning
3.3 Fewer learners under-perform or fail to succeed in education 3.4 An improvement in the quality
of learning provision is accelerated
3.5 There is improved child safety and child protection
Outcomes and benefits for learners and children
4.1 Learning providers collaborate and share information and resources
4.2 The management and administration of learning and institutions is more efficient 4.3 There is a greater level of
effective, learner-focused, assessment for learning 4.4 Practitioners collaborate and
share good practice and learning resources
4.5 There is good use of information to support learner transitions between institutions and sectors
6
2
Key points
Continuing investment has produced
improvements in the technology infrastructure in schools, with greatest improvement in the pupil:computer ratio in secondary school. There has been particular growth in the availability of laptops, with the increase often linked to the availability of wireless networks.
While in the past colleges have had a particular challenge in maintaining the currency of their infrastructure, and the demand created by increasing student numbers, the number of FTE students has stabilised in 2006, and the
student:computer ratio has remained largely the same.
In colleges, around three quarters of computers are sited in classrooms, restricting how they may be used to those times when classes are scheduled. While open-access provision allows some use out of class time, this provision has remained relatively constant over the last few years.
There have been improvements in connectivity and access to the internet in schools and colleges, with improved reliability of connection giving practitioners increased confidence to use the technology live in the classroom. There is still a need to develop practice to gain full value from broadband use in classrooms.
Schools still have a way to go in achieving full integration of their curriculum and administration systems. The integration of learning platforms with management systems remains an issue in both sectors.
The rapid growth in interactive whiteboards has continued, in all sectors, with the most marked increase being in secondary schools. They continue to be a focus of future spending and growth in schools and do not appear to have reached a plateau yet.
Learning platform availability continues to increase. However, overall levels of adoption remain relatively low, with their presence still more prevalent in secondary schools than primary. In colleges, college networks and intranets still serve as the main platforms.
While technical support remains an ongoing issue for schools, there is evidence that institutions are developing effective models for addressing the issue and seeing it as a high priority in future ICT spending. Where effective technical support is provided ICT confidence among staff is improved.
The last 10 years have seen considerable Government investment to provide a reliable and high-quality ICT infrastructure. In addition to standard technology funding to schools through capital and revenue streams, major capital investment has been made through the Building Schools for the Future (BSF)
programme.
This section considers the impact of these developments in terms of:
● access to, and the development of, technology and digital resources ● effective deployment of technology and
digital resources to deliver learning environments which are integrated, secure and well supported.
FIT-FOR-PURPOSE TECHNOLOGY, SYSTEMS AND RESOURCES
DEVELOPMENTS IN SCHOOLS
Access to technology
Pupil to computer ratios
The pupil-to-computer ratio continued to improve on previous years. The secondary school ratio was 3.6 pupils per computer while in primary schools the average was 6.2 pupils per computer.
Kitchen et al. (2007) reported an increase in the availability of laptops in both primary and secondary schools, with availability in 90 per cent of primary schools (with an average of 14 per school) and 95 per cent of secondary schools (with an average of 77 per school).
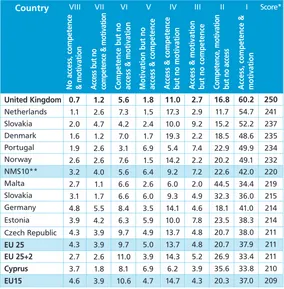
By comparison, in 2006, the pupil:computer ratio in schools in the EU was 9.9:1. There has been an increase in computer availability since the last measurement in 2001. At that time, the average
7
figure (measure) for 15 EU countries was 12.5:1. By 2006, the level for this group of countries was 8 pupils per computer.
While computer:pupil ratios provide an indication of potential availability, they do not give the full picture in terms of access, which needs to include location of computers, their availability to support learning and teaching and issues such as portability.
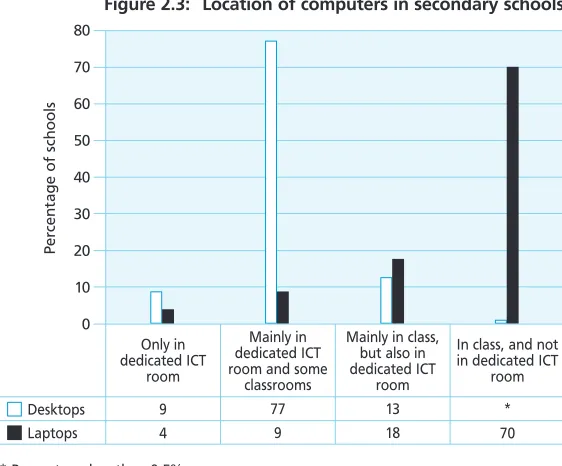
Location and availability of computers
Schools tend to deploy desktop computers mainly in ICT rooms while laptops tend to be deployed in general classrooms. In around half of primary schools, desktop computers were located mainly in ICT rooms and over three quarters of desktops in secondary schools were available in this way. In 18 per cent of primary schools and 13 per cent of secondary schools, desktops were mainly in classrooms and some in dedicated ICT rooms. (Kitchen et al., 2007).
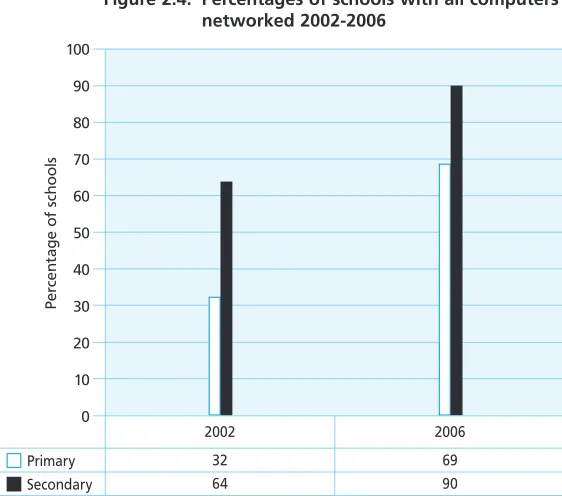
Networked classrooms and wireless networks
The improvements in networking in both primary and secondary schools, reported in the Becta Review 2006, have continued. However, as figure 2.4 shows, a third of all computers in primary schools are not connected to the internet (Kitchen et al., 2007).
Kitchen et al. (2007) found that 82 per cent of secondary and 49 per cent of primary schools now have some level of wireless network. The most common reason for implementing wireless is to support the use of ICT in classrooms other than ICT suites.
Supporting technologies
The range of supporting technologies has continued to expand and has in turn enhanced progress in embedding the use of ICT across the curriculum (Ofsted, 2005a).
Interactive whiteboards
The rapid spread of interactive whiteboards continued, with the most marked increase in secondary schools, where the average number per school has increased from 18 in 2005 to 22
Source: ICT in schools survey 2004 (Prior and Hall, 2004), and Computer:Pupil Ratio from Pupil Level Annual School Census 2005 and 2006
Figure 2.1: Number of pupils per computer used for learning and teaching 2000–2006
Primary Secondary
2000
12.6 7.9
2001
11.8 7.1
2002
10.1 6.5
2003
7.9 5.4
2004
7.5 4.9
2005
6.7 4.1 14
12
10
8
6
4
2
0
Mean
number
of
pupils
per
comput
er
2006
6.2 3.6
Denmark Norway Netherlands
United Kingdom
Luxembourg Sweden Finland Austria Iceland France
EU25 average EU15 average
Table 2.1: Number of computers per 100 pupils in European Schools 2006 *
26.8 22.7 20.0
18.5
18.3 16.6 16.2 14.2 14.8 8.9
9.9 10.8
27.3 24.2 21.0
19.8
19.6 17.4 16.8 16.2 15.8 12.6
11.3 12.1
1 2 3
4
5 6 7 8 9 10
* Only includes computers at schools available to students for educational purposes. Source: Benchmarking Access and Use of ICT in European Schools (Head teacher Survey), Commission Services, European Commission (2006)
Country Number of computers
Overall rank for number of computers Number of
internet-connected computers
in 2006 (Kitchen et al., 2007). All primary schools surveyed reported that they now had an interactive whiteboard, compared with 39 per cent in 2002.
8
cent) of primary school leaders reported this as a priority (Kitchen et al., 2007).
Mobile technologies
Mobile technologies are growing in availability and have been introduced to support various educational activities, usually with a focus on communication. Pupils can gain greater control over where and when they learn and use of mobile technology is helping to blur the division between in- and out-of-school learning (Condie et al., 2006).
Portable devices have been effective in
supporting learning for disaffected and ‘hard to reach’ pupils, where attending school is
problematic for personal or other reasons. However, some challenges remained to the ability to deploy and integrate mobile technologies easily into educational
environments. These relate in part to technical issues such as the restricted functionality of some mobile devices, the robustness of some technologies (such as PDA screens) and the battery life, in particular of Tablet PCs (Becta, 2006b).
Other supporting technologies
Supporting technologies are particularly important for pupils with special educational needs. In mainstream schools in 2004, 35 per cent of secondary and 19 per cent of primary schools had specialist equipment such as speech-recognition software and specialist peripherals (Becta, 2005a).
More recent data from Kitchen et al. (2007) relates to the provision of assistive technologies to support pupils with special educational needs. Some 44 per cent of primary schools reported owning one device with around a quarter having devices to support physical access and sensory access and 10 per cent having devices to support cognitive access. In secondary schools there was slightly higher availability, with around a half of schools with at least one device, a third with sensory access devices and physical access devices and a fifth with devices to support cognitive access. (Kitchen et al., 2007)
[image:10.595.288.572.199.427.2]Source: Harnessing Technology in Schools survey (Kitchen et al., 2007)
Figure 2.2: Location of computers in primary schools
Desktops Laptops
Only in dedicated ICT
room
5 1
Mainly in dedicated ICT room and some
classrooms 51
3
Mainly in class, but also in dedicated ICT
room 18 19
In class, and not in dedicated ICT
room
26 77 80
70
60
50
40
30
20
10
0
P
er
centag
e
of
schools
* Percentage less than 0.5%
Source: Harnessing Technology in Schools survey (Kitchen et al., 2007)
Figure 2.3: Location of computers in secondary schools
Desktops Laptops
Only in dedicated ICT
room
9 4
Mainly in dedicated ICT room and some
classrooms 77
9
Mainly in class, but also in dedicated ICT
room 13 18
In class, and not in dedicated ICT
room
* 70 80
70
60
50
40
30
20
10
0
P
er
centag
e
of
schools
Access to the internet
The Government set a target that every school should have access to a broadband connection appropriate to its circumstances and requirements by the end of 2006. The DfES suggested that this typically would equate to a synchronous connection of 2Mbps for primary schools and 8Mbps for secondary schools. By the last
[image:10.595.290.571.465.698.2]9
quarter of 2006, 99 per cent of primary and almost 100 per cent of secondary schools were connected at these speeds (Becta, 2006c).
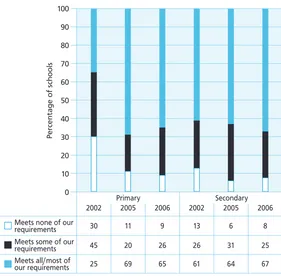
The speed and quality of the classroom connection to the internet has a significant impact on student access. Schools reported high levels of satisfaction with the speed of the internet connection in both primary and secondary schools (see Figure 2.6), although there has been a slight dip in satisfaction in primary schools. However, though the trend is improving, the figures suggest that, while there is good connectivity to the school, experience in the classroom is still variable. This is likely to be due to the quality of networking within the school.
There is evidence that schools are not yet fully exploiting the combinations of technologies and broadband services (Ofsted, 2004; Lewis et al., 2006). Reasons cited by teachers include a lack of knowledge about the services, a lack of support and difficulty in accessing the services.
Personalised learning spaces
The Government’s vision for education is one where every child and learner is offered personal support and advice as they progress through education sectors and on to
employment and lifelong learning. By 2008, every pupil should have access to a personalised online learning space with the potential to support an e-portfolio.
Progress on a number of technology and system developments is important in achieving this vision. Common approaches are developing to the storage and transfer of personal records across education and children’s services.
Learning platforms and e-portfolios
The adoption of learning platforms and e-portfolios is indicative of overall progress towards personalised online learning spaces. Learning platforms vary considerably but in general provide a range of ICT-based functions around communication and collaboration, content management, curriculum planning, and tools and services such as email, messaging, discussion forums and blogs.
Overall levels of adoption remain relatively unchanged from that reported in the Becta Review 2006, with their presence more prevalent in secondary schools than primary. Kitchen et al. (2007) reported figures of 46 per cent for secondary and 11 per cent for primary schools. Of schools which had not acquired a learning platform, 61 per cent of secondary and 41 per cent of primary schools intended to procure a learning platform in the next 12 months (Becta, 2007a). Reasons cited for not having a learning platform yet included finance, lack of knowledge and, particularly in the primary sector, that learning platforms were not appropriate to their school needs (Ibid).
[image:11.595.290.571.206.454.2]Source: Harnessing Technology in Schools survey (Kitchen et al., 2007)
Figure 2.4: Percentages of schools with all computers networked 2002-2006
Primary Secondary
2002
32 64
2006
69 90 100
90
80
70
60
50
40
30
20
10
0
P
er
centag
e
of
schools
Source: Harnessing Technology in Schools survey (Kitchen et al., 2007)
Figure 2.5: Number of interactive whiteboards per school (2002–2006)
Primary Secondary
2002
0.7 3.5
2005
6.1 18
2006
8 22.3 25
20
15
10
5
0
Mean
number
per
10
E-Portfolios are broader, personal online spaces which enable learners to store, organise and personalise information, collaborate and receive feedback. The picture in relation to e-portfolio adoption remains relatively unchanged in the primary sector, although there does appear to be progress in terms in the secondary school sector. About four-fifths (79 per cent) of secondary schools reported that they encourage use of e-portfolios in 2006. In most cases this use was said to be encouraged for ‘some pupils’ (55 per cent overall) rather than ‘all pupils’ (23 per cent) (Kitchen et al., 2007).
Extended learning and remote access to resources and services
In primary schools there has only been moderate progress towards establishing remote access to the school’s network. Only one per cent of primary schools allow access by pupils and nine per cent give access to senior teaching or administrative staff. There was far greater access to the school network in secondary schools for both senior staff (38 per cent) and pupils (27 per cent). (Kitchen et al., 2007).
The majority of primary schools and nearly all secondary schools provided pupils with some form of access to ICT facilities outside lesson times. However, while there has been an increase in formal provision, informal provision at
lunchtime and breaks has been levelling off or even declined.
Home access to ICT enabled by the school
Any form of remote access in the home generally relies on equipment provided by parents. Over half of households in Great Britain can access the internet from home, but this access varies with socio-economic group (National Statistics Survey, 2006). A national survey of 9–19-year-olds (Livingstone and Bober, 2005), found that 88 per cent of middle-class children had access to the internet at home compared to 61 per cent of working-class children. Libraries and internet cafés offer access to the internet, but they are not an effective substitute for a lack of home access to ICT (Valentine et al., 2005; Somekh et al., 2002).
ICT Test Bed Schools offered loans of equipment for use at home. These increased ICT skills for
[image:12.595.289.570.222.498.2]Source: Harnessing Technology in Schools survey (Kitchen et al., 2007)
Figure 2.7: Schools allowing access to the network from outside the school
Primary Secondary
Senior teaching/ admin staff
9 38
Other
4 31
No one has access
87 58 90
80
70
60
50
40
30
20
10
0
P
er
centag
e
of
schools
Pupils
1 27
Parents/carer
[image:12.595.291.572.528.774.2]0 5 Source: Harnessing Technology in Schools survey (Kitchen et al., 2007)
Figure 2.6: Speed of internet connections in schools 2002–2005
Meets none of our requirements
Meets some of our requirements
2002
30
45
25
2005
11
20
69
2006
9
26
65
2002
13
26
61
2005
6
31
64
2006
8
25
67 100
90
80
70
60
50
40
30
20
10
0
P
er
centag
e
of
schools
Meets all/most of our requirements
Primary Secondary
11
both pupils and parents and help bridge the digital divide by giving the majority of students access to computers at home. Pilot schemes run by Test Bed schools suggested a number of challenges that needed to be met or managed, including:
● lack of land lines in homes
● agreeing responsibility for technical support ● meeting ongoing costs of connectivity and
software
● capacity to manage the distribution of computers.
(Somekh, Lewin, Saxon et al., 2006)
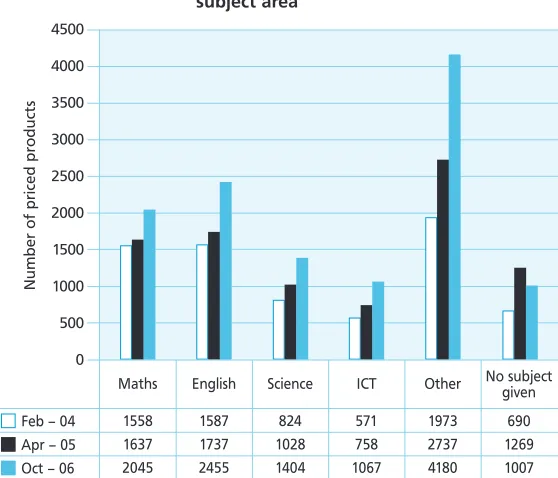
Access to digital resources
The number of products registered for e-learning credits continues to grow – an increase of 16 per cent from September 2005.
In addition, recent data shows considerable increase in the number of secondary school products targeted at the non-core subject areas, with greater increases in the number of products for secondary schools in the core subjects than the number for primary schools.
Resource availability and discovery
We have noted in previous reviews that the experience of teachers searching for resources was variable, inconsistent and often dissatisfying and that to address this required systemic improvements in the area of resource discovery. The organisation of resources was helped in Test Bed schools and colleges that had a storage and retrieval system. Individual teachers were familiar with this system which was efficiently managed and ‘tidy’ (Somekh, Lewin, Saxon et al., 2006).
Teachers in the Test Bed schools also reported that it was initially very hard work to establish and find useful resources to deliver the planned curriculum, but that this was worth while in terms of the resources that they now had available and could modify for re-use. (Somekh, Lewin, Saxon et al., 2006)
Commercial resources which gave structure to teacher resource development proved useful to
[image:13.595.293.572.536.775.2]Source: Curriculum Online Evaluation: Emerging findings from the third survey of schools (Kitchen, Mackenzie and Butt, 2006) and Harnessing Technology in Schools survey (Kitchen et al., 2007)
Figure 2.8: Forms of access to ICT resources outside lessons Primary Secondary Breakfast club Lunchtime club After school club Before school (informal) Lunchtime/ breaks (informal) After school (informal) Remote access None 90 80 70 60 50 40 30 20 10 0 P er centag e of schools 11 25 16 25 34 75 28 82 40 76 55 82 6 48 10 41 34 80 32 75 8 69 14 69 0 0 14 69 24 24 0 3 2005 2006 2005 2006 2005 2006 2005 2006 2005 2006 2005 2006 2005 2006 2005 2006
Source: Download of Curriculum Online database of registered products, CEPA calculations (Becta, 2007b)
Figure 2.9: Number of priced products by major subject area
Feb – 04 Apr – 05
Maths 1558 1637 2045 English 1587 1737 2455 Science 824 1028 1404 ICT 571 758 1067 Other 1973 2737 4180 No subject given 690 1269 1007 4500 4000 3500 3000 2500 2000 1500 1000 500 0 Number of priced pr oducts
12
primary teachers. These resources included clip-art, video clips and short lesson activities for teachers to manage. School/college cluster content creation teams were also reported as useful. (Ibid)
Effective deployment of ICT
Sustainability of provision
As schools’ computer stocks have increased over time, there is a parallel management issue of purchase, disposal and re-use of resources.
Test Bed schools had not planned at the start of the initiative for the continuation of projects once earmarked funding had come to an end.
However, as the Test Bed project developed, it became obvious to participating schools that longer-term planning was needed to secure sustainability of ICT provision to deliver continuing benefits from the initiative. Sustainability also came to be understood as more than the replacement of equipment: it was also the long-term embedding of pedagogic change.
The final ICT Test Bed report found that schools were able, with careful planning and effective procurement strategies, to deliver sustainable provision beyond the period of project funding (Somekh, Lewin, Saxon et al., 2006). However, 86 per cent of LAs expect a funding gap caused by a decrease in funding or rising costs of supporting ICT in schools (Sinclair and Mortimer, 2007).
Technical support
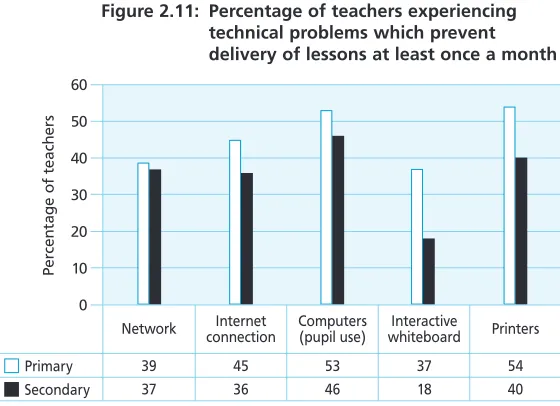
Technical support remains an ongoing challenge for schools, with many still facing the challenge of providing a responsive yet cost-effective service. A sizeable minority of teachers reported having technical problems that prevented the delivery of lessons at least once per month (Kitchen et al., 2007). Teachers in secondary schools were less likely to experience these problems than those in primary schools, presumably because they have higher levels of technical support. Problems were more likely to involve hardware in the classroom rather than network or system failure.
In both primary and secondary schools the most common area for investment over the next three
[image:14.595.291.571.485.688.2]Source: Download of Curriculum Online database of registered products, CEPA calculations (Becta, 2007b)
Figure 2.10: Change in the number of priced products by major subject area and school type (April 2005 to October 2006)
Primary Secondary
Maths
260 278
English
395 543
Science
174 454
ICT
180 318
Other
553 1354
No subject given
-11 87 1400
1200
1000
800
600
400
200
0
-200
Chang
e
in
number
of
priced
pr
oducts
Source: Harnessing Technology in Schools survey (Kitchen et al., 2007)
Figure 2.11: Percentage of teachers experiencing technical problems which prevent delivery of lessons at least once a month
Primary Secondary
Network
39 37
Internet connection
45 36
Printers
54 40 60
50
40
30
20
10
0
P
er
centag
e
of
teacher
s
Computers (pupil use)
53 46
Interactive whiteboard
37 18
years is technical support, demonstrating once again that this remains an area of concern for schools (Kitchen et al., 2007).
Despite regarding technical support as a high priority, relatively few schools had implemented Becta’s Framework for ICT Technical Support (FITS). In 2005 only 7 per cent of schools had implemented the FITS system and a significant proportion had no plans to do so in the near future (Becta, 2006d). The framework helps schools
13
implement a reliable and effective ICT
infrastructure and address the technical support problems that they may encounter. Where it has been implemented, it has helped school planning and budgeting and allowed schools to focus on user requirements. Teachers were also more confident that ICT services were reliable. (Becta, 2006e)
Security and integration of ICT systems
The Becta Review 2006 noted that integration of learning platforms with management systems was an issue. The latest data suggests that this picture is largely unchanged with both the Harnessing Technology in Schools survey and the learning platforms study stating that there is still limited linkage between learning platforms and school management systems (Kitchen et al., 2007; Becta, 2007a).
For example, few learning platforms were linked to school management systems such as pupil attendance registration. Only 14 per cent of the learning platforms in surveyed secondary schools were linked in this way. The corresponding proportion for primary schools was 2 of the 26 learning platforms found. (Kitchen et al., 2007)
The school's network should also provide safe and secure, 'anytime, anywhere' access. This means protecting the user from inappropriate content, and ensuring data security and integrity. Secure log-in areas were available to staff in about half (52 per cent) of primary schools and about two thirds (66 per cent) of secondary schools. Most schools which had staff log-ins also provided log-ins for pupils (38 per cent of primary schools and 53 per cent of secondary schools overall). (Kitchen et al., 2007) Schools take other technical steps to ensure the safety and security of their systems, predominantly using virus protection and firewall services.
Future priorities
Spending on ICT at school level is rising slightly on average (Kitchen et al., 2007). While schools spent only between 2–5 per cent of their budget on ICT (including equipment, software,
connectivity and support) in the 2005–2006 financial year, they did not expect a fall in this spend in the coming years.
However, BESA suggests that schools view spending on ICT as a diminishing priority with only 26 per cent of primary and 38 per cent of secondary schools expressing a view that ICT spend was to be a main focus in 2007 (BESA, 2006). This may reflect a change in spending priorities more generally, that hardware refreshment activities could run on 4- or 5-year cycles, or that with more efficient procurement processes, schools are coping better with sustainability issues.
Technology-related training remains a priority in both primary and secondary schools, and particularly the former (Kitchen et al., 2007). Although there is increasing access to technology, in terms of the maturity of the workforce in adopting these technologies, training remains an issue.
DEVELOPMENTS IN THE LEARNING AND
SKILLS SECTOR
Access to technology
Access to computers and supporting technologies
Colleges have faced a particular challenge of maintaining their infrastructure while at the same time meeting greater demand created by the growing number of FTE students (Becta, 2006d). The need to respond flexibly to increasing student numbers is likely to continue in the light of proposals set out in the Leitch report. College infrastructure will need to cope not only with new levels of demand but also the ability to provide for students who may wish to learn on line, on demand and from remote locations.
Source: Harnessing Technology in Schools survey (Kitchen et al., 2007)
Figure 2.12: Percentage of schools providing secure log-in areas for different users
Primary Secondary
Staff
52 66
Pupils
38 53
Parents
4 7
Governors
14 15 70
60
50
40
30
20
10
0
P
er
centag
e
of
14
The decline in improvement of
student:computer ratios noted in 2005 has continued. In 2005 the decline was attributed to the success of colleges in recruiting and
retaining their students, but in 2006 while the number of FTE students had stabilised, the student:computer ratio remained largely the same. It is, however, comfortably within the LSC target of 5:1, with a mean ratio of 4.5:1.
Patterns of access, location and availability of technology
As noted with schools, computer:learner ratios can mask variation both within and across institutions. Several factors affect access to technology and the subsequent experience of students. FE colleges are moving away from the use of computer labs to establish multi-purpose teaching areas equipped with fixed computers, flexible open computer areas or small sets of laptops within each teaching room (Becta, 2005b).Around three quarters of computers are sited in classrooms, which limits their use to those times when classes are scheduled. While open-access provision allows some use out of class time, this provision has remained relatively constant since 2003.
However, there is widespread use of ICT by remote access, with a clear trend for learners to be able to access some of their programmes of study at a time and place of their choosing. Colleges make considerable use of wireless LAN technologies. While only 2 per cent have a wholly wireless network, a further 10 per cent describe wireless as forming a substantial part of their college network. Nearly three quarters of colleges use wireless for a small part of their network, often to connect remote buildings or sites. Relatively few colleges allow students to connect their own devices to the college network. (Twining et al., 2006)
Demand for computers by college students has always been an issue. In 1999, just under half of institutions (47 per cent) reported that they could not cope with the demand for computers. In 2006 this level stood at 30 per cent, suggesting an overall improvement. (Becta, 2006f)
Source: ICT and e-learning in Further Education: management, learning and improvement (Becta, 2006f)
Figure 2.13: FE college ratio of FTE students to all computers
5:1 and better 6:1 to 7:1
100
90
80
70
60
50
40
30
20
10
0
P
er
centag
e
of
colleg
es
8:1 to 11:1 12:1 and over
1999
3 9 21 65
2000
34 26 18 21
2001
64 24 9 3
2003
81 15 3 0
2004
76 20 5 0
2005
68 24 8 1
2006
59 31 10 0
* All percentages are rounded to the nearest 1 per cent
Source: ICT and e-learning in Further Education: management, learning and improvement (Becta, 2006f)
Figure 2.14: Computer placement
Open access Classroom access
100
90
80
70
60
50
40
30
20
10
0
P
er
centag
e
of
comput
er
s
a
vailable
No access
Daytime
26 74 1
Evening
21 56 23
Weekends
15 Connectivity and bandwidth
The phased upgrade of college bandwidths to either 4Mbps or 10Mbps has largely taken place. Following this upgrade, 69 per cent of colleges were not planning to purchase additional bandwidth. Of those that were, 11 per cent of colleges aimed to use JANET and 8 per cent to use BT. The remaining 12 per cent of colleges identified a range of different ISPs providing them with some connectivity. (Becta, 2006f)
Networking
In 2006 there was only a relatively modest improvement in network capacity despite dramatic improvement in technical specification between 2004 and 2005. However, there has been steady improvement in network
performance and ability to meet demand over the period 1999–2006. A clear majority of colleges (61 per cent) described their network performance as always smooth, and 37 per cent reported their network performance to be slow at busy times. This is almost an exact reversal of the situation in 1999. (Becta, 2006f)
However, the increasing use of networked applications is adding to the burden on college networks. Some 70 per cent of colleges continued to identify large files as an actual or potential source of problems on the network. As a result, students whose networked learning is scheduled at busy times will face a worse experience than those who are scheduled to use the network when traffic is low (Becta, 2006f). The Leitch report recommendations that colleges must respond flexibly to student and employer demand will be a particular challenge for colleges networks.
Allowing students to connect their own devices to the college network would support flexibility, but only 12 per cent currently permit students to make a physical connection, 10 per cent permit a wireless connection, and only 1 per cent permit both (Becta, 2006f).
Effective use of supporting technologies
Display screen technologies have made significant inroads into teaching areas. Only 2 per cent of colleges stated that electronic whiteboards were not available in their college,
Source: ICT and e-learning in Further Education: management, learning and improvement (Becta, 2006f)
Figure 2.15: Meeting student demand for computers
Difficulty meeting demand
Sufficient capacity for demand
1999
47
46
4
2000
39
50
3
2001
28
61
5
2003
29
60
10 2004
33
59
7
2005
40
56
3
2006
30
57
13 100
90
80
70
60
50
40
30
20
10
0
P
er
centag
e
of
colleg
es
Sufficient capacity for greater demand
* All percentages are rounded to the nearest 1 per cent
Source: ICT and e-learning in Further Education: management, learning and improvement (Becta, 2006f)
Figure 2.16: Network capability to meet demand
Over stretched At capacity
1999
22 54 24
2000
9 62 27
2001
5 55 38
2003
5 51 43
2004
7 47 45
2005
1 53 45
2006
1 48 52 100
90
80
70
60
50
40
30
20
10
0
P
er
centag
e
of
colleg
es
16
down from 4 per cent last year. While the pattern of availability has improved, with 90 per cent of colleges stating that data projectors and whiteboards were sited in at least some
teaching rooms, the drive for a whiteboard in every classroom is not as strong as in the schools sector.
Learning platforms and e-portfolios
In the period 2003–2006 college networks continued to be extensively used as learning platforms, while college intranets became less widely used. The use of VLEs reached 82 per cent of colleges in 2006.
VLEs not only increased in use in colleges, they were more widely cited as a college’s main platform. Some 30 per cent of colleges reported their VLE was their main platform, as opposed to 16 per cent in 2004. However, this
percentage is still low in terms of delivering functionality to support personal online accounts and learning spaces.
Use of e-portfolios and e-assessment has shown slow progress (Becta, 2006g). However, in some institutions, practitioners still do not use email or the Web routinely during the working day and e-portfolio development reflects the level of readiness of staff and learners (Becta, 2007c). Only 6 per cent of colleges have a learning platform which outputs to an e-portfolio (Becta, 2006f).
In work-based learning, the term Electronic Performance Support Systems (EPSS) is more familiar than e-portfolio. Almost 60 per cent of organisations currently using e-portfolios or EPSS are classed as ‘innovators’ (Overton et al., 2007).
Access to learning beyond the institution
Some 69 per cent of colleges allow remote access to college systems to all students. A further 10 per cent allow remote access to particular groups of students and 3 per cent allow access on a case-by-case basis. The remaining 18 per cent do not allow remote access to students (Becta, 2006f).
Source: ICT and e-learning in Further Education: management, learning and improvement (Becta, 2006f)
Figure 2.17: Availability of display screen technologies
In all or most rooms In some rooms
Data Projectors
2005 14 68 16 0
Data Projectors
2006 33 61 6 0
Electronic Whiteboards
2005 3 78 13 4
Electronic Whiteboards
2006 11 83 4 2 100
90
80
70
60
50
40
30
20
10
0
P
er
centag
e
of
colleg
es
Bookable equipment/rooms Not available
Source: ICT and e-learning in Further Education: management, learning and improvement (Becta, 2006f)
Figure 2.18: College learning platforms 2003–2006
Intranet VLE
2003
84 58 93
2004
86 70 94
2005
79 76 97
2006
79 82 96 100
90
80
70
60
50
40
30
20
10
0
P
er
centag
e
of
colleg
es
Network
17
Widespread use of ICT for remote access to learning increased between 2005 and 2006, following more modest increases since 2003. The overall trend seems to be in the use of ICT to enable learners to access some of their programme of study at a convenient pace or time. In 2006, 48 per cent of colleges delivered learndirect courses, a significant reduction from 72 per cent in 2003. However, remote learning not delivered via learndirect was offered by 52 per cent of colleges in 2005. Some 29 per cent of colleges offered neither form of remote learning, a similar proportion to 2005 (Becta, 2006f). This would suggest that a sizeable minority of colleges will not use remote learning to achieve the flexibility required to implement the Leitch report’s recommendations.
Access to digital resources
In-house resource development
There is a significant amount of practitioner-led development of electronic learning materials for use with students. In 2006 some 80 per cent of colleges offered staff development programmes to support those who wished to develop or adapt e-learning materials. Around 66 per cent offered support from e-learning ‘champions’ and 68 per cent offered support from technical staff. These proportions had remained broadly the same over the previous few years.
Of the 26 per cent of colleges that offered other support, a number mentioned support from other members of staff, and several colleges use a dedicated materials development team. (Becta, 2006f)
Sources of materials
The use of e-learning materials continues to be at the discretion of the individual teacher. This was the case in 52 per cent of colleges. The use of e-learning materials was directed by a college-wide plan in only 19 per cent of colleges and by a plan at department or course level in 27 per cent. These proportions have fluctuated slightly over the years, but remain at similar levels to 2003.
The most frequently used resources were college-produced materials and the internet.
Source: ICT and e-learning in Further Education: management, learning and improvement (Becta, 2006f)
Figure 2.19: Delivery of remote learning in colleges
Delivers learndirect programmes Delivers other remote learning
2003
72
55
2004
66
52
2005
53
50
2006
48
52 80
70
60
50
40
30
20
10
0
P
er
centag
e
of
colleg
es
Source: ICT and e-learning in Further Education: management, learning and improvement (Becta, 2006f)
Figure 2.20: Source of e-learning materials used by students
Common practice Done by colleges
NLN materials
17 80
Other public sources
11 80
Bought-in
16 76
In-house
34 57
Internet
31 66 90
80
70
60
50
40
30
20
10
0
P
er
centag
e
of
colleg
es
18
2003. Some 91 per cent of colleges used other publicly-funded sources of materials, and these were in common use in 11 per cent of colleges. (See Figure 2.20)
In work-based learning organisations, 24 per cent developed all their own e-learning resources in-house Despite an increasing focus on company-specific training for the majority of organisations, commercial products were still in use within 55 per cent of organisations.
ICT support and maintenance
ICT service provision
In 2006, the median number of technical staff directly employed by colleges was eight, and the median ratio of computers to employed
technicians was 110:1. This is an increase from a ratio of 100:1 in 2005 and is accounted for by the increase in total numbers of computers.
PC support, audiovisual support and technical helpdesk services were the services most often provided by in-house staff. Around 90 per cent of colleges delivered these services entirely in-house. Data services, including management information systems (MIS), and telephony support were most likely to be at least partly outsourced. Data services were handled in-house by 74 per cent of colleges, and telephony by only 49 per cent. (Becta, 2006f)
Technical support is handled well in the majority of colleges with 72 per cent of respondents reporting that technical problems were usually resolved within a reasonable time. A further 23 per cent reported that there were peak times when these problems were difficult to resolve and only 5 per cent stated that there was always a significant backlog of technical problems awaiting resolution (Ibid).
Sustainability
In colleges it was reported that 30 per cent of the current stock of computers were purchased before 2002–3. Becta (2006f) noted that between 1999 and 2006, around 460,000 computers were purchased, while around 210,000 were removed from service. This
Source: ICT and e-learning in Further Education: management, learning and improvement (Becta, 2006f)
Figure 2.21: College learning platform links to MIS, 2004 and 2005
2004 2005
Intranet
45 52
VLE
25 33
Network
38 48 60
50
40
30
20
10
0
P
er
centag
e
of
platf
orm
user
s
equates to colleges replacing their computer stock roughly every five years. At the same time, the total stock of computers will reach a steady-state of around 400,000 computers. The reality is that colleges have to decide on a level of ICT provision that matches the extent of access they wish to provide, for both learners and staff.
Securing and integrating ICT systems
There remains a challenge to link learner management to curriculum delivery. There has been a slight improvement since 2005 on connecting a college’s learning platform to its
management information system (MIS), across intranets, VLEs and networks. However, it is not yet an outstanding feature for any platform. Only 33 per cent of colleges with a VLE said that this platform was linked to the college’s MIS (Becta, 2006f).
19
3
Key points
Although there is evidence of improved levels of institutional e-maturity in recent years, wide variation in the adoption and use of technology remains. A key challenge is to ensure that all elements of an institution’s ICT strategy work together for the benefit of learners.
Primary and secondary schools have taken different paths towards achieving improved levels of e-maturity. Promoting awareness and models of maturity in the use of ICT is central to helping to increase the number of educational organisations making effective use of ICT.
Courses on using ICT in teaching are among the top three CPD choices for all but the most recently qualified teachers.
Ofsted reports greater clarity is needed for schools in terms of expectations of embedding of ICT in teaching and learning across the curriculum. The best provision offered a good balance between ICT as a discrete subject and its use within other subjects.
In secondary schools there was evidence of good application of ICT across a few subjects, but subject departments continue to play a key role in the levels of ICT use.
Technology can enable the sharing of information between practitioners, parents and learners, but interoperability issues still hamper the effective transfer of data within and between institutional systems. Even when this underlying capability is in place, institutional and professional practice in using data to support learners needs to be encouraged and nurtured.
The number of colleges with specific ILT or e-learning strategies in place has declined over the last seven years. This may be a reflection of integration into broader learning and teaching strategies.
The idea of using ICT, at least in some part of the teaching and learning process, is now commonplace in most colleges. Lecturers prepare lessons using ICT, exploit presentation software and word processing and may expect students to access and use online resources and course documents. However, few practitioners fully exploit the possibilities for learning and teaching offered by technology.
Harnessing Technology has an aim to develop an integrated network for education with common systems and open standards to allow safe and easy communication (DfES, 2005b). Clearly, the way in which these technologies are applied and used depends on the capability and capacity of the institutions, workforce and learners as well as parents and carers. Each of these parties need to reach a level where such exchanges are considered desirable, feasible and effective.
Organisational ‘e-maturity’ can be defined as the integration of technology-based
applications and processes into all key aspects of
CAPABILITY AND CAPACITY OF THE WORKFORCE, PROVIDERS
AND LEARNERS
organisational practice and operation. Butt and Cebulla state that e-maturity:
...indicates the extent to which schools and their teachers make the use of ICT integral to their teaching and planning of teaching activities and provide students access to ICT inside and outside the classroom.
(Butt and Cebulla, 2006)
20
DEVELOPMENTS IN SCHOOLS
Institutional capability and capacity
Overall e-maturity
There has been significant progress in access to equipment, systems and resources, especially in secondary schools, over the last five years (Ofsted, 2005a). However, there is wide variation across the system in the adoption and use of technology and institutions are at different stages in their use of ICT.
PwC (2004a) established a set of measures of overall school e-maturity. These included ICT infrastructure, training and technical support, and institutions’ stated readiness to embed ICT. In 2004 those institutions that were considered e-enabled ranged from 10 per cent for primary schools and 14 per cent for secondary schools.
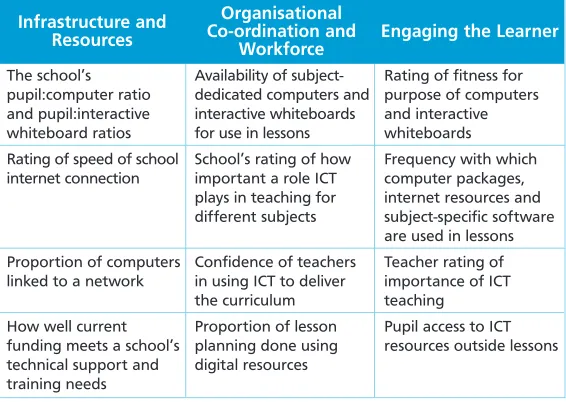
Butt and Cebulla (2006) developed an index of e-maturity in primary and secondary schools using similar indicators to those in the PwC study. This index was composed of three dimensions combining measures of attitude and ‘hard’ data on availability and use of resources. These dimensions were:
● ICT infrastructure and resources
● organisational co-ordination of ICT resources ● engagement with learners – the use of ICT
resources in a school.
There were modest but statistically significant, increases in mean score for overall e-maturity between 2002 and 2005, in both primary and secondary schools. Schools with higher levels of e-maturity in 2005 outperformed schools with lower scores on all three dimensions of the maturity index. While primary schools lagged behind secondary schools in 2002, by 2005 their levels of e-maturity were almost identical. Scores increased more for primary and secondary schools whose e-maturity scores were already higher in 2002. Not all schools improved, with 8 per cent of primary and 15 per cent of
secondary schools showing a decline in overall scores over the three-year period.
Resource allocation and management
Studies of effective schools (see for example Dodd, 2006) highlight the importance of a strong commitment to using and investing in ICT. While primary schools’ overall e-maturity was similar to that for secondary schools, they lag behind in terms of their ICT
infrastructure and resources. In contrast, they led secondary schools in organisational co-ordination of ICT resources.
For primary schools, increases tended to be linked to the size of school and to a higher proportion of students with special needs. In secondary schools, e-maturity scores were more likely to increase in schools that specialised in science and technology subjects. These findings illustrate how primary and secondary schools have taken different paths towards achieving improved aggregate levels of e-maturity. (Butt and Cebulla, 2006)
[image:22.595.290.573.343.544.2]Primary schools Secondary schools Special schools
Table 3.1: Spectrum of e-enablement by school type
7 11 16
Source: Moving Towards E-learning in Schools and FE Colleges (PWC, 2004a)
Late adopters
(%)
44 41 35
Ambi-valent
39 34 33
Enthusi-astic
10 14 16
e-enabled
118 85 43
Sample size
(N)
The school’s pupil:computer ratio and pupil:interactive whiteboard ratios
Rating of speed of school internet connection
Proportion of computers linked to a network
How well current funding meets a school’s technical support and training needs
Table 3.2: Indicators of e-maturity used in the COL secondary analysis
Source: E-maturity and school performance – A secondary analysis of COL evaluation data. (Butt and Cebulla, 2006)
Infrastructure and Resources
Organisational Co-ordination and
Workforce
Engaging the Learner
Availability of subject-dedicated computers and interactive whiteboards for use in lessons
School’s rating of how important a role ICT plays in teaching for different subjects
Confidence of teachers in using ICT to deliver the curriculum
Proportion of lesson planning done using digital resources
Rating of fitness for purpose of computers and interactive whiteboards
Frequency with which computer packages, internet resources and subject-specific software are used in lessons
Teacher rating of importance of ICT teaching
21
Leaders’ e-maturity
Development of school leaders
Schools that have made best progress with ICT have senior managers who are involved in developing a whole-school strategy, focused on how ICT enhances teaching and learning (Ofsted, 2004). Professional development for school leaders is a key factor in developing institutional e-maturity and implementing new ways of working with ICT (Ofsted 2004; PwC, 2004a). Programmes such as NCSL’s Strategic Leadership in ICT (SLICT) have trained over 10,000 school leaders, including 2,390 head teachers in 2005–2006 and 1500 school leaders in 2006–2007, and are developing the
competencies of those involved. Comber et al. (2006) found that headteachers reported their progress in their schools in relation to vision, policy development and teaching, and considered that developments resulted from SLICT. Schools moved on average over one level up on the continuum from ‘Pre-emergent’, ‘Emergent,’ ‘Established’ through to ’Advanced’, from their pre-SLICT rating. However,
improvements to learning were mainly attributed to other sources.
School leaders face a range of priorities for continuing professional development which compete with a commitment to developing competencies relating to ICT. Hutchings et al. (2006) found that primary school heads and assistant heads/deputies prioritise school self-evaluation over CPD in ICT. Secondary heads rate school self-evaluation, personalisation and promoting social and emotional development as their top three priorities.
Training in change management was a key lesson to emerge from ICT Test Bed schools in helping to integrate and embed technology. Timing was a critical factor for this training, as it came at the start of the initiative and gave a sense of ownership to staff. Funding for change agents and giving staff time to meet regularly for planning and training was also found essential in changing practices. With good leadership, this high level of support can be reduced over time without making the innovative ICT initiative unsustainable. (Somekh, Lewin et al., 2006)
Overall e-maturity Infrastructure
Organisational/co-ordination Engaging the learner
Base
Table 3.3: Summary of e-maturity mean scores in primary schools
20.4 7.2
6.4 6.7 271
22.1 7.9
7.1 7.2 202
24.8 8.4
8.2 8.1 182
4.4* 1.2*
1.8* 1.4*
* statistically significant difference 2002-2005 at 5 per cent level.
2002 2003 2005 Change2002-05 Indicators (mean scores)
Overall e-maturity
Infrastructure
Organisational/co-ordination Engaging the learner
Base
Table 3.4: Summary of e-maturity mean scores in secondary schools
22.3
8.4 6.6 7.2 265
23.0
8.7 6.9 7.4 172
24.9
8.9 7.7 8.3 154
2.6*
0.5* 1.1* 1.1*
* statistically significant difference 2002-2005 at 5 per cent level.
Source: E-maturity and school performance – A secondary analysis of COL evaluation data (Butt and Cebulla, 2006)
2002 2003 2005 Change2002-05 Indicators (mean scores)
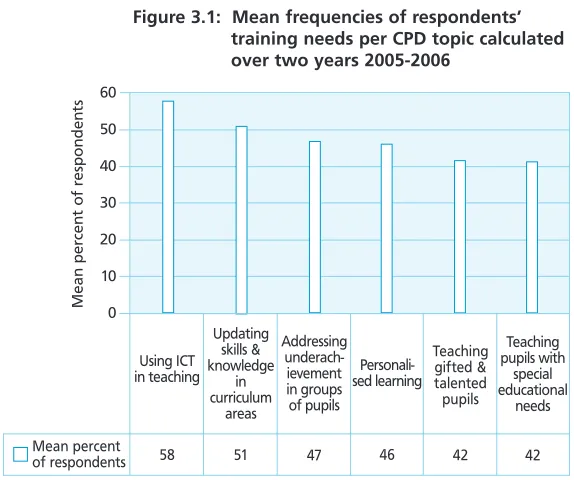
Source: General Teaching Council for England Survey of Teachers 2004-06. Report on trend data (Ashby, 2007)
Figure 3.1: Mean frequencies of respondents’ training needs per CPD topic calculated over two years 2005-2006
Mean percent of respondents
Using ICT in teaching
58 60
50
40
30
20
10
0
Mean
per
cent
of
respondents
Updating skills & knowledge
in curriculum
areas
51
Addressing underach-ievement in groups of pupils
47
Personali-sed learning
46
Teaching gifted & talented pupils
42
Teaching pupils with
special educational
needs
[image:23.595.287.574.502.742.2]22
Features of effective ICT leadership
Schools that saw ICT as a tool for raising standards were generally those where senior managers had a clear overview of the quality of provision across the school. Managers ensured there was an ongoing debate about how ICT was used, and how it engaged learners and benefited learning and teaching. They also involved subject leaders or heads of department to ensure that ICT played a full part in the teaching and learning of each subject. In the most effective practice, new staff are inducted and supported as they develop an understanding of the school’s expectations of ICT. (Ofsted, 2005a)
A complex set of changes is needed to implement ICT effectively. School leaders consulted in 2006 regarded their role as a change manager, addressing the ‘human factors’ associated with the implementation of ICT (Twining et al., 2006).
The way in which ICT leadership is
complemented by effective co-ordination of ICT is also critical (Ofsted, 2005a). However, the quality of ICT co-ordination is variable, being good or better in 60 per cent of secondary and special schools and 50 per cent of primary schools. Primary ICT co-ordinators rarely have designated time for their role and their responsibilities are wide-ranging and could include making purchasing decisions, organising training and troubleshooting technical problems. In secondary schools there is more likelihood of designated time and strategic support from senior management and ICT strategy groups (Kitchen, Dixon, McFarlane, Roche and Finch, 2006).
Practitioner e-maturity
ICT development for teachers
The majority of teachers have received training in the use of ICT in recent years. However, ICT is still a major professional development need, and one they would wish to develop voluntarily rather than something they have been selected for (Sturman et al., 2005; Kitchen et al., 2007).
‘Using ICT in teaching’ has remained the most frequently selected topic for Continuing
Professional Development in the General Teaching Council survey and is among the top three topics for all but the most recently qualified teachers. ‘Strengthening and/or updating skills and knowledge in curriculum subject areas’ and ‘addressing
underachievement in groups of pupils’ featured in the ‘top five’ in both years. (Hutchings et al., 2006)
Formal training courses in person
Informal training in person Reading books or manuals Formal training courses online
Finding information online DVDs or CD-ROMs Self-taught (spontaneous) Other
[image:24.595.287.573.385.687.2]Base: all teachers
Table 3.5: Ways in which teachers accessed ICT training
83
76 38 14
52 53 1 4
621
35
39 23 5
27 20 4 4
1200
Source: Harnessing Technology in Schools Survey 2006 (Kitchen et al., 2007)
Primary (%)
Secondary (&%)
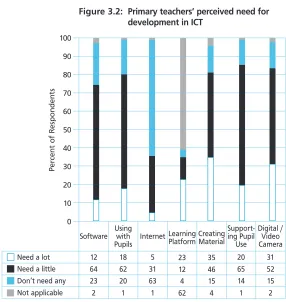
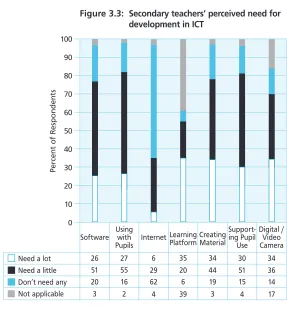
Figure 3.2: Primary teachers’ perceived need for development in ICT
* All percentages are rounded to the nearest 1 per cent Base: all primary teachers answering (566-609)
Source: Harnessing Technology in Schools Survey 2006 (Kitchen et al., 2007) Software
12 64 23 2
Using with Pupils
18 62 20 1
Internet
5 31 63 1
Learning Platform
23 12 4 62
Creating Material
35 46 15 4
Support-ing Pupil Use
20 65 14 1
Digital / Video Camera
31 52 15 2 100
90
80
70
60
50
40
30
20
10
0
P
er
cent
of
R
espondents
Need a lot Need a little Don’t need a