Ventilation and Indoor
Air Quality in Schools –
Guidance Report 202825
Building Research Technical Report 20/2005
March 2006
Ventilation and Indoor
Air Quality in Schools –
Guidance Report 202825
Office of the Deputy Prime Minister Eland House
Bressenden Place London SW1E 5DU Telephone: 020 7944 4400 Web site: www.odpm.gov.uk
© Queen’s Printer and Controller of Her Majesty’s Stationery Office 2006. Copyright in the typographical arrangement rests with the Crown.
This publication, excluding logos, may be reproduced free of charge in any format or medium for research, private study or for internal circulation within an organisation. This is subject to it being reproduced accurately and not used in a misleading context. The material must be acknowledged as Crown copyright and the title of the publication specified.
For any other use of this material, please write to HMSO Licensing, St Clements House, 2-16 Colegate, Norwich NR3 1BQ. Fax: 01603 723000 or e-mail: licensing@hmso.gov.uk.
Contents
Executive Summary 5
1 Introduction 8
2 Measurement protocol undertaken in schools 9
2.1 Details of the main study 9
2.1.1 Details of the schools examined 9
2.1.2 Parameters measured 10
3 IAQ and ventilation rates measured in schools 12
3.1 Indoor air quality results 12
3.1.1 Volatile organic compounds 12
3.1.2 Carbon monoxide (CO) and nitrogen dioxide (NO2) 13
3.1.3 Formaldehyde and acetaldehyde 14
3.1.4 Particulate matter (PM10 and Ultra fine) 15
3.1.5 Fungi and bacteria 17
3.1.6 Dust mites 18
3.2 Ventilation rates and carbon dioxide (CO2) 19
3.3 Temperature and Relative Humidity 22
4 Summary of indoor air quality across schools 25
5 Summary of ventilation rates across all classrooms 26
6 Summary of daily average CO2concentrations across all classrooms 27
7 Ventilation approach in relation to ventilation performance 28
8 Intervention studies to improve ventilation rates and IAQ 30
8.1 Use of windows to achieve better ventilation 30
8.2 Attitudes of teaching staff 31
9 Conclusions 32
10 References 34
12 Appendix A: The schools and measurement protocol 50
12.1 Monitoring procedure within the schools 50
12.1.1 West Grove Primary School 50
12.1.2 Moorside Primary School 51
12.1.3 Wavendon Gate Combined School 52
12.1.4 Bramingham Primary School 52
12.1.5 Baltonsborough Primary School 53
12.1.6 Gallions Primary School 54
12.1.7 Queenswell Infant School 55
12.1.8 Victoria Junior School 56
13 Appendix B – Monitoring Methodology 58
13.1 VOCs and aldehydes 58
13.2 Carbon monoxide 58
13.3 Particles 59
13.4 Microbiological 59
13.5 Dust mites 59
13.6 Ventilation measurement 59
13.7 Carbon dioxide 59
13.8 Temperature and humidity 59
14 Appendix C – Detailed results tables 60
14.1 Volatile Organic Compounds 60
14.2 Carbon Monoxide and Nitrogen Dioxide 74
14.3 Formaldehyde and Acetaldehyde 84
14.4 PM10 88
14.5 Bacteria and Fungi 89
14.6 Dust mites 92
14.7 Ventilation and Carbon Dioxide 94
15 Appendix D – Guideline values for IAQ results 96
Executive Summary
This report is deliverable number 202825 of project cc2108 ‘Ventilation and Indoor Air Quality in Schools’. Responsibility for the ventilation of schools premises has been transferred from the Department for Education and Skills (DfES) to the Building Regulations Division of ODPM. The ventilation design of schools now falls under the control of Buildings Regulation Approved Document F. A previous literature review of research carried out in schools (BRE Client Report 216084) has highlighted the fact that little is known about the ventilation performance of schools. By comparison, within the UK, there is significant information available for other indoor environments, such as workplaces and dwellings, and the benefits derived from good ventilation and indoor air quality.
This report presents the findings of a study into the ventilation rate and indoor air quality in eight primary schools across England. Two classrooms were investigated in each school for a week. All schools had building approval post-1995 (i.e. since last revision of Approved Document F). This builds upon a pilot study that examined the same issues in two schools (White M and Mohle G, 2001). The schools for this study were selected from a list provided by the DfES.
The main findings are as follows:
• Ventilation rates were measured in each classroom for a 45 minute period each afternoon. In each school there were occasions when the ventilation rate was below the minimum rate required of 3 L/s (The School Premises Regulations, 1999). In total, 50% of
measurements were below this value.
• Ventilation rate can also be estimated from carbon dioxide (CO2) concentrations with 3 L/s being equivalent to 2100 ppm of CO2 under equilibrium conditions. CO2 concentrations were measured continuously daily in each classroom. Approximately 40% of classrooms achieved mean CO2 concentrations across the day of 1000 ppm or lower and approximately 88% of classrooms achieved mean CO2 concentrations across the day of 2100 ppm or lower.
• Temperature ranged between 17 – 25°C. For optimum comfort the levels should be between 18 and 23°C and these levels were achieved for the majority of the school day.
• Relative humidity ranged between 30 – 75%. For optimum comfort the levels should be between 40 and 75% RH and these levels were achieved for the majority of the school day.
1995) and could have been naturally releasing chemicals from carpets, walls and furniture surfaces.
• Aldehyde levels were measured for 30 minutes in each classroom on most days, soon after the children had left at the end of the day. No levels exceeded World Health Organisation (WHO) guideline values.
• Levels of carbon monoxide (CO) and nitrogen dioxide (NO2) were monitored continuously in each classroom daily. The CO and NO2 levels were all within WHO guideline values.
• Bacteria levels were measured in each classroom on five occasions on one day.
Measurements were also taken outside on these days. The values were compared against a European proposed rating scheme. Approximately 60% of classrooms had a ‘high’ rating for bacteria. The rating was typically ‘low’ or ‘very low’ outside. This result is to be expected. Children moving around, the mechanics of clothing brushing against skin etc will all dislodge skin scales and dust particles that will contain many millions of bacterial
organisms. Note that it is not possible to determine the risk of infection from these results. The organisms cultured for are regarded as non-pathogenic in persons with normal
immune systems. Infection risk would vary depending on a number of factors including pathogenicity of a particular organism, method and ease of transmission of the organism, duration of exposure and the susceptibility of the other children and teachers.
• Fungi were measured concurrently with bacteria. Approximately 20% of classrooms had a ‘high’ rating for fungi. Similar levels were detected outside of the schools and this suggests that the main source of internal fungi levels is the outside air.
• Dust mites were sampled on a single day in each classroom. All levels were rated ‘low’.
• PM10levels were monitored in each school. All levels were within the UK National Air Quality Strategy guideline value.
• Ultrafine particle numbers were monitored both inside and outside each classroom. There are no UK guideline values for ultrafine particles. The values were similar both inside and outside of the classrooms and this suggests the principal source is external.
Ventilation intervention studies were undertaken in two of the schools. Whilst limited, they did show that through the greater use of windows the ventilation rate can be increased with a small impact on thermal comfort . In discussions with teachers, there are a number of reasons to explain why teachers (and classroom assistants) avoid using windows as often as they could. These include the need to prevent noise and cold air entering rooms, and the desire to
conserve energy by reducing heat loss.
Overall, the ventilation rate was often below the minimum recommended levels in classrooms whilst occupied. However, the more important question is whether it is a problem. In a number of classrooms relatively high TVOC levels were recorded on occasions. However, it is suggested that this is often due to new decoration and furnishings or to the use of art materials. It would be much more energy efficient to address this, if required, through source control. Lower VOC emitting products could be used and/or behavioural changes could be made such as promptly putting the tops back on solvent containers.
The bacteria counts were also rated as ‘high’ in a majority of classrooms. The potential implications of this are increased infections amongst children and staff.
Within this work, the implication of individual environmental parameters on health and comfort has been discussed. In addition, there will be a synergistic effect of the combination of
parameters. The consequence of this cannot be assessed from this study. Furthermore, this study has not attempted to determine the impact of the indoor environment on the children’s performance. The literature review showed that there have been few studies in this area, although they do show evidence of an impact on performance. Certainly within workplaces, studies have shown a relationship with increased ventilation and better performance and productivity.
Finally, this has been the largest detailed study of ventilation rate and indoor air quality within UK primary schools. Whilst the sample size is relatively small and care must be taken in interpreting the results, significant new information has been obtained and it provides a much better understanding of the indoor environment within primary schools. Further work should build on this, focusing resources on the major issues highlighted by this study (e.g. improved ventilation design and usage, reducing TVOC and bacteria levels) and extending it to other issues, such as establishing the impact of the indoor environment on children’s performance.
CHAPTER 1
Introduction
This report is deliverable Number 202825 of project cc 2108 ‘Ventilation and Indoor Air Quality in Schools’. Responsibility for the ventilation of school premises has been transferred from the DfES to the Building Regulations Division of the ODPM. The ventilation design of schools now falls under the control of Buildings Regulation Approved Document F. A previous literature review of research carried out in schools (BRE Client Report 216084) has highlighted the fact that little is known about the ventilation performance of schools built since 1995. By
comparison, within the UK, there is significant information available for other indoor environments, such as workplaces and living spaces, and the benefits derived from good ventilation and IAQ.
The purpose of main monitoring phase of this study is to examine the ventilation and indoor air quality (IAQ) levels within eight primary schools. This report summarises the ventilation and IAQ levels obtained and discusses whether they are adequate.
Ventilation rates required in schools are stipulated in the School Premises Regulations (1999). Within teaching areas, the minimum ventilation rate required is 3 L/s per person. In addition, the ventilation provision should also be capable of achieving 8 L/s per person.
There are a number of potential indoor air quality factors that could impact on the health, comfort and performance of the school occupants. These include internally generated pollutants, such as human bio-effluents, organic emissions from building materials and furnishings (e.g. the furniture, carpets, surface finishing), as well as allergens from house dust mites etc. There may also be external pollutants, such as the ingress of combustion products from traffic, or fungi. Comfort criteria also require temperature and relative humidity levels to be kept under control.
The schools studied were selected from a list supplied by the DfES. All the schools were naturally ventilated, and were built post 1995. The main monitoring phase follows on from a pilot investigation that was completed earlier in the project (White M K and Mohle G. (2001)).
The primary schools selected for this study are as follows;
• West Grove Primary School • Moorside Primary School
• Wavendon Gate Combined School
• Bramingham Primary School • Baltonsborough Primary School • Gallions Primary School
• Queenswell Primary School • Victoria Junior School
CHAPTER 2
Measurement protocol undertaken
in schools
2.1 Details of the main study
2.1.1 DETAILS OF THE SCHOOLS EXAMINED
A long list of schools built from 1995 was provided by the DfES. From this list eight schools were selected. Studies were conducted in the winter months, although in one case the weather outside was still quite warm.
[image:11.595.71.533.357.657.2]Table 1 provides some details about each school; further information is in Appendix A.
Table 1: Details of the schools involved in the study
School name Classrooms Ventilation strategy Location Date
Nov – 03 Urban in
Workington Semi- open plan classrooms. C6 – first
floor, C12 – ground floor. Ventilation via openable windows and trickle vents Class 6 and
Class 12 Victoria Junior School
Nov – 03 Urban and next to
a busy road in London Cellular classrooms – ground floor.
Ventilation via openable windows Reception class
and Year 2 class Queenswell Primary
School
Oct – 03 Urban in London
Year 2 class and Year 6 class Gallions Primary
School
Feb – 03 Rural village near
Glastonbury Cellular classrooms – ground floor.
Ventilation via openable windows Class 1 and
Class 3 Baltonsborough CE
VC Primary
Jan – 03 Suburban in
Luton Semi-open plan classrooms – ground
floor. Ventilation via openable windows Class 2 and
Class 10 Bramingham Primary
Nov – 02 Suburban in
Milton Keynes Semi-open plan classrooms on ground
floor. Ventilation via openable windows Class 2H (HB1)
and Class 7Cr (HB12) Wavendon Gate
Combined
Oct – 02 Urban and next to
a busy road in Manchester Cellular classrooms. Ventilation via
openable windows Infants class
(2W) and Junior class (6F) Moorside Primary
Sept – 02 Urban in London
Cellular classrooms. T15 – ground floor, T53 – first floor. Ventilation via openable windows
Class T53 and Reception class (T15)
2.1.2 PARAMETERS MEASURED
The basic methodology for monitoring in all schools is provided in Appendix B. The following parameters were examined during the course of a week long investigation at each school
Indoor Air Quality parameters
• Volatile organic compounds
• Carbon monoxide and Nitrogen dioxide
• Aldehydes
• Particulate matter, including ultra-fine particles • Fungi and bacteria
• Dust mites
Ventilation parameters
• Ventilation rate • Carbon dioxide
Other parameters measured
• Temperature
• Relative Humidity
The following bullet points summarise how these parameters were measured in the schools.
• Volatile organic compounds were measured each day using the ‘Perkin-Elmer Tenax TA’ Tubes and an ‘SKC’ pump. Each sample was taken over 45 minutes at about 14:30 in the afternoon in conjunction with the ventilation measurements. In the first school, West Grove, two pairs of diffusive sampling Tenax TA tubes were also put out in both classrooms and left in place for the whole monitoring period.
• Aldehydes were sampled using ‘Waters Sep-pak Xposure Aldehyde’ cartridges. Sampling took place after the children had left at the end of each school day for four days in each classroom. This was a 30 minute sample using an ‘SKC’ pump set up for this purpose. The pumps were placed in the centre of the classrooms.
• PM10particulates were monitored using an in-house sampler incorporating a ‘Charles Austin Capex LSC’ pump and a PM10 sampling head fitted with a preconditioned glass micro-fibre filter. Two PM10samplers were used in each school. A daily sampler collected a volume of 5 litres of air per minute for approximately 7 hours each day of the school week. The second was run over a 24 hour period with its sampling head next to the other. The equipment was located in the main corridor of the school.
• Ultra-fine particulates were measured using a TSI P-Trak meter. This is a hand held
instrument that also logs readings and so can either be used to take spot measurements or can be left in place to monitor over a longer period. The meter was used in both ways; e.g. at Moorside School it was used for spot measurements and at Wavendon Gate School it was left in place in one of the classrooms for a whole day.
• Fungi and bacteria samples were also taken at each school. On one day fungi and bacteria samples were taken over a one-minute period in classrooms five times during the day. A 1-minute sample of fungi and bacteria was also taken at three intervals in the outdoor environment.
• Dust mites were also sampled on a single day in the two classrooms using a specially adapted vacuum cleaner to collect a sample of dust mites on a filter from a 1 m2 floor area.
• Ventilation rates were measured using the perfluorocarbon tracer (PFT) technique. This technique uses two components, sources and sample tubes. In the schools that are close to BRE the sources were set out during a visit made on the Friday prior to the monitoring week. For the schools in Manchester, Somerset and Workington this was not possible, so the sources were set out on first arriving at the school on the Monday morning, before the sample tubes were set up. Sampling was carried out in each classroom using a
programmable ‘SKC’ pump with a four-point manifold. Two VOC and two PFT sampling tubes were attached to the manifold and the pumps were set in place. They were
programmed to start at 14:30 and to run for 45 minutes. This drew sufficient air into each sample tube to capture an adequate sample. The pumps were placed at an appropriate location in each classroom usually near the carbon monoxide/nitrogen dioxide sampler.
• Ventilation rates were also calculated from the CO2 measurements, based on an estimate of the CO2 emission rate of the occupants. There is little guidance on estimating this rate. CIBSE Guides A, B and C suggest that children emit heat at a rate 85% of that of adults and BS 5925 (1991) provides metabolic rates for adults. However assessing the activity level of children in a classroom is difficult. The analysis presented here is based on taking the range of metabolic rates for light activity, 160 – 320 W (this was adjusted for children by multiplying these values by 0.85) and calculating the range of ventilation rates in L/s per person.
• Carbon monoxide and nitrogen dioxide (CO and NO2, respectively) were measured over the five-day period using a pumped sampler system consisting of an electrochemical cell with a datalogger. These were placed in an appropriate location in each of the chosen classrooms.
• Carbon dioxide (CO2) measurements were taken with continuously monitoring infrared ‘Anagas’ analysers. A passive sampling analyser was placed in each classroom each morning (around 8:30am) and logged at five minute intervals until the end of the school day (3:30pm). CO2 spot measurements were taken throughout the day at a number of locations throughout each school.
• Temperature and Relative Humidity (RH) ‘Tiny Talk’ data-loggers were placed in each classroom and at an outside location and were used to record conditions continuously.
CHAPTER 3
IAQ and ventilation rates measured
in schools
3.1 Indoor air quality results
Appendix C contains all the results for IAQ measurements.
3.1.1 VOLATILE ORGANIC COMPOUNDS
There are no UK guidelines for concentrations of volatile organic compounds (VOCs) or total VOCs (TVOCs) in the indoor air. Instead a number of international guidelines can be used to provide some indication as to whether levels measured in the schools are above desirable limits. A value of 300 µg m-3 is a useful benchmark value to adopt as a guideline value for TVOCs, being less stringent than the value suggested by some authorities and more stringent than that recommended by other groups. (Appendix D, table 1).
Volatile organic compounds (VOCs) at West Grove primary school
Tables 1 – 6 in Appendix C present the levels of VOCs found in the two classrooms. The compounds detected in significant amounts, alpha-pinene, limonene and nonanal are likely to come from scent agents used in perfumes or cleaning products or from wood products; there are no guideline levels for these compounds.
P-dichlorobenzene (p-DCB) is used as a moth repellent, toilet cleaner and, possibly, in disinfectants. The concentrations of this compound was higher in the reception class, which may be connected to its proximity of the toilets. The HSE occupational exposure limit for p-DCB is 153,000 µgm-3 for an 8 hour working day (industrial environment). The measured values are much lower than this (<48 µgm-3 for a 45 minute sample).
TVOC concentrations are below 300 µg m-3in both classrooms. These results were observed for both the active sampling process as well as the diffusive sampling technique. The highest recorded mean TVOC concentration was 278 µg m-3found in the reception class on 13/09/02.
The readings from the diffusive sampling tubes were in quantities consistent with those from the active samples.
VOCs at Moorside primary school
The TVOC values are shown in tables 7-9 of Appendix C. In all instances values are below 300 µg m-3. The highest mean value recorded was 256 µg m-3 in the infant class on 18/10/02.
VOCs at Wavendon Gate combined school
below guideline values recommended by groups from Australia and Finland (Table 1 of Appendix D).
VOCs at Bramingham primary school
Tables 13–18 in Appendix C present the concentrations of VOCs in both classrooms. No individual compounds exceeded guideline values, where these are available.
The compounds detected in significant amounts included alpha-pinene, and limonene.
TVOC concentrations exceeded 300 µg m-3on 50% of occasions in both classrooms. The highest mean value recorded in the school was 662 µg m-3 recorded in class 10 on 16/01/03. High levels of 2-butoxyethanol, alpha-pinene, limonene and Butan-1-ol were particularly observed when the TVOC figure was high.
VOCs at Baltonsborough primary school
Tables 19-24 provide the results of measurements of VOC in the school.
Mean TVOC concentrations were below 300 µg m-3 on each of the three sampling occasions in classroom 1. In classroom 3, the highest mean TVOC concentration (304 µg m-3) was recorded on 20/02/03. High concentrations can be attributed to recent wall painting that had taken place in the classroom. Outdoor concentrations of TVOC were found to be low (mean value of 21 µg m-3).
VOCs at Gallions primary school
VOC and TVOC concentrations are found in tables 25-30 in Appendix C. Concentrations of VOCs were all well below guideline values for the classrooms and outdoors.
TVOC concentrations were all well below guidelines set out in Table 1 of Appendix D, for both classrooms. The highest mean TVOC concentration recorded in the school was 137 µg m-3 recorded in the year 6 classroom on 22/10/03.
VOCs at Queenswell infant school
VOC and TVOC concentrations are found in Tables 31-36 in Appendix C. In most instances TVOC concentrations were below guidelines set out in table 1 of Appendix D. On one day in the reception class the elevated TVOC concentration (mean concentration 1094 µg m-3) may have been due to the presence of propan-2-ol which is released during use of the p-trak particle monitor. The mean TVOC concentration on this occasion with the contribution for propan-2-ol removed was 251µg m-3 .
VOCs at Victoria junior school
Tables 37-42 provide the results of VOC measurements in the school (as well as an outdoor sample). Of the two classrooms (class 6 and class 12) the latter had the higher concentration of VOCs. This was due to elevated levels of alpha-pinene, butan-1-ol, methylisobutylketone and 2-ethylhexan-1-ol.
Whereas in classroom 6 TVOC levels never exceeded 300 µg m-3, in classroom 12 concentrations were consistently above 300 µg m-3, reaching a peak of 502 µg m-3.
3.1.2 CARBON MONOXIDE (CO) AND NITROGEN DIOXIDE (NO2)
The WHO guideline values for CO and NO2 are found in Table 2 of Appendix D. One hour average guideline values are 26 ppm and 110 ppb, respectively.
CO and NO2at West Grove primary school
The results of the sampling are shown in Tables 43, 44, 69 and 70 of Appendix C. Levels of CO (<2.8 ppm) and NO2 (<50 ppb) in all classrooms are well below the guideline values.
CO and NO2at Moorside primary school
The results of the sampling are shown in Tables 45, 46, 71 and 72 of Appendix C. Levels of CO (<1.2 ppm) and NO2 (<78 ppb) in all classrooms are all below the guideline values.
CO and NO2at Wavendon Gate combined school
The results of the sampling are shown in Tables 47, 48, 73 and 74 of Appendix C. Levels of CO (< 0.7 ppm) and NO2 (<102 ppb) in all classrooms are below the guideline values.
CO and NO2at Bramingham primary school
The results of the sampling are shown in Tables 49 – 52 and 75 – 78 of Appendix C. Levels of CO (< 0.6 ppm) in all classrooms are well below the guideline values. This is also the case in the majority of NO2 measurements in both classrooms (<66 ppb). However on one occasion in classroom 2 an individual value of 133 ppb was recorded. On this occasion the 1-hour mean concentration, however, was 22 ppb, showing that the high level did not persist for long, and therefore the guideline value was not exceeded.
CO and NO2at Baltonsborough primary school
The results of the sampling are shown in Tables 53 – 56 and 79 – 82 of Appendix C. Levels of CO (<1.3 ppm) in all classrooms are well below the guideline values. This is also the case for NO2 (<52 ppb).
CO and NO2at Gallions primary school
The results of the sampling are shown in Tables 57 – 60 and 83 – 86 of Appendix C. The levels of CO (<4.1 ppm) and NO2 (<35 ppb) in both classrooms are well below the WHO guideline. The slightly higher levels in Year 2 could possibly be due to its location at the front of the school near to busy roads.
CO and NO2at Queenswell infant school
The results of the sampling are shown in Tables 61-64 and 87-90 of Appendix C. Levels of CO (<4.7 ppm) and NO2 (<78 ppb) in all classrooms are well below the guideline values.
CO and NO2at Victoria Junior school
The results of the sampling are shown in Tables 65-68 and 91-94 of Appendix C. Levels of CO (<8.5 ppm) and NO2 (<61 ppb) in all classrooms are well below the guideline values.
3.1.3 FORMALDEHYDE AND ACETALDEHYDE
The WHO (2000) guideline level for formaldehyde is 100 µg m-3as a 30 minute average. The WHO guideline (1999) for acetaldehyde is 50 µg m-3 over a 1 year averaging period or 2000 µg m-3 over a 24 hour averaging period. The measured values reported below are as 30 minute averages.
Formaldehyde and acetaldehyde at West Grove primary school
Tables 95 and 96 in Appendix C provide the results for these compounds as measured in classrooms. On all occasions concentrations of formaldehyde and acetaldehyde are well below the WHO guideline values. The maximum recorded values for formaldehyde and acetaldehyde were 40 and 18 µg m-3, respectively.
Formaldehyde and acetaldehyde at Moorside primary school
Tables 97 and 98 in Appendix C provide the results for these compounds as measured in classrooms. On all occasions concentrations of formaldehyde and acetaldehyde are well below the WHO guideline values. The maximum recorded values for formaldehyde and acetaldehyde were 25 and 8 µg m-3, respectively.
Formaldehyde and acetaldehyde at Wavendon Gate combined school
Tables 99 and 100 in Appendix C provide the results for these compounds as measured in classrooms. On all occasions concentrations of formaldehyde and acetaldehyde are well below the WHO guideline values. The maximum recorded values for formaldehyde and acetaldehyde were 62 and 23 µg m-3, respectively.
Formaldehyde and acetaldehyde at Bramingham primary school
Tables 101 and 102 in Appendix C provide the results for these compounds as measured in classrooms. On all occasions concentrations of formaldehyde and acetaldehyde are well below the WHO guideline values. The maximum recorded values for formaldehyde and acetaldehyde were 48 and 25 µg m-3, respectively.
Formaldehyde and acetaldehyde at Baltonsborough primary school
Tables 103 and 104 in Appendix C provide the results for these compounds as measured in classrooms. On all occasions concentrations of formaldehyde and acetaldehyde are well below the WHO guideline values. The maximum recorded values for formaldehyde and acetaldehyde were 30 and 14 µg m-3, respectively.
Formaldehyde and acetaldehyde at Gallions primary school
Tables 105 and 106 in Appendix C provide the results for these compounds as measured in classrooms. On all occasions concentrations of formaldehyde and acetaldehyde are well below the WHO guideline values. The maximum recorded values for formaldehyde and acetaldehyde were 30 and 14 µg m-3, respectively.
Formaldehyde and acetaldehyde at Queenswell infant school
Tables 107 and 108 in Appendix C provide the results for these compounds as measured in classrooms. On all occasions concentrations of formaldehyde and acetaldehyde are well below the WHO guideline values. The maximum recorded values for formaldehyde and acetaldehyde were 22 and 8 µg m-3, respectively.
Formaldehyde and acetaldehyde at Victoria junior school
Tables 109 and 110 in Appendix C provide the results for these compounds as measured in classrooms. On all occasions concentrations of formaldehyde and acetaldehyde are well below the WHO guideline values. The maximum recorded values for formaldehyde and acetaldehyde were 65 and 14 µg m-3, respectively.
3.1.4 PARTICULATE MATTER (PM10AND ULTRA FINE) PM10particles
The UK National Air Quality Strategy guideline level for PM10 is 50 µg m-3 as a 24-hour mean (DEFRA, 2001). There are currently no limits in relation to ultra fine particulates.
Table 111 in Appendix C provides the full results of PM10across all schools. This indicates that on no occasions did concentrations exceed the guideline value. The maximum recorded value was 43 µg m-3 recorded in West Grove school over each school day from 9-12/09/02.
Ultra fine particles
There are no guidelines on ultra fine particles levels in the UK. The results of these measurements are provided in the following tables (Tables 2 – 9). Values ranged from approximately 3000 to 20000 cc-1. In each school results are similar inside and outside, suggesting that particulate levels in classrooms are related to those outside. Sources of these particulates are combustion products, e.g. from vehicles and industrial emissions.
Table 8: Ultra-fine particle counts for Queenswell Infant school
Location Maximum count cc-1 Average count cc-1 Minimum count cc-1
Reception 9848 8434 7556
Year 2 13401 12642 11598
Table 7: Ultra-fine particle counts for Gallions primary school
Location Maximum count cc-1 Average count cc-1 Minimum count cc-1
Year 2 6612 6164 5630
Year 6 11581 7923 5822
Outside 14985 13969 12970
Table 6: Ultra-fine particle counts for Baltonsborough school
Location Maximum count cc-1 Average count cc-1 Minimum count cc-1
Outside 24466 6349 3544
Table 5: Ultra-fine particle counts for Bramingham primary school
Location Maximum count cc-1 Average count cc-1 Minimum count cc-1
Classroom 2 21120 7381 2731
Outside 8000 7723 7355
Table 4: Ultra-fine particle counts for Wavendon Gate school
Location Maximum count cc-1 Average count cc-1 Minimum count cc-1
Class 7Cr (HB12) 15141 10639 5511
Table 3: Ultra-fine particle counts for Moorside school
Location Maximum count cc-1 Average count cc-1 Minimum count cc-1
Infant Class 19800 13770 9230
Junior class 13300 9702 7170
Outside 39600 18898 8920
Table 2: Ultra-fine particle counts for West Grove school
Location Maximum count cc-1 Average count cc-1 Minimum count cc-1
Reception 12236 12043 11863
T53 14611 12068 9737
Outside 14590 12317 9242
3.1.5 FUNGI AND BACTERIA
Categories have been defined that describe count levels for fungi and bacteria. These categories range from ‘very low’ (concentrations <25 and 50 cfu m-3for fungi and bacteria in non
industrial indoor environments, respectively) to ‘very high’ (concentrations >2,000 cfu m-3for both fungi and bacteria in non industrial indoor environments) and are presented in Table 3 of Appendix D. The measured values reported below for each classroom are the means of the sampled values measured over the week.
Fungi and bacteria at West Grove primary school
Table 112 provides the results for the inside and outside spaces of both classrooms. Mean concentrations of bacteria are defined as high in both classrooms (although values only just enter this category). Outside the classrooms bacteria concentrations are either low or very low. The maximum bacteria count is 1250 cfu m-3.
Mean fungi concentrations are low in both classrooms but defined as intermediate outside classrooms. The maximum count is 990 cfu m-3.
Fungi and bacteria at Moorside primary school
Table 113 provides the results for the inside and outside spaces of both classrooms. In the infant class the mean concentration of bacteria is defined as high. In the junior class bacteria levels are defined as intermediate. The maximum value recorded for bacteria is 950 cfu m-3 which is defined as high. Outside both classrooms the levels are low and very low,
respectively.
Mean concentrations of fungi are defined as intermediate in both classrooms. This is also the level of fungi found outside of classrooms. The maximum recorded value was 480 cfu m-3 which is also defined as intermediate.
Fungi and bacteria at Wavendon Gate combined school
Table 114 provides the results for the inside and outside spaces of both classrooms. Mean levels of bacteria are between 500 – 1000 cfu m-3 and therefore are defined as high. The maximum recorded value was 1640 cfu m-3, which also falls in the high category. Outside of the classrooms concentrations decrease and are either low or very low.
Mean fungi levels in both classrooms of 200-340 cfu m-3are defined as intermediate. Outside both classrooms concentrations rise to 550 – 710 cfu m-3, which is defined as high. The maximum concentration recorded is 1570 cfu m-3which is also within the category definition of high.
Fungi and bacteria at Bramingham primary school
Table 115 provides the results for the inside and outside spaces of both classrooms. In both classes the mean bacteria concentrations of 400 – 480 cfu m-3 are defined as intermediate. The maximum value recorded was 790 cfu m-3, which is in the intermediate category. Only one outside measurement was made and this was found to be very low.
Table 9: Ultra-fine particle counts for Victoria Junior school
Location Maximum count cc-1 Average count cc-1 Minimum count cc-1
Outside 10198 4043 2094
Mean fungi levels of 180 – 210 cfu m-3 were intermediate in both classrooms. This was also the case in the one sample outside of both classes (135 cfu m-3).
Fungi and bacteria at Baltonsborough primary school
Table 116 provides the results for the inside and outside spaces of both classrooms. In classroom 1 the mean bacteria levels measured of 650 cfu m-3are defined as high. In class 3 bacteria levels of 370 cfu m-3 are intermediate. The maximum concentration recorded was 1290 cfu m-3which is also defined as intermediate. Measurements were taken outside the classroom in one case and here they were found to be low.
Mean Fungi concentrations of 120-170 cfu m-3 are defined as intermediate in both classrooms. The outside result of 190 cfu m-3is also in the intermediate category. The maximum
concentration recorded was found in classroom 3 and was 340 cfu m-3(intermediate).
Fungi and bacteria at Gallions primary school
Table 117 provides the results for the inside and outside spaces of both classrooms. In the classrooms mean bacteria levels of 640-910 cfu m-3 are defined as high. Outside the classrooms the level found of 415 cfu m-3 is defined as intermediate. Maximum concentration of bacteria found is 1470 cfu m-3 which is defined as high.
Mean fungi levels of 200–270 cfu m-3 are all defined as intermediate. The maximum recorded value is 420 cfu m-3which is also defined in the intermediate category.
Fungi and bacteria at Queenswell primary school
Table 118 provides the results for the inside and outside spaces of both classrooms. Bacteria levels differ between the reception classroom and year 2. In the first case, the mean bacteria levels recorded of 610 cfu m-3 are defined as being high. In the classroom for year 2 pupils bacteria counts of 200 cfu m-3are defined as intermediate. The maximum recorded level of bacteria (in the reception class) is 790 cfu m-3(defined as high).
The mean fungi concentrations in the classrooms (670 – 800 cfu m-3) are lower than the measurement outside the classes (1300 cfu m-3). Classroom values are defined as high as are outside measurements. The maximum concentration of fungi recorded is 1370 cfu m-3 (outside), also deemed to be high.
Fungi and bacteria at Victoria junior school
Table 119 provides the results for the inside and outside spaces of both classrooms. Mean concentrations of bacteria are in the intermediate category for classroom 12 (330 cfu m-3) and the outside measurement (230 cfu m-3). In classroom 6 bacteria levels reach a mean level of 510 cfu m-3, which is defined as high. The maximum recorded value is 870 cfu m-3 which is also defined as high.
Mean concentrations of fungi are defined as low for class 6 (50 cfu m-3) and the outside
measurement (74 cfu m-3), and defined as intermediate in class 12 (440 cfu m-3). The maximum concentration recorded is 1810 cfu m-3, which is defined as high.
3.1.6 DUST MITES
Table 4 of Appendix D provides the guidance levels for concentration of dust mites and identifies when values can be described as low, moderate or high (values < 100, < 500 and > 500 mites g-1of dust, respectively).
Tables 120 to 127 provide the results of all dust mite measurements in schools. These indicate that concentrations are all well within the low categorization defined by standards.
3.2 Ventilation rates and carbon dioxide (CO
2
)
Guidelines on the minimum ventilation rate required in schools stipulates that 3 L/s per person is needed and that there should be provision that this can be increased to 8 L/s per person (The School Premises Regulations (1999)). The higher ventilation rate indicates that CO2 concentrations within a space are maintained at about 1000 ppm. The lower ventilation rate indicates CO2 concentrations of approximately 2100 ppm. In this section all CO2 concentration levels reported are instantaneous measurements.
Ventilation at West Grove primary school
Ventilation rates measured using the PFT technique are provided in Table 128 of Appendix C. On three occasions, twice in the reception class and once in classroom T53, the minimum recommended level of ventilation of 3 L/s per person was not achieved. On these occasions the classroom in question was empty and the windows were closed.
Because the weather was still warm during this school’s monitoring period the staff used the windows for ventilation and ventilation rates when the rooms were in use ranged from 4.9 to 8.7 L/s per person.
Carbon dioxide measurements at West Grove primary school
Figures 1 and 2 show the CO2 data recorded on each day within each classroom. CO2 levels in both classrooms ranged from just below 200-1300 ppm. Peak concentrations are observed in the morning and around midday in the reception class. These peaks were not as obvious in class T53.
Windows and doors were used to modify the environment in both rooms during the week. This was because outside temperatures were high. The Reception classroom was only used during the mornings between 09:00 and 12:00.
Ventilation at Moorside primary school
The ventilation rates measured by the PFT technique are provided in Table 129 of Appendix C. The results show that generally both classrooms exceeded the minimum recommended
ventilation rate of 3 L/s per person and ranged between 3 and 6.5 L/s per person. However on one day in class 2W the PFT ventilation rate was below the recommended level. At the time this test was run the classroom was empty and windows and the door were shut. One observation that was made during measurements was the limited extent to which teachers opened the windows.
Carbon dioxide measurements at Moorside primary school
Figures 5 and 6 present the CO2 data recorded on each day. CO2 levels ranged between 300–2000 ppm in the infants class during the week. Concentrations were above 1000 ppm for a considerable period of time. The main door and partition with the next room were usually open and windows were used infrequently. The high concentration of CO2 recorded on the Thursday afternoon (1750 ppm spot measurement) corresponded to a period when children were active and classroom windows were closed.
The junior class CO levels generally ranged between 300 and 1800 ppm during the week. CO
concentrations exceed 2100 ppm. On two days CO2 concentrations were over 1000 ppm for a long part of the day. The peak level of CO2 of 3200 ppm occurred at a time when windows and doors were closed (they were in use less often than in the other room studied).
Ventilation at Wavendon Gate combined school
The ventilation rates measured by the PFT technique are given in Table 130. In class HB1, there was just one occasion (20% of the samples) when the ventilation rate measured
exceededthe minimum recommended level and on this occasion the windows in the classroom had been opened. The ventilation rates ranged from 1.3 to 5.1 L/s per person.
In class HB12 the situation was much better as the minimum ventilation requirements were met in the four measurements made. Windows were more often used within this classroom to modify the internal environment.
Carbon Dioxide measurements at Wavendon Gate combined school
Figures 9 and 10 present the CO2 concentrations over the course of a week. CO2 levels in class 2H ranged between 320-5000 ppm during the week. The peak value reached was 5000 ppm, which coincided with the day when bad weather meant that all windows were closed.
In class 7Cr (HB12) CO2 levels generally ranged between 300 and 3500 ppm during the week. The peak levels reached were observed when the windows were closed. Opening the window was a regular practice in this class.
Ventilation at Bramingham primary school
The ventilation rates measured by the PFT technique are given in Table 131 of Appendix C. These show that in class 2 the minimum ventilation rate was never achieved. The highest achieved rate was 1.87 L/s per person (at least 33% lower than the minimum rate required) and the lowest rate achieved was 0.8 L/s per person. In class 10 ventilation rates were also poor, with the minimum provision being supplied on one of the five occasions when measurements were taken, with rates ranging from 0.47 L/s per person to 12.1 L/s per person. The maximum ventilation rate achieved was well in excess of 8L/s per person.
Carbon dioxide measurements at Bramingham primary school
Figures 13 and 14 present the CO2 concentrations over the course of a week. CO2 levels vary between approximately 310 to 2830 ppm in classroom 2. Concentrations were above 1000 ppm for the most part of all days. On a number of days peak concentrations also exceeded 2100 ppm.
In classroom 10 concentrations were frequently above 1000 ppm, and on one day continued to rise throughout the day without dropping back; a maximum level was reached on this day of 2800 ppm. Generally concentrations of CO2 rarely exceeded 2100 ppm despite the low ventilation rates.
Ventilation at Baltonsborough primary school
Table 132 of Appendix C provides the ventilation rates, as defined by the PFT technique, in both classrooms. In classroom 1 measurements were taken on three of the five days. On two occasions the ventilation rate was well below the recommended minimum value (0.9 & 1.68 L/s per person). On the third occasion the ventilation rate was as high as 5.3 L/s per person. In class 3 ventilation rates were higher than the minimum recommended value on 50% of the occasions when measurements were taken. On the two occasions that the ventilation rate was below the recommended value this was only slightly lower than 3 L/s per person (the lowest
value was 2.5 L/s per person). The highest value recorded in classroom 3 was very much higher than on all other occasions, with values reaching nearly 21 L/s per person.
Carbon dioxide measurements at Baltonsborough primary school
Figures 17 and 18 present the CO2 concentrations over the course of a week for both classrooms. CO2 levels in classroom 1 ranged between 460 – 4460 ppm. On most days the concentration of CO2 exceeded 1000 ppm. The last day of the tests (Friday) was the only period when CO2 concentrations were mostly below 1000 ppm.
In classroom 3 CO2 concentrations ranged between 280 – 2550 ppm. On all days CO2 concentrations were mostly over 1000 ppm. Peak concentrations of CO2 would often exceed 2100 ppm, but these occurred for relatively short periods of a day. At the point when the ventilation rate was measured at 21 L/s per person, the CO2 levels had dropped from 1900 ppm to 800 ppm due to opening the window.
Ventilation at Gallions primary school
Table 133 of Appendix C provides the ventilation rates measured in the school by the PFT technique. On 50% of all occasions when measurements were taken the ventilation rate in both the year 2 and year 6 classrooms were below the minimum required (with a minimum of 1.3 L/s per person). Only on one occasion (out of a total of eight) did the ventilation rate exceed 8 L/s per person (the peak value was approximately 8.6 L/s per person).
Carbon dioxide measurements at Gallions primary school
Figures 21 and 22 present the CO2 concentrations over the course of a week for both
classrooms. In the classroom for year 2 CO2 concentrations ranged between 290 – 1760 ppm. Concentrations were above 1000 ppm for a significant part of each day. On only one out of four days did CO2 concentrations approach 2100 ppm, and this occurred towards the end of the day.
In the classroom for year 6 children CO2 concentrations ranged between 260 – 2030 ppm. Unlike the situation in the classroom for year 2 pupils the level of CO2 was broadly kept below 1000 ppm. Only on one day in the four day tests did CO2 concentrations approach 2100 ppm and this was for a short period towards the end of the day.
Ventilation at Queenswell infant school
Table 134 of Appendix C provides the ventilation rates measured in the school by the PFT technique. In the reception class the minimum ventilation rates were not achieved on two of the five occasions for which measurements were taken. The lowest value obtained was in the order to 1 L/s per person (over 60% less than the minimum requirement) but a level of nearly 8 L/s per person was achieved on another day. The ventilation rates measured in the year 2 class were generally better in that only on one of the five occasions did the minimum rate fall below recommended levels.
Carbon dioxide measurements at Queenswell infant school
Figures 25 and 26 present the CO2 concentrations over the course of a week for both
classrooms. In the reception classroom concentrations ranged between 160 – 1770 ppm. CO2 concentrations were frequently over 1000 ppm and were particularly higher on one day (Friday) when the ventilation rate was very low. There were, however, other days when concentrations were brought rapidly down, presumably through use of windows and doors.
In the year 2 classroom CO2 concentrations ranged between 60 – 2530 ppm. On three of the four days for which measurements were taken CO2 levels were kept below 1000 ppm. On the fourth day concentrations increased gradually until about midday, when afterwards a much steeper increase in CO2 concentration took place until the end of the day. Towards the end of the day CO2 concentrations were in excess of 2100 ppm.
Ventilation at Victoria junior school
Table 135 of Appendix C provides the ventilation rates in both classrooms, as determined by the PFT technique. In all, eight measurements were taken across both classrooms. In only one case (for classroom 12) did the ventilation rate meet the minimum required (in this case 3.56 L/s per person). The lowest ventilation rate recorded was over 6 times lower than the minimum needed at 0.47 l/s per person.
Carbon dioxide measurements at Victoria junior school
Figures 29 and 30 present the CO2 concentrations over the course of a week for both
classrooms. In class 12 CO2 concentration ranges between 340 – 4560 ppm. On four out of the five days when measurements were taken CO2 levels rose throughout the day and were largely over 1000 ppm. On three of these days CO2 concentrations were mainly above 2100 ppm. Daily mean values of 2695, 1830, 2967, 1327 and 2746 ppm, were obtained.
In class 6 the CO2 concentrations ranged between 420 – 3760 ppm. On all days the mean value for CO2 exceeded 1000 ppm and on two days were above 2100 ppm.
3.3 Temperature and Relative Humidity
Table 5 in Appendix D provides CIBSE guidelines on temperature and relative humidity (RH) levels in educational buildings and classrooms. Temperature recommendations range between 18 – 23°C, and RH between 40 – 75%.
Temperature and relative humidity at West Grove Primary School
Figure 3 shows the results for temperatures and relative humidity in the Reception class, which ranged from 19°C – 21.3°C and 51% and 75%, respectively.
Figure 4 shows the results for temperatures and relative humidity in Class T53, which ranged from 19°C – 25°C and 45% and 70%, respectively.
All these values are within comfort criteria for most of the school day.
Temperature and relative humidity results at Moorside primary school
Figure 7 shows the results for temperatures and relative humidity in the class 2W, which ranged from 19 to 24°C and 35 to 52%, respectively.
Figure 8 shows the results for temperatures and relative humidity in the class 6F, which ranged from 16 to 24°C and 33 and 60%, respectively.
All these values are within comfort criteria for most of the school day.
Temperature and relative humidity results at Wavendon Gate Combined school
Figure 11 shows the results for temperatures and relative humidity in the class 2H, which ranged from 17 to 24°C and 50 and 74%, respectively.
Figure 12 shows the results for temperatures and relative humidity in the class 7Cr, which ranged from 14 to 24°C and 36 and 70%, respectively.
All these values are within comfort criteria for most of the school day.
Note that although the temperature was low at 8:00 am on Monday morning (14°C), it had increased to 18°C by 9:00am.
Temperature and relative humidity results at Bramingham primary school
Figure 15 shows the results for temperatures and relative humidity in the class 2 (the official monitoring period was from the 13th – 17th). Temperature ranged between approximately 17 to 22°C during the period that the school was open. RH ranged between approximately 38 and 65% during weekdays.
Figure 16 shows the results for temperatures and relative humidity in the class 10. Temperature ranged between approximately 17 to 22°C (the monitoring period was from the 13th – 17th). Lower temperatures were mainly experienced at weekends and not during occupied periods for when the official measurements were being taken. RH ranged between approximately 31 to 100%; there were problems with the detection sensor so these results are not reliable throughout the period.
All these values are within comfort criteria for most of the school day.
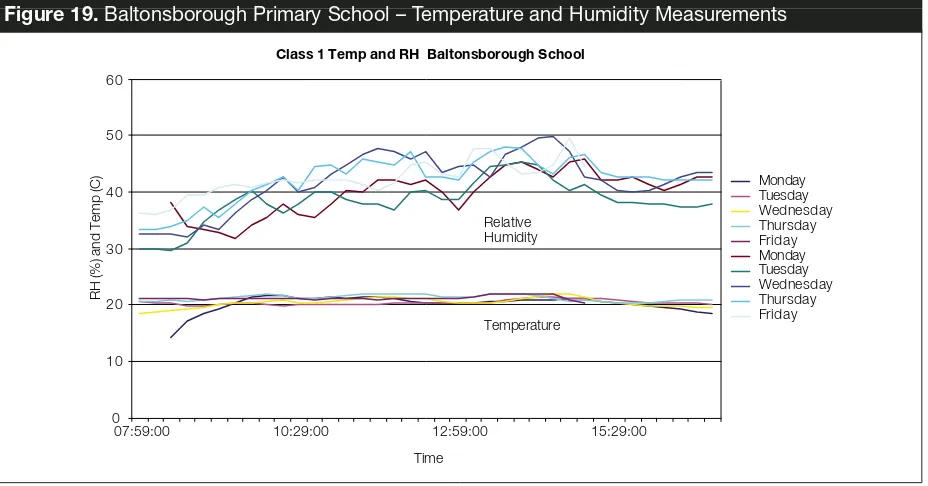
Temperature and relative humidity results at Baltonsborough primary school
Figure 19 shows the results of temperature and relative humidity in class 1. Temperature ranged between approximately 14 to 22°C and RH ranged between approximately 29 to 50%. The low temperature occurred first thing Monday morning. Within a short time the temperature had reached about 19°C.
Figure 20 shows the results of temperature and relative humidity in class 3. Temperature ranged between approximately 13 to 21°C and RH ranged between approximately 30 to 50%. The low temperature occurred first thing Monday morning. Within a short time the temperature had reached about 19°C.
All these values are within comfort criteria for most of the school day.
Temperature and relative humidity results at Gallions primary school
Figure 23 shows the results of temperature and relative humidity in the year 2 class. Temperature ranged between approximately 19 to 23°C.
Figure 24 shows the results of temperature and relative humidity in the year 6 class. Temperature ranged between approximately 19 to 24°C.
Very low values were obtained for RH that are attributed to errors in the detection sensors. As a result there are no reliable values for RH from either classroom.
Temperature and relative humidity results at Queenswell infant school
Figure 27 shows the results of temperature and relative humidity in the reception class.
Temperature ranged between approximately 18 to 22°C and RH ranged between approximately 36 to 62% (values were below 40% for the first couple of hours of the first day of the week).
Figure 28 shows the results of temperature and relative humidity in the year 2 class.
Temperature ranged between approximately 19 to 23°C and RH ranged between approximately 32 to 51% (values were below 40% for the first couple of hours of the first day of the week).
All these values are within acceptable levels for most of the school day.
Temperature and relative humidity results at Victoria junior school
Figure 31 shows the results of temperature and relative humidity in class 6 and 12, as well as in the outdoor environment.
In class 6 temperature ranged between approximately 16 to 21°C and RH ranged between approximately 44 to 65%.
In class 12 temperature ranged between approximately 17 to 21°C and RH ranged between approximately 30 to 49%.
All these values are within acceptable levels for most of the school day.
CHAPTER 4
Summary of indoor air quality
across schools
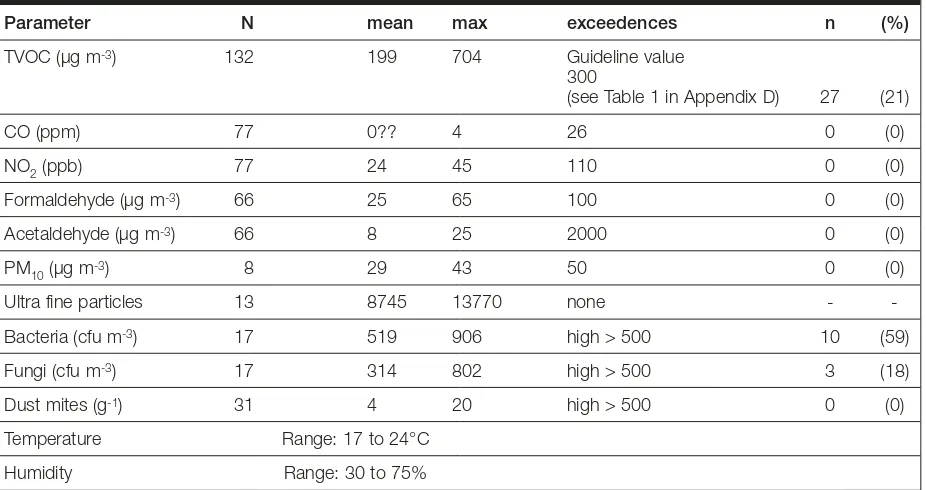
The following table summarises the IAQ measurements found across all schools.
Notes
N = number of mean samples from all classrooms
Mean = average value for mean concentrations found across all classrooms
Max = maximum concentration of pollutant found across all classrooms
n = number of times that recommended (or guideline) values are exceeded
Relatively high TVOC concentrations (>300µg m-3) were recorded on some occasions in Wavendon Gate (2 occurrences), Bramingham (5 occurrences), Baltonsborough (1 occurrence) and Victoria (5 occurrences).
Bacteria concentrations were high in West Grove (2 occurrences), Moorside (1 occurrence), Wavendon Gate (2 occurrences), Baltonsborough (1 occurrence), Gallions (2 occurrences), Queenswell (1 occurrence) and Victoria (1 occurrence).
[image:27.595.72.535.249.494.2]Fungi concentrations were high outside classrooms but not within. Table 10: Summary of IAQ directly measured in all school classrooms
Parameter N mean max exceedences n (%)
TVOC (µg m-3) 132 199 704 Guideline value
300
(see Table 1 in Appendix D) 27 (21)
CO (ppm) 77 0?? 4 26 0 (0)
NO2(ppb) 77 24 45 110 0 (0)
Formaldehyde (µg m-3) 66 25 65 100 0 (0)
Acetaldehyde (µg m-3) 66 8 25 2000 0 (0)
PM10(µg m-3) 8 29 43 50 0 (0)
Ultra fine particles 13 8745 13770 none -
-Bacteria (cfu m-3) 17 519 906 high > 500 10 (59)
Fungi (cfu m-3) 17 314 802 high > 500 3 (18)
Dust mites (g-1) 31 4 20 high > 500 0 (0)
Temperature Range: 17 to 24°C
CHAPTER 5
Summary of ventilation rates across
all classrooms
The following table summarises the ventilation rates that were measured across all schools.
Notes
N = number of daily mean samples from the school (based on average ventilation rates in a class during the occupied part of the day)
Max = maximum ventilation rate recorded in the school classrooms
Min = minimum ventilation rate measured in the school classrooms
(The ventilation rates are calculated using the PFT technique)
Table 11:Summary of ventilation rates directly measured in all schools
School N Ventilation rates (L/s per person)
< 3 < 8 max min
(%) (%)
West Grove 10 3 (30) 9 (80) 8.7 1.6
Moorside 10 2 (20) 10 (100) 6.5 1.8
Wavendon Gate 9 4 (44) 9 (100) 7.7 1.3
Bramingham 10 9 (90) 9 (90) 12.1 0.5
Baltonsborough 7 4 (57) 6 (85) 20.9 0.9
Gallions 8 4 (50) 7 (87) 8.6 1.3
Queenswell 10 3 (30) 10 (100) 7.9 0.9
CHAPTER 6
Summary of daily average CO
2
concentrations across all
classrooms
CHAPTER 7
Ventilation approach in relation
to ventilation performance
Table 12 reiterates the ventilation approach in each school and contrasts this with the ventilation and IAQ performance data obtained.
Notes
< 3 L/s/p = less than 3 litres per second per person
< 8 L/s/p = less than 8 litres per second per person
[image:30.595.63.527.247.645.2]Table 12 indicates that where semi open-plan classes were encountered, higher incidences of poor ventilation rates occurred. Semi open-plan classes are present at Wavendon Gate, Bramingham and Victoria Junior Primary schools. In these schools minimum ventilation rates of 3 L/s per person were not achieved between 44 – 90 % of the sampling periods. In contrast the cellular planned classrooms of the other schools failed to achieve minimum ventilation rates on between 30 – 57 % of sampling periods. These results are supported by the ventilation rates achieved against the benchmark of 8 L/s per person.
Table 12:Ventilation approach, ventilation rates and IAQ
School Ventilation strategy Location Ventilation IAQ problems
name performance (%) encountered
< 3 L/s/p < 8 L/s/p comment
High TVOC concentrations and bacteria counts (100) (87) Urban in Workington Semi- open plan classrooms. C6 is –
first floor, C12 – ground floor. Ventilation via openable windows and trickle vents
Victoria Junior School High bacteria counts (100) (30) Urban and
next to a busy road in London Cellular classrooms – ground floor.
Ventilation via openable windows and trickle vents
Queenswell Infants School High bacteria counts (87) (50) London Gallions Primary School High TVOC concentrations and bacteria counts (85) (57) Semi-urban in Glastonbury Cellular classrooms – ground floor.
Ventilation via openable windows and trickle vents
Baltonsborough CE VC Primary
High TVOC concentrations (90) (90) Urban in Luton Semi-open plan classrooms –
ground floor. Ventilation via openable windows and trickle vents
Bramingham Primary High TVOC concentrations and bacteria counts (100) (44) Urban in Milton Keynes Semi-open plan classrooms on
ground floor. Ventilation via openable windows and trickle vents
Wavendon Gate Combined High bacteria counts (100) (20) Urban and
next to a busy road in Manchester Cellular classrooms. Ventilation via
openable windows and trickle vents Moorside Primary None (80) (30) Urban in London Cellular classrooms. T15 – ground
High TVOC concentrations and bacteria counts are found in both the semi open-plan and cellular classrooms. Given this, there appears to be no relationship between IAQ parameters and the design plan of classrooms.
Proximity to busy roads and general urbanised location of schools has no discernable impact on IAQ (otherwise NO2 and CO concentrations would be elevated given that they are derived from road side vehicles). However, if openable windows are not used because of traffic related noise, this could explain why no link has been established between IAQ and proximity to busy roads. The poor ventilation rates measured confirm that windows are not used as often as they should be for good ventilation.
CHAPTER 8
Intervention studies to improve
ventilation rates and IAQ
For the last two schools, intervention studies were carried out. Windows were opened during the school day and the impact on ventilation and thermal comfort was determined.
8.1 Use of windows to achieve better ventilation
On the fourth day at the Victoria Junior school class 12 was used to see whether leaving windows open all day long would improve ventilation and IAQ. Figure 29 shows this intervention study as a curve labelled ‘Thursday’. On all other days the windows were left closed during teaching periods.
Figure 29 provides clear evidence that CO2 rates are lowered throughout the day as a consequence of the window in classroom 12 being left open. The mean values of CO2 in classroom 12 are 1330 ppm (with mean measured ventilation rate over the day of 3.56 L/s per person). On other days CO2 concentrations varied from between approximately 1830 to 2970 ppm (with corresponding mean ventilation rates of between 0.47 to 1.67 L/s per person).
Figure 32 shows temperature variations from both classes at Victoria School (outside
temperature is also included). On the day of the intervention study the classroom temperature was lowered by approximately 2°C across the whole day; the lowest temperature value was approximately 17°C. Therefore, although the ventilation was improved, it was at some cost to thermal comfort and probably also to heating efficiency.
8.2 Attitudes of teaching staff
There was no investigation into the attitude of classroom teachers and their assistants. However a number of anecdotal stories provide some useful reasons why poor ventilation occurs in school classrooms.
It proved difficult to persuade teaching staff to open windows so that ventilation could be enhanced in classrooms. Reasons given for keeping windows closed are summarised below.
• Avoiding cold classrooms.
• Preventing external noise from hindering learning in classrooms.
• Reducing energy consumption due to enhanced heat loss during the winter.
A further important theme was drawn out from discussions held with teachers. Some teachers would base classroom ventilation needs on their own comfort criteria, whilst others would try to assess the needs of children.
CHAPTER 9
Conclusions
The main conclusions from this study are as follows:
• Ventilation rates were measured in each classroom for a 45 minute period each afternoon. In each school there were occasions when the ventilation rate was below the minimum rate required of 3 L/s (The School Premises Regulations, 1999). In total 50% of
measurements were below this value.
• Ventilation rate can also be estimated from carbon dioxide (CO2) concentrations with 3 L/s being equivalent to 2100 ppm of CO2 under equilibrium conditions. CO2 was measured continuously daily in each classroom. Approximately 40% of classrooms achieved CO2 concentrations of 1000 ppm or lower and approximately 88% of classrooms achieved CO2 concentrations of 2100 ppm or lower.
• Temperature ranged between 17 – 25°C. For optimum comfort the levels should be between 18 and 23°C and these levels were achieved for the majority of the school day.
• Relative humidity ranged between 30 – 75%. For optimum comfort the levels should be between 40 and 75% RH and these levels were achieved for the majority of the school day.
• Levels of volatile organic compounds (VOCs) were measured in each classroom for a 45 minute period each afternoon (concurrently with ventilation measurements). Levels of total volatile organic compounds (TVOCs) were compared against a proposed guideline value of 300 µg m-3. It was found that 21% of samples exceeded this limit and these high values originated from four schools. The highest level observed was approximately 700 µg m-3. It was noted by the researchers that on at least some of the occasions where TVOC
concentration >300 µg m-3was recorded, art work was undertaken concurrently or just prior to the measurements and such activities would tend to increase TVOC levels (e.g. from paints or solvents). An additional factor was that all the schools were fairly new (post 1995) and could have been naturally releasing chemicals from carpets, walls and furniture surfaces.
• Aldehyde levels were measured for 30 minutes in each classroom on most days, soon after the children had left at the end of the day. No levels exceeded World Health Organization (WHO) guideline values.
• Levels of carbon monoxide (CO) and nitrogen dioxide (NO2) were monitored continuously in each classroom daily. The CO and NO2 levels were all within WHO guideline values.
• Bacteria levels were measured in each classroom on five occasions on one day.
Measurements were also taken outside on these days. The values were compared against a European proposed rating scheme. Approximately 60% of classrooms had a ‘high’ rating for bacteria. The rating was typically ‘low’ or ‘very low’ outside. This result is to be expected. Children moving around, the mechanics of clothing brushing against skin etc will all dislodge skin scales and dust particles that will contain many millions of bacterial
The organisms cultured for are regarded as non-pathogenic in persons with normal immune systems. Infection risk would vary depending on a number of factors including pathogenicity of a particular organism, method and ease of transmission of the organism, duration of exposure and the susceptibility of the other children and teachers.
• Fungi were measured concurrently with bacteria. Approximately 20% of classrooms had a ‘high’ rating for fungi. Similar levels were detected outside of the schools and this suggests that the main source of internal fungi levels is the outside air.
• Dust mites were sampled on a single day in each classroom. All levels were rated ‘low’.
• PM10 levels were monitored in each school. All levels were within the UK National Air Quality Strategy guideline value.
• Ultrafine particle numbers were monitored both inside and outside each classroom. There are no UK guideline values for particles. The values were similar both inside and outside of the classrooms and this suggests the principal source is external.
Intervention studies were undertaken in two of the schools. Whilst limited, they did show that through the greater use of windows the ventilation rate can be increased with a small impact on thermal comfort. In discussions with teachers, there are a number of reasons to explain why teachers (and classroom assistants) avoid using windows as often as they could. These include the need to prevent noise and cold air entering rooms, and the desire to conserve energy by reducing heat loss.
Overall, the ventilation rate was often below the minimum recommended levels in classrooms whilst occupied. However, the more important question is whether it is a problem. In a number of classrooms relatively high TVOC levels were recorded on occasions. However, it is suggested that this is often due to new decoration and furnishings or to the use of art materials. It would be much more energy efficient to address this, if required, through source control. Lower VOC emitting products could be used and/or behavioural changes could be made such as promptly putting the tops back on solvent containers.
The bacteria counts were also rated as ‘high’ in a majority of classrooms. The potential implications of this are increased infections amongst children and staff.
Within this work, the implication of individual environmental parameters on health and comfort has been discussed. In addition, there will be a synergistic effect of the combination of
parameters. The consequence of this cannot be assessed from this study. Furthermore, this study has not attempted to determine the impact of the indoor environment on the children’s performance. The literature review showed that there have been few studies in this area, although they do show evidence of an impact on performance. Certainly within workplaces, studies have shown a relationship with increased ventilation and better performance and productivity.
Finally, this has been the largest detailed study of ventilation rate and indoor air quality within UK primary schools. Whilst the sample size is relatively small and care must b