The splashing morphology of liquid-liquid impacts
30
0
0
Full text
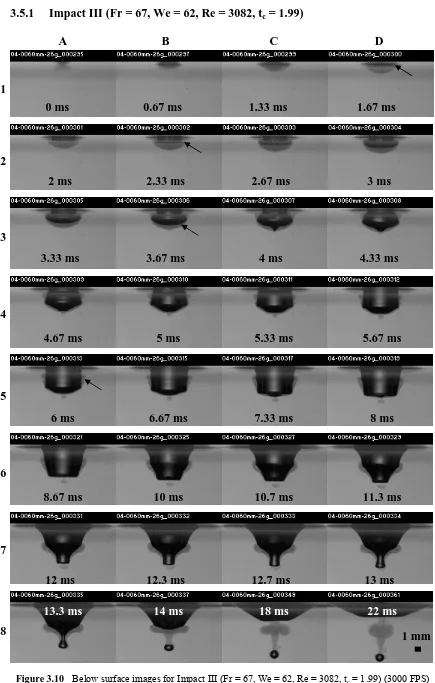
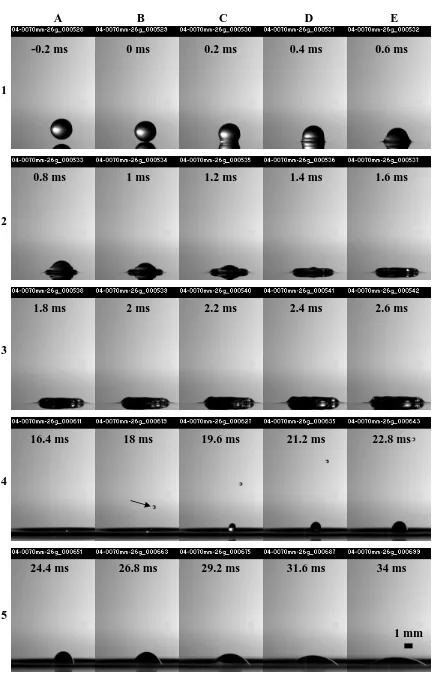
(2) 3.5 Primary vortex ring/Pre-entrapment jetting transition Closer examination of the data from this study reveals there exists an extremely narrow transitionary region between the primary vortex ring regime and the pre-entrapment jetting regime where vortex rings are formed, large bubbles are entrapped and jets form (Impact III). In this region a large vortex ring is formed, like in the primary vortex ring regime, however the cavity collapses to entrap a large bubble similar to what occurs in the primary bubble entrapment regime. The formation of large vortex rings and large bubble entrapment has not been reported before and is probably due to the narrow region over which occurs. A change of 5-10 mm in drop height is enough to miss this region. This equates to about a ± 5 change for both Fr and We numbers. Examining Impact III the cavity begins to appear in Figure 3.10 (D1) with a cylindrical shape. However in Figure 3.10 (B2) the lower portion of the cavity begins to spread laterally while the top portion of the cavity remains stationary, similar to what was observed in Figure 3.9 (B). This results in an extraordinary cavity shape, Figure 3.10 (B3), resembling an inverted mushroom. After Figure 3.10 (B3) the top portion of the cavity begins to extend laterally while the lower extremity of the cavity remains stationary until an almost perfect cylindrical cavity shape is formed in Figure 3.10 (A5). The main vortex core in this impact again begins life at the sharp outer edges of cavity as described earlier in Figure 3.9 (E-F). The rotating fluid collects in a coherent vortex ring after the cavity has retracted. When the cavity collapses the walls of the cavity come together (Figure 3.10 (A8)) where a large air bubble, approximately 1.2 mm in diameter, is formed and oscillates violently before reaching a quasi-static state. Accompanying the formation of the air bubble is the formation of a jet. In Figure 3.11 (A4-A5) a series of small drops emanate from the cavity. In this particular case, only four drops are formed ranging in size from 47-142 µm in diameter with a approximate velocity of 4.33 m/s.. - 94 -.
(3) 3.5.1. Impact III (Fr = 67, We = 62, Re = 3082, tc = 1.99) A. B. C. D. 1 0 ms. 0.67 ms. 1.33 ms. 1.67 ms. 2 ms. 2.33 ms. 2.67 ms. 3 ms. 3.33 ms. 3.67 ms. 4 ms. 4.33 ms. 4.67 ms. 5 ms. 5.33 ms. 5.67 ms. 6 ms. 6.67 ms. 7.33 ms. 8 ms. 8.67 ms. 10 ms. 10.7 ms. 11.3 ms. 12 ms. 12.3 ms. 12.7 ms. 13 ms. 13.3 ms. 14 ms. 18 ms. 22 ms. 2. 3. 4. 5. 6. 7. 8. 1 mm. Figure 3.10 Below surface images for Impact III (Fr = 67, We = 62, Re = 3082, tc = 1.99) (3000 FPS). - 95 -.
(4) A. B. C. D. E. -0.13 ms. -0.07 ms. 0.27 ms. 0.47 ms. 0.67 ms. 0.87 ms. 1.07 ms. 1.27 ms. 1.47 ms. 1.67 ms. 2.27 ms. 4.67 ms. 8.67 ms. 11.9 ms. 14.3 ms. 14.9 ms. 15.6 ms. 16.1 ms. 16.7 ms. 17.3 ms. 20.7 ms. 22.3 ms. 25.5 ms. 27.1 ms. 31.1 ms. 1. 2. 3. 4. 5 1 mm. Figure 3.11 Above surface images for Impact III (Fr = 67, We = 62, Re = 3082, tc = 1.99) (5000 FPS). - 96 -.
(5) This transitionary region of flow behaviour was observed in dyed drop impacts for the 33g, 26g and 20g needles. However, it was never observed in any un-dyed drop impacts. There are several possible reasons for this. One, is that the region is so narrow that it escaped detection in the un-dyed experiments. Alternatively, it is possible that dying the drops changed their surface tension properties. In this region, where the Weber numbers are low (<60), the cavity formation will be a fine balance between surface tension and inertial forces. Thus making the cavity dynamics very sensitive to any change in surface tension. Another possibility is that the drop is not totally spherical on impact and the irregular drop shape on impact leads to complex cavity shapes. This is the most probable explanation for the complex cavity shapes but a more thorough investigation of this area needs to be conducted to see if the phenomena is an aberration or a phenomena that can be reproduced.. 3.6 Pre-entrapment jetting regime A region of jetting occurring before primary bubble entrapment was first suggested by Liow (2001) and is confirmed here. The pre-entrapment jetting regime is characterised by secondary drop formation from the break-up of the central jet without any large bubbles entrapped or any large vortex ring formation. Thus, the pre-entrapment jetting regime provides a previously missing link between the development of large vortex rings and the primary bubble entrapment regime. Impact IV shows an example of the phenomena that occurs in the pre-entrapment jetting regime. The first point to note is how the cavity development differs from that of the primary vortex ring regime. In the pre-entrapment jetting regime the bottom portion of the cavity does not flare out rapidly like in Figure 3.9 (B). Nor are there any sharp edges formed mid-way down the cavity like in Figure 3.9 (F) where a distinct rotational motion of the dyed fluid was observed. The cavities in this region tend to form dome shaped cavities that are approaching what one would expect from a spherical expansion. This differs to the cavity shapes observed in the primary vortex ring regime which exhibited a strong cylindrical shape. This cavity behaviour has two possible origins. The first is that at these slightly higher Fr/We numbers (Fr > 70, We > 60), inertial forces are beginning to dominate the process. This differs to the lower impact velocities (primary vortex ring regime Fr < 40 , We < 35) where the stronger surface tension forces dominate and tend to restrict the - 97 -.
(6) laterally expansion of the cavity giving rise to cylindrical type cavities (Figure 3.6). The other possibility is that the distribution of the drops axial momentum during impact and radial momentum during coalesce may change with increasing impact velocity (i.e. the magnitude of momentum directed axially is different to the magnitude of momentum directed radially at different impact velocities). The answer to this question is an extremely difficult one to find using high speed images alone as the drops mass inside and around the cavity needs to be tracked. The answer is likely to be found using numerical simulations that allow for the visualisation of the drop fluid as it merges.. 3.6.1. Small vortex rings. Another flow feature observed in the pre-entrapment regime is the formation of a small vortex ring that forms at the very base of the cavity (Figure 3.12 (C4)) late in the cavity expansion. This vortex ring has enough axial velocity to stay ahead of the forming cavity and is not destroyed. The small ring is not drawn into the wake of the collapsing cavity either but rather continues its downward path. This vortex ring lacks the size, high rotational velocity and distinct toroidal structure to the vortex rings formed in the primary vortex ring regime, thus inferring they formed from a slightly different mechanism. Interestingly, the Thoroddsen bubbles nearly always became entrained in the small vortex ring and transported downward (Figure 3.18). The origin of this vortex ring appears to be related to how and when the final portion of the drop fluid coalesces with the bulk fluid. Examining the below surface images in more detail, the final portion of the drop is barely discernable through the cavity walls as a small triangular shape pointing towards the free surface (Figure 3.18 (A1-B1)) as the cavity expands. This is best visualised by looking down the cavity (Figure 3.19). As this final portion of the drop coalesces (Figure 3.19 (B3-B4)) it flattens out the base. Then approximately two normalised times after initial impact, the direction of the cavity now extends down into the bulk fluid. When this occurs a sudden change in the local velocity around the tip of the cavity must be experienced. This rapid change in local velocity gradients appears to give rise to the small vortex ring. The mechanics of this process is still unclear and requires further investigation.. - 98 -.
(7) 3.6.2. Impact IV (Fr = 76, We = 67, Re = 3178, tc = 1.85) A. B. C. D. 0.2 ms. 0.53 ms. 0.87 ms. 1.2 ms. 1.53 ms. 1.87 ms. 2.2 ms. 2.53 ms. 3.2 ms. 3.87 ms. 4.53 ms. 5.2 ms. 5.87 ms. 7.2 ms. 8.53 ms. 9.87 ms. 11.2 ms. 11.9 ms. 12.5 ms. 13.2 ms. 13.5 ms. 13.9 ms. 14.2 ms. 14.5 ms. 15.2 ms. 15.9 ms. 16.5 ms. 17.2 ms. 17.9 ms. 19.2 ms. 20.5 ms. 21.9 ms. 1. 2. 3. 4. 5. 6. 7. 8. 1 mm Figure 3.12 Below surface images for Impact IV (Fr = 76, We = 67, Re = 3178, tc = 1.85) (3000 FPS). - 99 -.
(8) A. B. C. D. E. -0.2 ms. 0 ms. 0.2 ms. 0.4 ms. 0.6 ms. 0.8 ms. 1 ms. 1.2 ms. 1.4 ms. 1.6 ms. 1.8 ms. 2 ms. 2.2 ms. 2.4 ms. 2.6 ms. 16.4 ms. 18 ms. 19.6 ms. 21.2 ms. 22.8 ms. 24.4 ms. 26.8 ms. 29.2 ms. 31.6 ms. 34 ms. 1. 2. 3. 4. 5 1 mm. Figure 3.13 Above surface images for Impact IV (Fr = 76, We = 67, Re = 3178, tc = 1.85) (5000 FPS). - 100 -.
(9) 3.6.3. Impact V (Fr = 83, We = 77, Re = 3425, tc = 1.80) A. B. C. D. 0.2 ms. 1.2 ms. 1.45 ms. 1.7 ms. 2.2 ms. 3.2 ms. 4.2 ms. 5.2 ms. 6.2 ms. 7.2 ms. 8.2 ms. 9.2 ms. 10.45 ms. 11.7 ms. 12.95 ms. 14.2 ms. 14.45 ms. 14.7 ms. 14.95 ms. 15.2 ms. 1. 2. 3. 4. 5. 6. 1 mm 16.2 ms. 18.2 ms. 20.2 ms. 22.2 ms. Figure 3.14 Below surface images for Impact V (Fr = 83, We = 77, Re = 3425, tc = 1.80) (4000 FPS). - 101 -.
(10) A. B. C. D. E. -0.2 ms. 0 ms. 0.2 ms. 0.4 ms. 0.6 ms. 0.8 ms. 1 ms. 1.2 ms. 1.4 ms. 1.6 ms. 2.6 ms. 4.2 ms. 5.8 ms. 9 ms. 12.2 ms. 13.8 ms. 15.4 ms. 17 ms. 18.6 ms. 20.2 ms. 1. 2. 3. 4. 1 mm 5. 21.8 ms. 23.4 ms. 25 ms. 28.4 ms. 31.4 ms. Figure 3.15 Above surface images for Impact V (Fr = 83, We = 77, Re = 3425, tc = 1.80) (5000 FPS). - 102 -.
(11) 3.6.4. Impact VI (Fr = 97, We = 90, Re = 3697, tc = 1.66) A. B. C. D. 1 -0.2 ms. 0.3 ms. 1.05 ms. 1.3 ms. 1.55 ms. 2.05 ms. 2.55 ms. 3.05 ms. 3.3 ms. 4.3 ms. 5.3 ms. 6.3 ms. 10.3 ms. 11.3 ms. 12.3 ms. 13.3 ms. 14.8 ms. 15.05 ms. 15.3 ms. 15.55 ms. 2. 3. 4. 5. 6. 1 mm 15.8 ms. 16.05 ms. 17.3 ms. 18.3 ms. Figure 3.16 Below surface images for Impact VI (Fr = 83, We = 77, Re = 3425, tc = 1.80) (4000 FPS). - 103 -.
(12) A. B. C. D. E. -0.2 ms. 0 ms. 0.2 ms. 0.4 ms. 0.6 ms. 0.8 ms. 1 ms. 1.2 ms. 1.4 ms. 1.6 ms. 16.8 ms. 17.4 ms. 17.8 ms. 18.2 ms. 18.6 ms. 19.8 ms. 21.2 ms. 22.6 ms. 24 ms. 25.4 ms. 1. 2. 3. 4. 1 mm. 5 26.8 ms. 28.2 ms. 29.6 ms. 31 ms. 32.4 ms. Figure 3.17 Above surface images for Impact VI (Fr = 83, We = 77, Re = 3425, tc = 1.80) (5000 FPS). - 104 -.
(13) A. B. 2.87 ms. 3.2 ms. 3.87 ms. 4.53 ms. 5.2 ms. 6.53 ms. 7.87 ms. 9.2 ms. 1. 2. 3. 4. Figure 3.18 Enlarged images from Impact IV. - 105 -. 1 mm.
(14) A. B. C. 0 ms. 0.25 ms. 0.5 ms. 0.75 ms. 1 ms. 1.25 ms. 1.5 ms. 1.75 ms. 2 ms. 2.25 ms. 2.5 ms. 2.75 ms. 11 ms. 11.25 ms. 11.5 ms. 1. 2. 3. 4. 5. 11.63 ms. 11.88 ms. 12.13 ms. 6. Figure 3.19 Down cavity images for a drop falling in the pre-entrapment jetting regime at 8000 FPS 1 mm (Estimated parameters We = 83, Fr = 149, Re = 3144, tc = 1.18). - 106 -.
(15) 3.6.5. Jetting. While no large vortex rings are formed in the pre-entrapment regime, jets and secondary drops are formed without bubble entrapment. In Impact IV the collapsing cavity gives rise to a small jet that breaks up to form a solitary drop. The secondary drop first appears in Figure 3.13 (B4) with a diameter of 380 µm andvelocity of 1.6 m/s. The main body of the jet appears shortly after in Figure 3.13 (C4) before reaching maximum height in Figure 3.13 (A5) and collapsing. A similar process occurs in Figure 3.15 (C4) where a solitary droplet exiting the cavity can be observed. This drop is approximately 403 µm in diameter and has a velocity of 1.8 m/s. The main jet body rises slightly higher than the previous impact but quickly collapses. As the impact velocity is increased further the velocity and quantity of secondary drops increases. In Figure 3.17 (A3) a small secondary drop becomes visible. This drop is approximately 190 µm in diameter with a velocity of 4.2 m/s. A second drop appears 0.6 ms later and has a diameter of 333 µm and a velocity of 2.5 m/s. The tip of the main jet becomes visible in Figure 3.17 (A4) and breaks up to form a third secondary drop in Figure 3.17 (B4) which has a diameter of 429 µm and a velocity of 1.19 m/s. This jet is similar to what occurs in the primary bubble entrapment regime. Thus, there are two different zones of jetting in the pre-entrapment regime. In the early stages of the regime the base of the cavity has a low curvature (Figure 3.14 (A5)) and collapses to produce a single slow moving drop. Increasing the velocity changes the cavity collapse dynamics and the cavity exhibits a sharp curvature (Figure 3.16 (C5)) before collapses to produce several high velocity drops. Thus, the curvature of the cavity tip before retraction appears to be related to the nature of the jets produced. Therefore, the key to understanding how these jets are produced will come from understanding how the cavity collapse process occurs and how it influences the curvature of the cavity prior to collapse. This issue will be addressed in Chapter 4 where the cavity formation and collapse dynamics will be investigated. The nature of the jets produced in this regime will also be explored in more detail in Chapter 5.. - 107 -.
(16) 3.7 Primary bubble entrapment regime The primary bubble entrapment regime is characterised by the formation of an air bubble after cavity collapse and has been well documented. The interest in the regime here revolves around understanding the changes in bubble size and variations in the jets observed.. 3.7.1. Bubble entrapment. At the lower Froude number end of the primary bubble entrapment regime, the bubbles formed are small (Impact VII – 276 µm) and do not oscillate significantly. The size of the entrapped bubble increases with increasing impact velocity (Impact VIII – 552 µm, Impact IX – 780 µm, Impact X – 852 µm). Thus, there appears to be a direct relation between the entrapped bubble size and impact velocity. The variation of bubble size across this regime will be further discussed in Chapter 6. Another point to note is that the larger bubbles oscillate for a longer period of time before coming before reaching a quasistatic position. Here we define a quasistatic position at the point in time when the disturbances on the bubbles surface ceased but the drop it self may still be moving upward or downward. In Impact IX and Impact X the bubble oscillations are so violent that the bubble can go from fully oblate to fully prolate and back again 3-4 times before it stops vibrating.. 3.7.2. Jetting. The upward jets formed in primary bubble entrapment regime are highly variable across the regime. In Figure 3.21 (C3), Impact VII, a series of very fine drops proceeds ahead of the thin jet. There is approximately 4 drops in this group which have a diameter of around 24 µm and are travelling at more than 16.5 m/s. These drops are virtually impossible to see in the image sets shown in this chapter. Clearer images are shown in Chapter 5. In total ten secondary drops are produced from the break up of the jet in this case. While in Impact VIII, which is at a higher impact velocity, the first drops associated with the break up of the jet exit the cavity with a velocity of 5.7 m/s and a diameter of 71 µm. Following this drop, approximately seven other drops are produced. Increasing the impact velocity even higher, Impact IX, the thin jet emanating out of the cavity begins with a group of four drops 25 µm in diameter with a velocity of 9.2 m/s, which is faster than the previous impact but slower than Impact VII. Following this. - 108 -.
(17) initial group of secondary drops approximately another eight drops follow. The main body of the jet appears in Figure 3.25 (A4) before reaching a maximum height in Figure 3.25 (C5). The main body of the jet reaches a higher height with increasing velocity due to more potential energy being available in the cavity. However, the initial drops formed from the break up of the thin jet does not appear to have any direct correlation to the impact velocity. The reason for this behaviour is linked to how the fluid converges at the point where bubble snap off occurs and will be described in more detail in Chapter 5.. - 109 -.
(18) 3.7.3. Impact VII (Fr = 111, We = 102, Re = 3928, tc = 1.55) A. B. C. D. 1 -0.25 ms. 0 ms. 0.25 ms. 0.5 ms. 0.75 ms. 1 ms. 1.25 ms. 1.5 ms. 2 ms. 3 ms. 4 ms. 5 ms. 6 ms. 8 ms. 10 ms. 12 ms. 14 ms. 15 ms. 16 ms. 16.25 ms. 16.5 ms. 16.75 ms. 18.5 ms. 20.5 ms. 2. 3. 4. 5. 6. 1 mm Figure 3.20 Below surface images for VII (Fr = 111, We = 102, Re = 3928, tc = 1.55) (4000 FPS). - 110 -.
(19) A. B. C. D. E. -0.1 ms. 0.1 ms. 0.5 ms. 0.75 ms. 0.9 ms. 1.1 ms. 1.3 ms. 1.7 ms. 2.7 ms. 4.3 ms. 9.1 ms. 16.3 ms. 17.9 ms. 18.3 ms. 18.7 ms. 1. 2. 3. 19.1 ms. 19.5 ms. 4. 26.5 ms. 29.3 ms. 20.9 ms. 22.3 ms. 24.5 ms. 30.7 ms. 33.5 ms. 37.3 ms. 5. 1 mm. Figure 3.21 Above surface images for VII (Fr = 111, We = 102, Re = 3928, tc = 1.55) (5000 FPS). - 111 -.
(20) 3.7.4. Impact VIII (Fr = 125, We = 116, Re = 4199, tc = 1.47) A. B. C. D. 0 ms. 0.75 ms. 1 ms. 1.25 ms. 1.5 ms. 2 ms. 2.5 ms. 3 ms. 3.5 ms. 5 ms. 7 ms. 9 ms. 11 ms. 13 ms. 15 ms. 16 ms. 16.75 ms. 17 ms. 17.25 ms. 17.5 ms. 18.5 ms. 20.5 ms. 22.5 ms. 24.5 ms. 1. 2. 3. 4. 5. 1 mm. 6. Figure 3.22 Below surface images for VIII (Fr = 125, We = 116, Re = 4199, tc = 1.47) (4000 FPS). - 112 -.
(21) A. B. C. D. E. 0.05 ms. 0.25 ms. 0.45 ms. 0.65 ms. 0.85 ms. 1.25 ms. 18.25 ms. 18.45 ms. 18.65 ms. 18.85 ms. 19.05 ms. 19.25 ms. 19.45 ms. 19.65 ms. 19.85 ms. 21.05 ms. 21.45 ms. 21.85 ms. 1. 2. 3. 20.25 ms. 20.65 ms. 4. 1 mm 5. 23.05 ms. 25.85 ms. 28.65 ms. 31.45 ms. 34.25 ms. Figure 3.23 Above surface images for VIII (Fr = 125, We = 116, Re = 4199, tc = 1.47) (5000 FPS). - 113 -.
(22) 3.7.5. Impact IX (Fr = 138, We = 127, Re = 4380, tc = 1.39) A. B. C. D. 0.07 ms. 0.4 ms. 0.73 ms. 1.07 ms. 1.4 ms. 1.73 ms. 2.07 ms. 2.4 ms. 2.73 ms. 3.07 ms. 3.4 ms. 3.73 ms. 6.73 ms. 9.4 ms. 12.07 ms. 16.07 ms. 16.73 ms. 17.4 ms. 18.07 ms. 18.4 ms. 19.07 ms. 19.73 ms. 20.4 ms. 21.07 ms. 21.73 ms. 22.4 ms. 23.07 ms. 60.4 ms. 61.73 ms. 63.07 ms. 64.4 ms. 1. 2. 3. 4 4.07 ms. 5. 6. 7. 1 mm. 8. Figure 3.24 Below surface images for Impact IX (Fr = 138, We = 127, Re = 4380, tc = 1.39) (3000 FPS). - 114 -.
(23) A. B. C. D. E. -0.2 ms. 0 ms. 0.2 ms. 0.4 ms. 0.6 ms. 0.8 ms. 1 ms. 1.2 ms. 1.4 ms. 1.6 ms. 19.4 ms. 19.8 ms. 20.2 ms. 20.6 ms. 21.2 ms. 22.6 ms. 23.4 ms. 1. 2. 19 ms 3. 21 ms. 24.2 ms 4. 1 mm. 5. 25 ms. 25.8 ms. 26.6 ms. 27.4 ms. 28.2 ms. Figure 3.25 Above surface images for Impact IX (Fr = 138, We = 127, Re = 4380, tc = 1.39) (5000 FPS). - 115 -.
(24) 3.7.6. Impact X (Fr = 170, We = 151, Re = 4751, tc = 1.24) A. B. C. D. 0 ms. 0.75 ms. 1 ms. 1.25 ms. 1.5 ms. 1.75 ms. 2 ms. 2.25 ms. 2.5 ms. 5 ms. 7.5 ms. 10 ms. 12.5 ms. 15 ms. 16.25 ms. 17.5 ms. 18.75 ms. 19 ms. 19.25 ms. 19.5 ms. 20.25 ms. 20.75 ms. 21.25 ms. 21.75 ms. 1. 2. 3. 4. 5. 6. 1 mm. Figure 3.26 Below surface images for Impact X (Fr = 170, We = 151, Re = 4751, tc = 1.24) (4000 FPS). - 116 -.
(25) A. B. C. D. E. -0.1 ms. 0.1 ms. 0.3 ms. 0.5 ms. 0.7 ms. 0.9 ms. 1.1 ms. 1.3 ms. 1.5 ms. 1.7 ms. 20.1 ms. 20.7 ms. 21.1 ms. 21.7 ms. 22.1 ms. 22.7 ms. 23.1 ms. 23.7 ms. 24.1 ms. 24.7 ms. 26.5 ms. 30.5 ms. 34.5 ms. 38.5 ms. 42.5 ms. 1. 2. 3. 4. 1 mm. 5. Figure 3.27 Above surface images for Iimpact X (Fr = 170, We = 151, Re = 4751, tc = 1.24) (5000 FPS). - 117 -.
(26) The initial development of the upward jet is shown in Figure 3.28 (A8). Here the jet is not totally perpendicular to the free surface. Rather it is curved towards the side of the cavity resulting in most of the initial drops exiting the cavity at a significant angle to the vertical (Figure 3.28 (B8)). This indicates that the collapse of the cavity is not always symmetrical. A short time after the jet begins to form it rapidly assumes a perpendicular direction and is coaxial to the axis of symmetry (Figure 3.28 (C9)). The final interesting jetting behaviour observed in this series of impacts is the first experimental evidence showing downward jets in liquid-liquid impacts (Figure 3.24). However, the jet structure is too small to see in this image sequence. It will be more clearly shown and described in Chapter 5.. A. B. C. 0 ms. 0.125 ms. 0.25 ms. 0.375 ms. 0.5 ms. 0.625 ms. 0.75 ms. 0.875 ms. 1 ms. 1.25 ms. 1.5 ms. 1.75 ms. 1. 2. 3. 4. 1 mm. - 118 -.
(27) A. B. C. 2 ms. 2.25 ms. 2.5 ms. 5. 5 ms. 6.25 ms. 8.75 ms. 6. 11.25 ms. 12.5 ms. 12.875 ms. 13 ms. 13.125 ms. 13.25 ms. 7. 8. 13.5 ms. 13.75 ms. 15.25 ms. 9. Figure 3.28 Down cavity images of a drop impact in the primary bubble entrapment regime (8 000 FPS) (Estimated parameters We = 110, Fr = 201, Re = 3596, tc = 1.01). 1 mm. - 119 -.
(28) 3.8 Primary bubble entrapment/Post-entrapment jetting transition At the upper end of the primary bubble entrapment regime, in the transition to postentrapment jetting, two or more large bubbles can become entrapped (Impact XI). This regime is also refereed to as multi-primary bubble entrapment in this thesis. In this impact the bubble entrapment occurs in Figure 3.29 (A8). The shape of this bubble is highly unstable and thus it begins to break up Figure 3.29 (B8). In Figure 3.29 (C8) the main bubble has broken up into two smaller bubbles of 660 µm and 775 µm in diameter. Both these bubbles undergo minor oscillations before reaching a quasistatic position. After the oscillations have subsided the entrapped bubbles rise upwards to the free surface. The main jet body appears in Figure 3.30 (A4). The thick jet reaches a maximum height in Figure 3.30 (E4) while its base continues to widen. No secondary drops are formed from this jet. This jet is also moving at a slower velocity than the jets in previous impacts and is similar to the types of jets observed in the post-entrapment jetting regime. Overall this region of behaviour is extremely narrow and somewhat variable. For the same impact conditions one bubble maybe entrapped instead of two or no bubbles may become entrapped. The bubbles themselves have been observed to either form independently of each other as the cavity collapses or from the entrapped bubble being so large that it is unstable breaks into two smaller bubbles. This also holds for the jets that are produced. In some cases where multiple large bubbles are entrapped there is a high speed jet but in other cases like Impact XI only slow thick jets are formed. A more detailed investigation of the multiple bubble formation mechanism will be addressed in Chapter 6.. - 120 -.
(29) 3.8.1. Impact XI (Fr = 174, We = 158, Re = 4891, tc = 1.23) A. B. C. D. -0.07 ms. 0.27 ms. 0.6 ms. 0.93 ms. 0.93 ms. 1.27 ms. 1.6 ms. 3.6 ms. 5.27 ms. 6.27 ms. 6.93 ms. 7.93 ms. 8.6 ms. 9.6 ms. 10.27 ms. 11.27 ms. 11.93 ms. 12.93 ms. 13.6 ms. 14.6 ms. 15.27 ms. 16.27 ms. 16.93 ms. 17.93 ms. 18.6 ms. 18.93 ms. 19.27 ms. 19.6 ms. 19.93 ms. 20.27 ms. 20.6 ms. 30.93 ms. 1. 2. 3. 4. 5. 6. 7. 1 mm. 8. Figure 3.29 Below surface images for Impact XI (Fr = 174, We = 158, Re = 4891, tc = 1.23) (3000 FPS). - 121 -.
(30) A. B. C. D. E. 0 ms. 0.2 ms. 0.4 ms. 0.6 ms. 0.8 ms. 1 ms. 1.2 ms. 1.4 ms. 1.6 ms. 1.8 ms. 3.8 ms. 5.8 ms. 7.8 ms. 9.8 ms. 11.8 ms. 21.8 ms. 23.8 ms. 25.8 ms. 27.8 ms. 29.8 ms. 31.8 ms. 33.8 ms. 35.8 ms. 37.8 ms. 39.8 ms. 1. 2. 3. 4. 1 mm 5. Figure 3.30 Above surface images for Impact XI (Fr = 174, We = 158, Re = 4891, tc = 1.23) (5000 FPS). - 122 -.
(31)
Figure


+7


Related documents
The focus is the manifold mass flow and pressure equations, and fuel evaporation dynamic, both of them are vital for Air/Fuel control and response, which is one of the most
A number of perceived biases were identified by subjects, sub-grouped into cultural factors, personality factors, perception of prior preparation, concerns with
AE: Adverse event; AR: Adverse reaction; B: Bendamustine; BMA/T: Bone marrow aspirate/trephine; CI: Confidence interval; CLL: Chronic lymphocytic leukaemia; CR: Complete
Methods/Design: This pilot randomized controlled trial will investigate the effects of a 6-month, individualized, moderate-intensity cycling intervention (20 to 50 minutes per
No studies to our knowledge have examined all three health measures (MVPA, sedentary behavior, components of sleep quality) using accelerometers to 1) compare health behaviors
Since the PM is composed of heterogeneous changing documents, we structure them using semantic annotations expressed with primitives provided by a shared ontology. RDF and
matching analysis), matching techniques (kernel matching and nearest neighbor matching; with and without the common support restriction for the range of propensity scores of treated
Allied’s Medical Administrative Assistant Program provides you with all the skills you will need to start a successful career as a medical administrative assistant!. You’ll gain
