JOURNAL OFVIROLOGY, Feb. 2007, p. 1912–1922 Vol. 81, No. 4 0022-538X/07/$08.00⫹0 doi:10.1128/JVI.01757-06
Copyright © 2007, American Society for Microbiology. All Rights Reserved.
Functional p53 Signaling in Kaposi’s Sarcoma-Associated Herpesvirus
Lymphomas: Implications for Therapy
䌤
†
Christin E. Petre, Sang-Hoon Sin, and Dirk P. Dittmer*
Lineberger Comprehensive Cancer Center, Center for AIDS Research and Department of Microbiology and Immunology, University of North Carolina, Chapel Hill, North Carolina 27599
Received 14 August 2006/Accepted 10 November 2006
The Kaposi’s sarcoma-associated herpesvirus (KSHV/HHV8) is associated with Kaposi’s sarcoma (KS) as well as primary effusion lymphomas (PEL). The expression of viral proteins capable of inactivating the p53 tumor suppressor protein has been implicated in KSHV oncogenesis. However, DNA-damaging drugs such as doxorubicin are clinically efficacious against PEL and KS, suggesting that p53 signaling remains intact despite the presence of KSHV. To investigate the functionality of p53 in PEL, we examined the response of a large number of PEL cell lines to doxorubicin. Two out of seven (29%) PEL cell lines harbored a mutant p53 allele (BCBL-1 and BCP-1) which led to doxorubicin resistance. In contrast, all other PEL containing wild-type p53 showed DNA damage-induced cell cycle arrest, p53 phosphorylation, and p53 target gene activation. These data imply that p53-mediated DNA damage signaling was intact. Supporting this finding, chemical inhibition of p53 signaling in PEL led to doxorubicin resistance, and chemical activation of p53 by the Hdm2 antagonist Nutlin-3 led to unimpaired induction of p53 target genes as well as growth inhibition and apoptosis.
Primary effusion lymphoma (PEL) or body cavity-based lym-phoma is a rapidly progressive disease often arising in the context of human immunodeficiency virus (HIV)/AIDS, but it is also seen in HIV-negative transplant recipients and in the elderly. PEL exists as a fluid tumor of B-cell origin within the serous cavities of the body. Current multidrug chemotherapies against PEL, such as CHOP (cyclophosphamide, doxorubicin [Dox], vincristine, and prednisone) target proliferating cells and typically include a DNA-damaging agent such as doxoru-bicin. These therapies are initially successful (64). However, the immunocompromised status of PEL patients makes them highly susceptible to the myelosuppressive side effects of high-dose chemotherapy regimens. As a result, the median survival time for those diagnosed with PEL is typically less than 3 months (1, 12), and there exists an urgent need for novel therapies against PEL.
All PEL tumor cells are infected with Kaposi’s sarcoma-associated herpesvirus (KSHV) (13, 49). KSHV is a member of the gamma-herpesviruses and was first isolated in the AIDS-associated malignancy Kaposi’s sarcoma (KS) (15). KSHV re-mains largely latent in PEL and expresses only a limited set of genes, including Kaposin/K12, v-cyclin/orf72, the latency-asso-ciated nuclear antigen (LANA)/ORF73, v-FLIP/ORF71, and the viral micro-RNAs (19, 26) (8, 23, 35, 51, 53, 58, 59). PEL are dependent upon KSHV for survival, as loss of the KSHV genome results in cell death (30). These results suggest that one or more KSHV oncogenes are essential for PEL survival. Following the precedence of the small DNA tumor viruses such as simian virus 40 and human papilloma virus, KSHV too
was hypothesized to contain viral genes that curb p53 function and thereby mediate viral oncogenesis.
p53 has been deemed the most frequently mutated gene in human cancer, with the majority of alterations localizing to the protein’s DNA binding domain (reviewed in reference 32). In response to DNA-damaging chemotherapeutics, p53 is acti-vated and functions as a sequence-specific transcription factor for a well-defined set of p53-responsive promoters. This in turn leads to a variety of cellular outcomes, including cell cycle arrest and apoptosis (reviewed in reference 69). p53 stability is tightly regulated by the ubiquitin ligase activity of the human Mdm2 homologue, Hdm2 (reviewed in reference 34). Overex-pression of Hdm2 is frequently noted in human cancers and provides a mechanism to inactivate p53 epigenetically (45). The Mdm2-p53 binding site is well defined (44), and recently novel compounds, such as Nutlin-3, that inhibit the Hdm2-p53 interaction have been proposed as therapeutics for tumors maintaining wild-type p53 status (33, 68). Nutlin-3, unlike doxorubicin, does not induce cellular DNA damage, thus al-lowing for the direct assessment of p53 function independent of any other effects that may be induced by DNA-damaging drugs. Neither the efficacy of Nutlin-3 for PEL treatment nor the functional status of p53 in the context of KSHV-positive tumor cells has been previously studied.
To examine p53 functionally in KSHV-associated cancers, we employed the largest set of patient-derived PEL lines pub-lished to date. As previously reported for clinical PEL and KS biopsies (14, 38, 46), we found that p53 mutations were infre-quent in PEL even after continued passage in culture (two of seven lines). The wild-type p53 genotype translated into a wild-type p53 phenotype, as PEL cells responded to physiolog-ically relevant levels of doxorubicin. PEL treatment with doxo-rubicin led to p53 phosphorylation, activation of downstream target genes, and subsequent cell cycle arrest, consistent with an intact p53 signaling pathway. Moreover, PEL lines
re-* Corresponding author. Mailing address: University of North Caro-lina at Chapel Hill, CB# 7290, 715 Mary Ellen Jones Bldg., Chapel Hill, NC 27599-7290. Phone: (919) 966-7960. Fax: (919) 962-8103. E-mail: [email protected].
† Supplemental material for this article may be found at http://jvi .asm.org.
䌤Published ahead of print on 22 November 2006.
1912
on November 8, 2019 by guest
http://jvi.asm.org/
sponded to Nutlin-3 in a p53- and Hdm2-dependent manner, evidencing a functional p53-Hdm2 pathway.
MATERIALS AND METHODS
Cell culture and materials.PEL cells and cell culture conditions were previ-ously described (Table 1) (2, 5, 7, 10, 13, 29, 42). Doxorubicin and Nutlin-3 (racemic) were obtained from Sigma and diluted in dimethyl sulfoxide (DMSO). Pifithrin-␣was obtained from Alexis Biochemicals and stored in DMSO.
p53 sequencing.cDNA was prepared from all PEL cell lines using the RNeasy mini kit (QIAGEN), 100 U of Superscript II reverse transcriptase (Life Tech-nologies), and random hexanucleotide primers (Amersham Pharmacia Biotech). The resulting cDNA was used to PCR amplify two regions of the p53 DNA binding domain spanning amino acids (aa) 126 to 224 and aa 225 to 331. The primers were as follows: aa 126 to 224 forward, 5⬘-TCTCCTTCCTCTTCCTAC AG-3⬘; reverse, 5⬘-ACCCCAGTTGCAAACCAGAC-3⬘; aa 225 to 331 forward, 5⬘-GGGCCTGTGTTATCTCCTAG-3⬘; reverse, 5⬘-GAGGTCCCAAGACTTA GTAC-3⬘. PCR was performed using the GeneAmp High Fidelity PCR system (Applied Biosystems) according to the manufacturer’s instructions. The resulting PCR products were cloned into pBluescript II KS(⫹) (Stratagene) and se-quenced.
MTT/cell viability assays.On day 0, cells were seeded at 3⫻105cells/1.5 ml complete media in 12-well dishes, and drugs and/or was vehicle added. Each day thereafter, 50l of cells was removed and incubated in a 96-well plate with 0.1 mg/ml MTT (3-[4,5-dimethylthiazol-2-yl]-2,5-diphenyl tetrazolium bromide; Sigma) for 4 h at 37°C and 5% CO2. The reaction was stopped, and formazan crystals were dissolved in a 0.1 N HCl-isopropanol solution. MTT metabolism (at an optical density of 570 nm [OD570]) was read and normalized to cell density (OD690). All assays were performed in triplicate. Graphs display the average growth relative to the untreated sample at day 1. Error bars represent the standard deviation. Alternatively, cell viability was determined from the 50-l
samples via trypan blue exclusion. The 50% inhibitory concentration (IC50) was calculated using a sigmoidal dose-response fit of the MTT assay results on day 4 and GraphPad Prism 4 software (GraphPad Software).
Western blotting. Cells were seeded in two flasks each containing 40 ml complete media at a concentration of 2⫻105cells/ml. The following morning, 0.025g/ml doxorubicin was added to both flasks, and 20 ml of one culture was immediately harvested (t⫽0 h). Eight, 24, and 48 h postdrug addition, 20 ml of culture was removed and centrifuged, and the cell pellet stored at⫺80°C. The resulting pellets were lysed in radioimmunoprecipitation assay buffer (150 mM NaCl, 1.0% NP-40, 0.5% deoxycholate, 0.1% sodium dodecyl sulfate [SDS], and 50 nM Tris [pH 8.0]) containing 1 nM phenylmethylsulfonyl fluoride, 1⫻ pro-tease inhibitor cocktail (Sigma), 10 nM sodium fluoride, 1 mM sodium vanadate, and 60 mM-glycerophosphate. Lysates were quantified using the BCA Protein Assay kit (Pierce Inc.), and proteins were separated on SDS–12% polyacryl-amide gels. Gels were transferred to Hybond-P (Amersham Biosciences) and probed for the indicated protein products. Primary antisera utilized were the following: p53 phosophoserine 15 (1:1,000; Cell Signaling), total p53 (1:1,000; Santa Cruz Biotechnologies), p21 (1:500; Santa Cruz), CDK6 (1:1,000; Santa Cruz), and Hdm2 (1:500; Ab-1; Calbiochem). Following incubation with horse-radish peroxidase-conjugated secondary antibodies (goat-␣-mouse immunoglob-ulin G; Santa Cruz; and goat-␣-rabbit immunoglobulin G; Vector Laboratories Inc.) and ECL substrate (Pierce Inc.), antibody-antigen complexes were visual-ized via autoradiography. Quantification of protein expression was conducted using ImageQuant software. Hdm2 levels were normalized to CDK6 (loading control). The relative level of p21 was determined using ImageJ software (Wayne Rashband, National Institutes of Health). Specifically, p21 band density was first normalized to CDK6 (loading control) and then the quantity was determined relative to 0 h for each cell line.
Flow cytometry.Cells were seeded and treated as described for the Western blotting experiments. At 0, 8, 24, and 48 h postdrug addition, cells were har-vested by centrifugation, fixed, and stained as we previously described (20, 52). Cells were analyzed on a Becton-Dickinson FACscan flow cytometer. At least 10,000 cells were analyzed per sample and graphed using FlowJo soft-ware (Tree Star Inc.).
Array design and implementation.Quantitative real-time PCR (QPCR) prim-ers were designed using Primer 3 software (http://frodo.wi.mit.edu/cgi-bin /primer3/primer3—www.cgi [57]) according to our standard parameters (47). Where possible, primer sets were chosen to span an intron so as to avoid background signal from any residual genomic DNA (Table 2). Real-time QPCR analysis was conducted as previously published (21, 22). The fold induction was determined for each time point using the following calculation: fold change⫽ 1.8(dCt1⫺dCt2)
, where dCt1 and dCt2 are the cycle thresholds normalized to that of GAPDH at times 1 and 2, respectively). Data were clustered using Array-Miner to produce a heat map diagram.
[image:2.585.44.283.82.174.2]Annexin V flow cytometry.BCBL-1, BCP-1, and BC-3 cells were seeded in duplicate at a density of 2⫻105cells/ml in a total of 40 ml. The cultures were immediately treated with either 5M Nutlin-3 (racemic) or vehicle (DMSO) alone. Forty-eight hours later, the cells were counted, spun down, and washed three times in ice-cold phosphate-buffered saline. Each pellet was resuspended in Annexin V binding buffer (0.01 M HEPES, pH 7.4, 14 mM NaCl, 2.5 mM CaCl2) TABLE 1. Analysis of PEL lines
Cell line Reference p53 status DOX IC50
(ng/ml) Tumor take (%)
BC-3 2 WT/WTe 7.48 3/3 (100)
VG-1 7 WT/WT 14.9 7/10 (70)
BCLM 29 WT/WT 5.56 4/5 (80)
JSC-1 10 WT/WT 18.0 1/5 (20)
BC-1 12 WT/WTa 4.52 10/10 (100)
BCBL-1 42 WT/M246Ib 31.2 6/7 (86)c
BCP-1 5 S262/S262 Ins ⬎75.0 6/6 (100)d a
Previously reported by Chadburn et al. (14).
b
Previously reported by Katano et al. (38).
c
Previously reported by Staudt et al. (65).
d
Previously reported by Boshoff et al. (5).
e
WT, wild type.
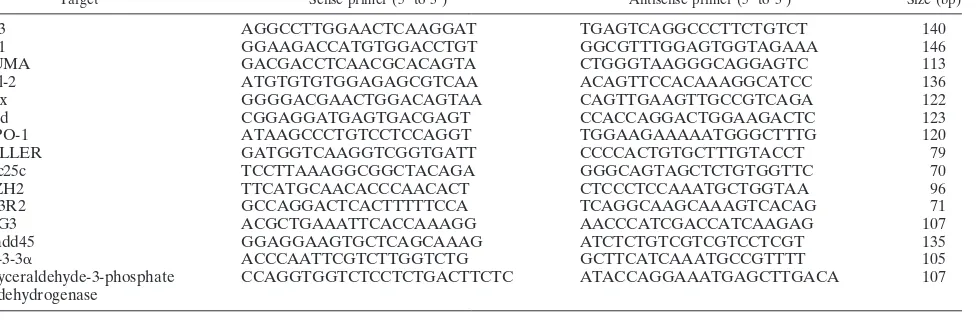
TABLE 2. Primers for real-time QPCR p53 target gene analysis
Target Sense primer (5⬘to 3⬘) Antisense primer (5⬘to 3⬘) Size (bp)
p53 AGGCCTTGGAACTCAAGGAT TGAGTCAGGCCCTTCTGTCT 140
p21 GGAAGACCATGTGGACCTGT GGCGTTTGGAGTGGTAGAAA 146
PUMA GACGACCTCAACGCACAGTA CTGGGTAAGGGCAGGAGTC 113
Bcl-2 ATGTGTGTGGAGAGCGTCAA ACAGTTCCACAAAGGCATCC 136
Bax GGGGACGAACTGGACAGTAA CAGTTGAAGTTGCCGTCAGA 122
Bad CGGAGGATGAGTGACGAGT CCACCAGGACTGGAAGACTC 123
APO-1 ATAAGCCCTGTCCTCCAGGT TGGAAGAAAAATGGGCTTTG 120
KILLER GATGGTCAAGGTCGGTGATT CCCCACTGTGCTTTGTACCT 79
cdc25c TCCTTAAAGGCGGCTACAGA GGGCAGTAGCTCTGTGGTTC 70
EZH2 TTCATGCAACACCCAACACT CTCCCTCCAAATGCTGGTAA 96
p53R2 GCCAGGACTCACTTTTTCCA TCAGGCAAGCAAAGTCACAG 71
PIG3 ACGCTGAAATTCACCAAAGG AACCCATCGACCATCAAGAG 107
Gadd45 GGAGGAAGTGCTCAGCAAAG ATCTCTGTCGTCGTCCTCGT 135
14-3-3␣ ACCCAATTCGTCTTGGTCTG GCTTCATCAAATGCCGTTTT 105
Glyceraldehyde-3-phosphate dehydrogenase
CCAGGTGGTCTCCTCTGACTTCTC ATACCAGGAAATGAGCTTGACA 107
on November 8, 2019 by guest
http://jvi.asm.org/
[image:2.585.52.541.558.723.2]to reach a final concentration of 1⫻107
cells/ml. Five 100-l aliquots were generated from each condition, and four were incubated with 5l of fluorescein isothiocyanate-conjugated Annexin V antibody (Caltag Laboratories, Burlin-game, CA) for 15 min at room temperature. The remaining sample was used as a control. Flow cytometry was performed on⬃10,000 cells per sample using a FacScan instrument and analyzed using FloJo software.
RESULTS
p53 (aa 126 to 331) is wild type in PEL based on sequence analysis.As p53 is rarely mutated in KS, we hypothesized that other KSHV-associated tumor types would retain wild-type p53 status. To test this hypothesis, we examined the genotypes of seven culture-adapted PEL cell lines. This extensive panel of cultures is representative of all cells widely utilized in experi-mental research today (Table 1). All seven lines were KSHV positive. Two cell lines (BC-1 and JSC-1) were coinfected with Epstein-Barr virus (EBV) (10, 13). To determine the mutation status of p53, we employed high-fidelity PCR on PEL-derived cDNA with primers that cover the previously identified hot spot region (aa 126 to 331). The corresponding PCR products were cloned into pBluescript, and at least eight clones were sequenced per cell line. BCBL-1 cells were determined to be heterozygous for the M246I mutation as previously reported (38). BCP-1 cells contained a homozygous insertion at codon 262. All other cell lines contained wild-type p53 sequence. These data demonstrate that p53 mutations were present in
ⱕ30% (two of seven) of PEL, all of which grow permanently in culture and form tumors in nude mice (Table 1 reference 65).
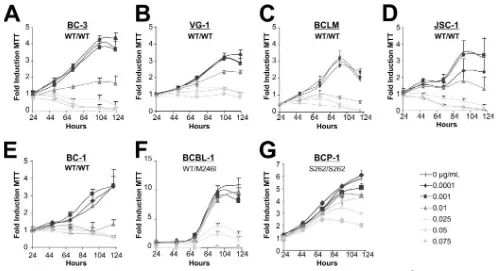
PEL growth is effectively limited by doxorubicin. The cur-rent standard of care for PEL treatment includes chemother-apeutics such as anthracyclines (e.g., doxorubicin, daunorubi-cin, and mitoxantrone). These agents function through DNA intercalation and oxidative radical formation to induce the p53-dependent DNA damage pathway (reviewed in reference 28). Since p53 was wild type by sequence in PEL, we assessed the ability of doxorubicin (Dox) to limit cellular viability. Each cell line was seeded at equal density in 12-well dishes, and Dox and/or vehicle (water) was added to the culture at the indicated dosages. At designated times thereafter, a sample was removed from each culture and the cellular viability was assessed using an MTT assay. All treatments were performed in triplicate wells, and results of the MTT assays directly paralleled those obtained by trypan blue exclusion counts (data not shown). The dosages of doxorubicin utilized (0.001 to 0.075 g/ml) were clinically relevant, as patient serum concentrations of the drug have been reported to be as high as 11g/ml following administration at 60 to 70 mg/m2(6). As seen in Fig. 1, PEL
lines harboring the wild-type p53 allele (BC-3, VG-1, BCLM, BC-1, and JSC-1) were susceptible to Dox (complete response at 0.01 to 0.025 g/ml). This phenotype was independent of EBV status, as both the JSC-1 and BC-1 cell lines also re-sponded to Dox treatment. A higher tolerance for Dox was observed in an allele-specific, dose-dependent manner in both BCP-1 and BCBL-1 cells. Significantly, BCP-1 proliferation continued in the presence of 0.075g/ml Dox. Utilizing data from day 4, wherein the optimal growth differential was
ob-FIG. 1. PEL lines are sensitive to doxorubicin. (A to G) PEL-derived cell lines were seeded in triplicate at 2⫻105cells/ml. The indicated dosage of doxorubicin (in micrograms/milliliter) and/or vehicle (double-distilled H2O) was added to each sample. Twenty-four hours postseeding and treatment, a sample was removed and cell survival was scored by MTT assay. Similar MTT measurements were performed every 24 h as indicated. Raw MTT numbers were normalized to the average reading of the untreated sample at day 1. Data shown represent three independent points, with error bars indicating the standard deviations. WT, wild type.
1914 PETRE ET AL. J. VIROL.
on November 8, 2019 by guest
http://jvi.asm.org/
[image:3.585.39.538.65.336.2]served for all lines, the IC50was calculated for each cell line.
Doxorubicin susceptibility directly correlated with p53 status (Table 1). These results demonstrate that PEL lines containing the wild-type p53 genotype also exhibit a wild-type p53 phe-notype as measured by the cell response to the DNA-damaging agent Dox.
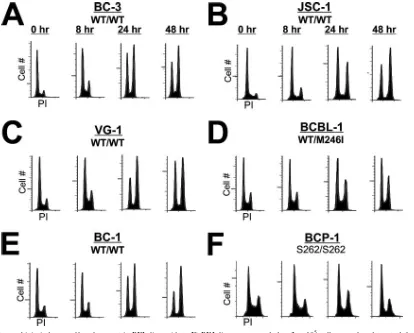
p53 mediates DNA damage-induced growth arrest in PEL.
To assess whether Dox treatment resulted in growth arrest, cell cycle distribution was determined by propidium iodide (PI) incorporation. PEL lines were seeded at equal density and treated with an inhibitory concentration of Dox (0.025g/ml), and samples were analyzed at 0, 8, 24, or 48 h following treat-ment. As seen in Fig. 2, all PEL lines treated with Dox dem-onstrated marked arrest at the G1/S and G2/M checkpoints,
indicative of a p53-mediated DNA damage response. By 48 h, the G2/M population of cells harboring wild-type p53 had
in-creased dramatically (between 14 and 38%). In contrast, accu-mulation of BCP-1 and BCBL-1 cells, which contain a mutant p53 allele, in G2/M was significantly reduced (less than 10%
increase). Analysis of the sub-G1 population by this method
revealed little apoptotic induction in any of the cell lines within the time period examined. This observation may be explained by the relatively slow growth rate of the PEL lines in culture and/or a molecular mechanism that delays apoptosis. To-gether, these data support the growth analyses performed in
Fig. 1 and demonstrate that DNA damage in p53 wild-type PEL lines resulted in cell cycle arrest.
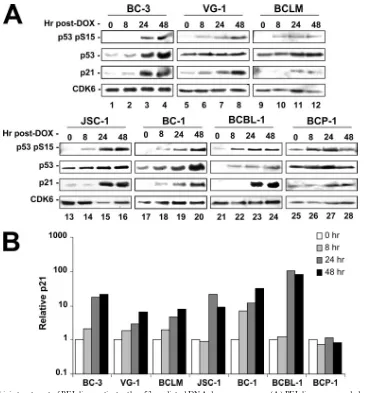
The p53 signaling cascade is fully functional in response to doxorubicin. To further evaluate p53 function in PEL, we examined the ability of upstream DNA damage sensors such as ATM to activate and initiate p53 signaling in Dox-treated cells. Specifically, PEL lines were seeded at equal density, treated with an inhibitory concentration of Dox (0.025 g/ml), and sampled at 0, 8, 24, or 48 h following treatment. Cell pellets were lysed, and equal protein concentrations were run on SDS-polyacrylamide gels. The resulting gels were transferred to nitrocellulose and probed as indicated. p53 phosphorylation on serine 15 is an indicator of upstream DNA damage signaling (3, 9) and was readily induced as early as 8 h post-Dox treat-ment (Fig. 3). Interestingly, BCP-1 cells showed constitutive, elevated levels of phosphoserine 15. However, p21 was not induced, suggesting that the S262 insertion leads to a defect in downstream signaling. All cell lines containing wild-type p53 displayed marked induction of the p53 target gene, p21 (cip1/ waf-1) (24). These data are quantified in Fig. 3B. CDK6 served as a loading control and remained constant across all samples and all time points. All cells containing at least one wild-type copy of p53 responded to drug treatment, whereas the BCP-1 cell line (homozygous mutant) showed no elevation of p53 signaling as measured by p21 induction following Dox
treat-FIG. 2. Doxorubicin induces cell cycle arrest in PEL lines. (A to F) PEL lines were seeded at 2⫻105cells per ml and treated the following day with 0.025g/ml doxorubicin. Cells were harvested 0, 8, 24, and 48 h posttreatment. The cells were fixed, and DNA content was analyzed by propidium iodide (PI) flow cytometry. Shown are histograms representing the cell cycle profile ofⱖ10,000 cells. WT, wild type.
on November 8, 2019 by guest
http://jvi.asm.org/
[image:4.585.85.499.67.400.2]ment. These data demonstrate that both upstream and down-stream p53-dependent signaling was functional in p53 wild-type PEL irrespective of the presence of KSHV.
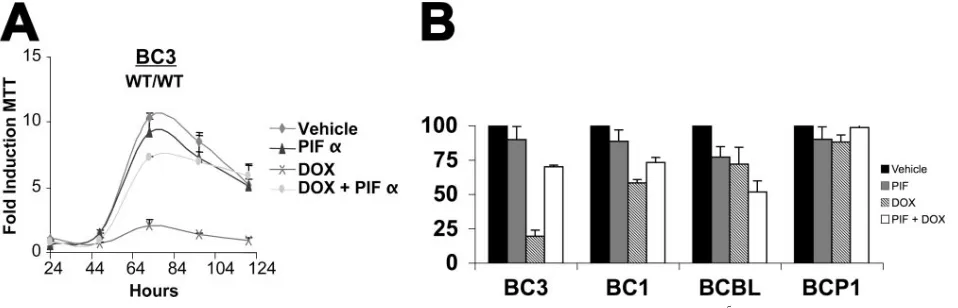
Functional p53 is required to mediate DNA damage-induced inhibition of PEL growth.To test the hypothesis that activation of p53 is necessary to mediate cell cycle arrest in response to DNA-damaging agents, we conducted Dox treatment in the presence of the p53 inhibitor pifithrin␣(p-fifty three inhibitor
␣[PIF␣]) (43). BC-3 (wild type/wild type) cells were pretreated overnight with PIF␣or vehicle. Dox (0.025g/ml) and/or ve-hicle was then added, and cell viability was assessed by MTT assays. Figure 4A shows our results graphed as the average fold growth increase relative to the untreated sample on day 1. PIF␣-treated, Dox-exposed BC-3 cells demonstrated resis-tance to doxorubicin and proliferated similarly to the un-treated controls. By contrast vehicle-un-treated, Dox-exposed
BC-3 cells ceased to proliferate. PIF␣or vehicle alone had no effect. These data imply that p53 is required to inhibit cellular proliferation following Dox treatment of PEL. Figure 4B shows the relative growth retardation as a percent of vehicle control (black bars) for a set of four PEL cell lines at 72 h posttreatment. PIF␣alone (gray bar) had no or minor toxicity. Dox (striped bars) reduced cell growth significantly in the wild-type BC-3 and BC-1 cells, less in the heterozygous p53 BCBL-1 cells, and not at all in the homozygous p53 BCP-1 cells. PIF␣(open bars) counteracted the effect of Dox in the wild-type p53 BC-3 and BC-1 cells but not the p53 mutant cells. In the p53 heterozygous BCBL-1, PIF␣ seemed to augment Dox, while in the p53 homozygous mutant p53 BCBP-1 cells PIF␣had no effect.
[image:5.585.107.472.65.458.2]Activation of p53 is sufficient to inhibit PEL growth inde-pendent of DNA damage.To test the hypothesis that activation
FIG. 3. Doxorubicin treatment of PEL lines activates the p53-mediated DNA damage response. (A) PEL lines were seeded at 2⫻105cells per ml in a total of 2 volumes of 40 ml each. The following morning, the cells were treated with 0.025g/ml doxorubicin and an initial aliquot of 20 ml was immediately obtained (t⫽0 h). At the indicated time points following drug addition, cells were collected and pellets were frozen. Lysates from the time course were quantified, and equal amounts of protein were loaded for SDS-polyacrylamide gel electrophoresis analysis. Gels were transferred and blotted for the indicated protein products. Here, CDK6 is utilized as a loading control, p21 as a marker for p53 transcriptional activity, and phosphoserine 15 as an indicator of upstream DNA damage signaling. (B) Using densitometry, p21 expression was normalized to CDK6 (loading control), and the relative induction over levels observed at 0 h was determined for each time point.
1916 PETRE ET AL. J. VIROL.
on November 8, 2019 by guest
http://jvi.asm.org/
of p53 is sufficient to mediate the cell cycle arrest in PEL, we used a recently discovered chemical activator of p53, Nutlin-3. Nutlins are selective compounds which target the Hdm2-p53 interaction to prevent p53 degradation (67, 68). To test the efficacy of Nutlin-3 in PEL, we conducted cell viability assays. Specifically, we seeded our panel of cells at equal density and added racemic Nutlin-3. Next, cell viability was determined through trypan blue exclusion counts. Nutlin-3 significantly reduced cell proliferation in the majority of PEL lines harbor-ing wild-type p53 (VG-1, BCLM, JSC-1, and BC-1) at low dosage (2.5M) (Fig. 5). BC-3 cells displayed resistance to low-dose Nutlin-3 but ceased proliferation readily at a 5M dose. Growth inhibition by Nutlin-3 was compromised at low doses in PEL cells harboring a mutant p53 allele (BCP-1 and BCBL-1). As expected, DG75 B-cell lymphoma cells which harbored mutant p53 (17), but neither KSHV nor EBV, were completely resistant to 3. The p53 dependence of Nutlin-3 was even more striking when we used Annexin V positivity as a measure for cell death (Fig. 5I). Thus, Nutlin-3 response follows p53 status in a gene-dose-dependent manner, i.e., the susceptibility to Nutlin increased by the following relationship: homozygous mutant p53 (BCP-1 and S262/S262)⬍ heterozy-gous mutant p53 (BCBL-1 and M246I)⬍ homozygous wild-type p53 PEL. This validates Nutlin-3 as a p53-dependent treatment alternative for PEL. Moreover, use of Nutlin-3 in these studies demonstrates that p53 activation, independent of DNA damage, is sufficient to cause cell cycle arrest in PEL.
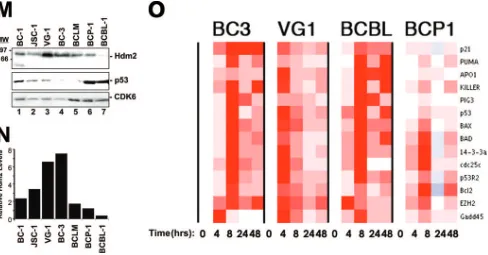
Nutlin efficacy directly correlates with Hdm2 status (50). To examine whether increased Hdm2 expression levels can ex-plain the robust response of PEL to Nutlin, we first examined Hdm2 mRNA levels in PEL using data from Klein et al. (40), which represents the transcriptional profile of over 60 B-cell tumors. Hdm2 mRNA levels served as a class prediction marker for PEL, clearly separating PEL samples from all oth-ers in the study (Fig. 5J, top panel). In fact, the predictive value of Hdm2 mRNA for the classification of PEL was as high as that of a previously validated marker, the vitamin D receptor (36). To verify Hdm2 protein expression we performed
West-ern blotting analysis. Hdm2 levels were high and relatively consistent across all PEL lines (Fig. 5K), with the exception of BCBL-1 cells, which showed lower Hdm2 levels (Fig. 5L, lane 7). In sum, intact p53 signaling as well as elevated levels of Hdm2 contribute to the marked sensitivity of PEL to Nutlin-3. Previous reports demonstrate that the induction of p53 tar-get genes in response to Nutlin-3 treatment is tumor type dependent (16, 41, 60, 67). To test the hypothesis that the p53 transcriptional response is consistent across multiple PEL tu-mors, we developed a quantitative real-time QPCR array for 14 experimentally validated p53 target genes (Table 2). PEL were treated with 5M Nutlin-3 (an inhibitory concentration for all cell lines), and cells were harvested 0, 8, 24, and 48 h thereafter. RNA was isolated, reverse transcribed, and sub-jected to real-time QPCR. All PEL lines harboring the wild-type p53 allele showed induction of p53 target genes in re-sponse to Nutlin-3, which peaked at 8 h (Fig. 5M). By contrast, target gene induction was limited in the p53 mutant BCP-1 cells. Neither nontemplate control nor reverse transcriptase-omitting reactions generated PCR products as determined by gel electrophoresis and melting curve analysis (data not shown). These findings suggest that the p53 status of the BCP-1 line (S262/S262) limits p53 transcriptional capabilities. The observation that BCBL-1 cells robustly induce all p53 target genes is consistent with the previously reported pheno-type of the M246I mutation (56) and indicates that BCBL-1 cells may have developed apoptotic resistance through addi-tional mutations. Together, these findings show that p53 sig-naling is fully functional in PEL, engaging multiple pathways to mediate the therapeutic effects of Nutlin-3 and DNA-damag-ing agents.
DISCUSSION
[image:6.585.51.530.68.222.2]DNA-damaging chemotherapeutic regimens are clinically efficacious for the KSHV-associated malignancies KS and PEL. Typically, the tumor response to chemotherapy is depen-dent upon functional p53. However, an in-depth analysis of
FIG. 4. PEL response to doxorubicin is p53 dependent. (A) BC-3 cells were seeded in triplicate at 2⫻105cells per ml in a 12-well dish with the indicated amount of pifithrin-alpha (PIF) or vehicle (DMSO). Following 24 h of pretreatment, 0.025g/ml doxorubicin (DOX) or vehicle (double-distilled H20) was added to the media. MTT assays were then performed every 24 h post-DOX addition as described in the legend to Fig. 1. Cell growth was normalized to the MTT reading of vehicle-treated cells on day 1. Points represent the average reading of three independent samples with error bars indicating the standard deviations. (B) Relative growth (percent vehicle control) at 72 h of culture for the indicated PEL cell lines either mock treated (black bars), PIF treated (gray bars), DOX treated (striped bars), or PIF and DOX treated (open bars). WT, wild type.
on November 8, 2019 by guest
http://jvi.asm.org/
1918
on November 8, 2019 by guest
http://jvi.asm.org/
p53 function in PEL has been missing, because multiple pro-teins of the PEL-associated human tumor virus KSHV were shown to inhibit p53 in ectopic expression experiments (27, 31, 48, 55, 61, 62), thus asserting the dogma that all DNA tumor viruses inactivate p53. If this were true, the presence of KSHV would severely limit the treatment options for PEL and other KSHV-associated cancers. PEL should not be responsive to CHOP, which is in contrast to the clinical experience (64). To test the hypothesis that p53 is fully functional in PEL despite the presence of viral oncogenes, we assessed p53 status and function in response to the prototypical DNA-damaging agent doxorubicin. Analyzing the most extensive panel of PEL lines published to date, we find that, similar to KS (38), p53 muta-tions are rarely detected in PEL (Table 1). DNA damage-induced p53 activation is intact in PEL harboring wild-type p53, as evidenced by target gene induction and cell cycle arrest following treatment with clinically relevant doses of doxorubi-cin (Fig. 1, 2, and 3). These data imply that in PEL the p53 status dictates the response to chemotherapeutics regardless of KSHV viral latent proteins.
We corroborated our initial observations by modifying p53
[image:8.585.46.534.68.323.2]signaling using the well-characterized activator Nutlin-3 (Fig. 5) or the p53 inhibitor pifithrin-alpha (Fig. 4). The phenotypic response to each of these drugs, as well as the p53-dependent transcriptional response, correlated tightly with p53 status, ad-ducing that DNA damage-induced p53 signaling is functional. How, then, can we reconcile these data with reports demon-strating disruption of p53 signaling by lytic and latent KSHV viral proteins? KSHV lytic proteins have been shown to inhibit p53 function through coactivator sequestration (Rta/ORF50) (18, 31), repression of ATM-mediated DNA damage signaling (v-IRF) (62), or other unknown mechanisms (K-bZIP) (48). Neither Rta/ORF50, K-bZIP, nor vIRF-1 is expressed during latency in PEL (26). These transcripts are only detectable upon viral reactivation. Herpesvirus reactivation leads to replication of the viral genomic DNA, which is resolved through recom-bination into unit-length pieces that are packed into the virion. This process generates many DNA double-strand ends, and it is therefore highly plausible that KSHV evolved to inhibit the p53/ATM response during the lytic phase of the viral life cycle. The KSHV latency-associated nuclear antigen (LANA) also binds and inhibits p53 function in reporter assays (27, 71).
FIG. 5. Nutlin-3 efficacy in PEL is Hdm2 and p53 dependent. (A to H) PEL lines were seeded at 2⫻105cells/ml in a total of 5 ml. The indicated dosage of Nutlin-3 (racemic) or vehicle (DMSO) was then added to the cells. Twenty-four, 48, 72, and 96 h post-Nutlin-3 addition, cell viability was determined using trypan blue exclusion. DG75 cells do not contain KSHV or EBV. (I) BCBL-1, BCP-1, and BC-3 cells were seeded in media containing 5M Nutlin or vehicle (DMSO) alone. Forty-eight hours later, samples were analyzed in quadruplicate for Annexin V positivity. Bar graphs represent the average Annexin V-positive population in each sample. Error bars show the standard deviation. WT, wild type. (J) Tran-scription profile analysis of Hdm2 transcript levels in PEL. Using Affymetrix data from 101 B-cell tumors and controls previously recorded by Klein et al. (40), we identified mRNAs that classify PEL away from all other tumors. These markers include the previously identified vitamin D receptor (K) and Hdm2 (L) and are shown using a bar graph representation of the average of median-centered mRNA levels for each tumor type. Each group representsⱖ6 examples. (BL, Burkitt’s lymphoma; DLBL, diffuse large B-cell lymphoma; CB, centroblastic; IB, immunoblastic). (M) PEL lines grown in complete media were harvested, and lysates were quantified. Equal protein quantities were separated by SDS-polyacrylamide gel electrophoresis, transferred, and immunoblotted for Hdm2, p53, and CDK6 (loading control) expression (top panel). Band intensities were quantified using ImageQuant software and normalized to CDK6. (N) The relative expression of Hdm2. (O) PEL lines were seeded, treated with 5M Nutlin-3, and harvested at increasing time points as described in the legend to Fig. 3. Following RNA isolation, cDNA was generated using random hexamer-primed reverse transcription. cDNA was subjected to quantitative real-time PCR for the indicated targets. Data were collected, and the relative change in gene expression was determined by calculating the difference between dCt1 and dCt2. Data were analyzed using ArrayMiner. Red represents gene induction relative to the median of all genes and data points in the array.
on November 8, 2019 by guest
http://jvi.asm.org/
Conversely, p53 can inhibit the LANA promoter (37). Unlike the lytic proteins, LANA is constitutively expressed in all PEL cells (19, 23, 66). LANA, like p53, is a relatively “sticky” pro-tein, binding to many partners in vitro. Due to the multitude of LANA binding partners (ⱖ10) and functions (63), it has been considerably more difficult to establish the specificity and func-tionality of the p53-LANA complex. LANA binds to the his-tone core components H2A, H2B, and H1, thereby tethering the viral episome to host chromatin (4). This interaction results in the characteristic nuclear speckled pattern observed using LANA-specific monoclonal antibodies (39, 54). It is conceiv-able that some p53 would be sequestered into these complexes, which also contain Ku70, Ku80, and PARP-1. The results pre-sented here show that the nature of the LANA-p53 complex is such that enough functional p53 is available to mediate PEL cell cycle inhibition in response to DNA damage or to Nutlin-3. In fact, upon Nutlin-3 treatment p53 and LANA occupy dis-tinct, nonoverlapping nuclear compartments (Fig. S1 in the supplemental material).
The rarity of p53 mutations observed herein expands upon an earlier report (46), which similarly did not detect p53 mutations in primary PEL biopsies. The p53 mutations in two of the cell lines examined (Table 1) may reflect the origins of the patient samples. BCP-1 cells (p53, S262/S262) were derived from an HIV-negative, 94-year-old man with previous history of both KS and colon cancer (5). This individual was treated for 3 years with prolonged chemo-therapy before succumbing to the disease, whereupon the BCP-1 cell line was isolated. Likewise, BCBL-1 (wild type/ M246I) cells were derived from an HIV-positive patient who underwent prior chemotherapeutic treatment with doxoru-bicin (42). Unlike other primary effusions, which typically fail to grow after a period of 14 days upon explantation in culture, BCBL-1 cells grew rapidly with no discernible lag phase (B. Herndier and D. Ganem, personal communica-tion). BCLM and JSC-1 were isolated prior to therapeutic administration and maintained wild-type p53 function. Thus, long-term PEL culture is compatible with p53 activity, and only prolonged treatment with DNA-damaging agents in vivo appears to select for p53 mutations.
The M246I and S262 mutations identified in these PEL lines were previously reported in other cancers. The M246I muta-tion (BCBL-1) was initially identified in the H23 lung cancer cell line and was reported to maintain DNA binding to con-sensus p53 binding elements (56). However, transactivation of nonconsensus elements by p53 M246I was limited, resulting in decreased apoptotic induction. While the Mdm2 promoter (consensus element) was effectively induced by M246I, PIG3 (nonconsensus) transactivation was significantly reduced. This is consistent with the phenotype of BCBL-1 cells, which dem-onstrated intense induction of p53 target genes following Nutlin-3 treatment yet failed to undergo significant apoptosis (Fig. 5). Far less is known about the p53 S262 insertion mutant. Previously identified in pancreatic cancer (11), a characteriza-tion of the mutant has yet to be conducted. Our findings suggest that S262 has little transactivation potential, as few genes were induced in the Nutlin-3 array studies. Additionally, BCP-1 cells (S262/S262) demonstrated a low background level of all p53 transcripts assayed, further implying that this signal-ing pathway is disrupted (data not shown). Understandsignal-ing how
individual p53 mutations contribute to therapeutic response will be essential to providing individualized PEL therapy.
Structural studies of the p53-Mdm2 interaction have re-vealed evidence that three key residues (Phe, Trp, and Lev) of p53 bind to a deep cavity on the Mdm2 surface (44). Nutlins represent the most potent and selective inhibitors of this in-teraction described to date. Nutlins arecis-imidizoline analogs, capable of penetrating cellular membranes, and thus can be administered orally (68). Nutlin-3 was well tolerated in murine xenograph studies (up to 200 mg/g of body weight twice daily), wherein the growth of p53-positive tumors was inhibited (67). Recent studies implicate Nutlin-3 as a novel therapeutic for B-cell chronic lymphocytic leukemia (B-CLL) and acute my-eloid leukemia (AML) (16, 41, 60). Interestingly, these previ-ous studies utilized the purified, active Nutlin-3a enantiomer. Herein, we studied the effects of the racemic mixture (contain-ing a 1:1 ratio of active [3a] versus inactive [3b] enantiomer). By comparison, PELs were more sensitive to Nutlin-3 treat-ment than B-CLL and AML (Fig. 5; 2.5 to 5.0M racemic versus 4.7 and 5M Nutlin-3a, respectively), perhaps reflect-ing their phenotypically elevated Hdm2 expression. PELs har-boring the wild-type p53 allele exhibited significant apoptosis following Nutlin-3 treatment; however, PEL lines with ho-mozygous, mutant p53 failed to proliferate only at increased doses of drug (Fig. 5). BC-3 cells deviated somewhat from the phenotype of other p53 wild-type cell lines, and further studies are under way to clarify this phenotype. One possible explana-tion is that BC-3 cells express a high level of HdmX (unpub-lished observation). Increased HdmX levels would explain their partial resistance to Nutlin-3, since Nutlin-3 fails to block the p53-HdmX interaction (50). Alternatively, Nutlin-3 may affect other targets than p53 (25, 70). A key finding of this study is that Hdm2 is overexpressed in PEL. Moreover, Hdm2 mRNA levels can be utilized to classify PEL away from diffuse large B-cell lymphoma and other B-cell-lym-phoproliferative diseases (Fig. 5). The underlying mecha-nism for this phenotype is currently under investigation. Regardless, these data explain the dramatic susceptibility of this tumor type to Nutlin-3.
The use of a novel targeted p53 retime QPCR array al-lowed us to molecularly characterize PEL response to Nutlin-3. Activation of the p53 transcriptome following Nutlin-3 addi-tion differs between PEL and other hematological malignan-cies. In B-CLL, Nutlin-3a activates Mdm2, p21, and PUMA expression but not BAX (16). In AML, Nutlin-3a activates Mdm2, p21, and NOXA but not PUMA or BAX (41). Here we find that in PEL, Nutlin-3 rapidly (⬍8 h) activates multiple p53 targets, including p21, NOXA, PUMA, and BAX (Fig. 5). Independent of the specific transcriptional targets activated, the cellular outcome, namely growth inhibition and apoptosis, is the same for PEL, B-CLL, and AML. PEL is a rapidly progressing disease, wherein the immunocompromised status of the patient often influences the physician’s ability to admin-ister therapy. Our findings suggest that determination of p53 and Hdm2 status is critical to the assessment of potential therapeutic regimens. KSHV oncogenes did not influence the ability of PEL to respond to DNA-damaging agents. However, they may modulate p53 function at steady-state growth or during KSHV lytic replication. Nutlins and other
p53-activat-1920 PETRE ET AL. J. VIROL.
on November 8, 2019 by guest
http://jvi.asm.org/
ing compounds may prove highly efficacious for the treatment of PEL patients.
ACKNOWLEDGMENTS
We thank D. Ganem, R. Ambinder, D. Stadden, E. Cesarman, and W. Harrington for providing the cell lines utilized in these studies. We thank B. Damania and K. Knudsen for critical reading of the manu-script as well as members of the Dittmer laboratory, L. Mayo, and A. Baldwin for their helpful discussions. We especially thank Thomas W. Marshall and James E. Bear for providing the equipment and expertise to generate the confocal images shown in Fig. S1 in the supplemental material.
This work was supported by NIH grants CA109232 and CA700580 to D.P.D., the UNC Lineberger Comprehensive Cancer Center, and the Leukemia and Lymphoma Society of America. C.E.P. is supported by NIH training grant CA009156.
REFERENCES
1.Ansari, M. Q., D. B. Dawson, R. Nador, C. Rutherford, N. R. Schneider, M. J. Latimer, L. Picker, D. M. Knowles, and R. W. McKenna.1996. Primary body cavity-based AIDS-related lymphomas. Am. J. Clin. Pathol.105:221– 229.
2.Arvanitakis, L., E. A. Mesri, R. G. Nador, J. W. Said, A. S. Asch, D. M. Knowles, and E. Cesarman.1996. Establishment and characterization of a primary effusion (body cavity-based) lymphoma cell line (BC-3) harboring Kaposi’s sarcoma-associated herpesvirus (KSHV/HHV-8) in the absence of Epstein-Barr virus. Blood88:2648–2654.
3.Banin, S., L. Moyal, S. Shieh, Y. Taya, C. W. Anderson, L. Chessa, N. I. Smorodinsky, C. Prives, Y. Reiss, Y. Shiloh, and Y. Ziv.1998. Enhanced phosphorylation of p53 by ATM in response to DNA damage. Science
281:1674–1677.
4.Barbera, A. J., J. V. Chodaparambil, B. Kelley-Clarke, V. Joukov, J. C. Walter, K. Luger, and K. M. Kaye.2006. The nucleosomal surface as a docking station for Kaposi’s sarcoma herpesvirus LANA. Science311:856– 861.
5.Boshoff, C., S. J. Gao, L. E. Healy, S. Matthews, A. J. Thomas, L. Coignet, R. A. Warnke, J. A. Strauchen, E. Matutes, O. W. Kamel, P. S. Moore, R. A. Weiss, and Y. Chang.1998. Establishing a KSHV⫹cell line (BCP-1) from peripheral blood and characterizing its growth in Nod/SCID mice. Blood
91:1671–1679.
6.Bramwell, V. H., D. Morris, D. S. Ernst, I. Hings, M. Blackstein, P. M. Venner, E. I. Ette, M. W. Harding, A. Waxman, and G. D. Demetri.2002. Safety and efficacy of the multidrug-resistance inhibitor biricodar (VX-710) with concurrent doxorubicin in patients with anthracycline-resistant ad-vanced soft tissue sarcoma. Clin. Cancer Res.8:383–393.
7.Brander, C., P. O’Connor, T. Suscovich, N. G. Jones, Y. Lee, D. Kedes, D. Ganem, J. Martin, D. Osmond, S. Southwood, A. Sette, B. D. Walker, and D. T. Scadden. 2001. Definition of an optimal cytotoxic T lymphocyte epitope in the latently expressed Kaposi’s sarcoma-associated herpesvirus kaposin protein. J. Infect. Dis.184:119–126.
8.Cai, X., S. Lu, Z. Zhang, C. M. Gonzalez, B. Damania, and B. R. Cullen.
2005. Kaposi’s sarcoma-associated herpesvirus expresses an array of viral microRNAs in latently infected cells. Proc. Natl. Acad. Sci. USA102:5570– 5575.
9.Canman, C. E., D. S. Lim, K. A. Cimprich, Y. Taya, K. Tamai, K. Sakaguchi, E. Appella, M. B. Kastan, and J. D. Siliciano.1998. Activation of the ATM kinase by ionizing radiation and phosphorylation of p53. Science281:1677– 1679.
10.Cannon, J. S., D. Ciufo, A. L. Hawkins, C. A. Griffin, M. J. Borowitz, G. S. Hayward, and R. F. Ambinder.2000. A new primary effusion lymphoma-derived cell line yields a highly infectious Kaposi’s sarcoma herpesvirus-containing supernatant. J. Virol.74:10187–10193.
11.Casey, G., Y. Yamanaka, H. Friess, M. S. Kobrin, M. E. Lopez, M. Buchler, H. G. Beger, and M. Korc.1993. p53 mutations are common in pancreatic cancer and are absent in chronic pancreatitis. Cancer Lett.69:151–160. 12.Cesarman, E., Y. Chang, P. S. Moore, J. W. Said, and D. M. Knowles.1995.
Kaposi’s sarcoma-associated herpesvirus-like DNA sequences in AIDS-re-lated body-cavity-based lymphomas. N. Engl. J. Med.332:1186–1191. 13.Cesarman, E., P. S. Moore, P. H. Rao, G. Inghirami, D. M. Knowles, and Y.
Chang.1995. In vitro establishment and characterization of two acquired immunodeficiency syndrome-related lymphoma cell lines (BC-1 and BC-2) containing Kaposi’s sarcoma-associated herpesvirus-like (KSHV) DNA se-quences. Blood86:2708–2714.
14.Chadburn, A., E. Hyjek, S. Mathew, E. Cesarman, J. Said, and D. M. Knowles.2004. KSHV-positive solid lymphomas represent an extra-cavitary variant of primary effusion lymphoma. Am. J. Surg. Pathol.28:1401–1416. 15.Chang, Y., E. Cesarman, M. S. Pessin, F. Lee, J. Culpepper, D. M. Knowles,
and P. S. Moore.1994. Identification of herpesvirus-like DNA sequences in AIDS-associated Kaposi’s sarcoma. Science266:1865–1869.
16.Coll-Mulet, L., D. Iglesias-Serret, A. F. Santidrian, A. M. Cosialls, M. de Frias, E. Castano, C. Campas, M. Barragan, A. Fernandez de Sevilla, A. Domingo, L. T. Vassilev, G. Pons, and J. Gil.2006. MDM2 antagonists activate p53 and synergize with genotoxic drugs in B-cell chronic lymphocytic leukemia cells. Blood107:4109–4114.
17.Crook, T., G. A. Parker, M. Rozycka, S. Crossland, and M. J. Allday.1998. A transforming p53 mutant, which binds DNA, transactivates and induces apoptosis reveals a nuclear:cytoplasmic shuttling defect. Oncogene16:1429– 1441.
18.Damania, B., J. H. Jeong, B. S. Bowser, S. M. DeWire, M. R. Staudt, and D. P. Dittmer.2004. Comparison of the Rta/Orf50 transactivator proteins of gamma-2-herpesviruses. J. Virol.78:5491–5499.
19.Dittmer, D., M. Lagunoff, R. Renne, K. Staskus, A. Haase, and D. Ganem.
1998. A cluster of latently expressed genes in Kaposi’s sarcoma-associated herpesvirus. J. Virol.72:8309–8315.
20.Dittmer, D., and E. S. Mocarski.1997. Human cytomegalovirus infection inhibits G1/S transition. J. Virol.71:1629–1634.
21.Dittmer, D. P.2003. Transcription profile of Kaposi’s sarcoma-associated herpesvirus in primary Kaposi’s sarcoma lesions as determined by real-time PCR arrays. Cancer Res.63:2010–2015.
22.Dittmer, D. P., C. M. Gonzalez, W. Vahrson, S. M. DeWire, R. Hines-Boykin, and B. Damania.2005. Whole-genome transcription profiling of rhesus mon-key rhadinovirus. J. Virol.79:8637–8650.
23.Dupin, N., C. Fisher, P. Kellam, S. Ariad, M. Tulliez, N. Franck, E. van Marck, D. Salmon, I. Gorin, J. P. Escande, R. A. Weiss, K. Alitalo, and C. Boshoff.1999. Distribution of human herpesvirus-8 latently infected cells in Kaposi’s sarcoma, multicentric Castleman’s disease, and primary effusion lymphoma. Proc. Natl. Acad. Sci. USA96:4546–4551.
24.el-Deiry, W. S., T. Tokino, V. E. Velculescu, D. B. Levy, R. Parsons, J. M. Trent, D. Lin, W. E. Mercer, K. W. Kinzler, and B. Vogelstein.1993. WAF1, a potential mediator of p53 tumor suppression. Cell75:817–825. 25.Elison, J. R., D. Cobrinik, N. Claros, D. H. Abramson, and T. C. Lee.2006.
Small molecule inhibition of HDM2 leads to p53-mediated cell death in retinoblastoma cells. Arch. Ophthalmol.124:1269–1275.
26.Fakhari, F. D., and D. P. Dittmer.2002. Charting latency transcripts in Kaposi’s sarcoma-associated herpesvirus by whole-genome real-time quan-titative PCR. J. Virol.76:6213–6223.
27.Friborg, J., Jr., W. Kong, M. O. Hottiger, and G. J. Nabel.1999. p53 inhibition by the LANA protein of KSHV protects against cell death. Nature
402:889–894.
28.Fridman, J. S., and S. W. Lowe.2003. Control of apoptosis by p53. Oncogene
22:9030–9040.
29.Ghosh, S. K., C. Wood, L. H. Boise, A. M. Mian, V. V. Deyev, G. Feuer, N. L. Toomey, N. C. Shank, L. Cabral, G. N. Barber, and W. J. Harrington, Jr.
2003. Potentiation of TRAIL-induced apoptosis in primary effusion lym-phoma through azidothymidine-mediated inhibition of NF-kappa B. Blood
101:2321–2327.
30.Godfrey, A., J. Anderson, A. Papanastasiou, Y. Takeuchi, and C. Boshoff.
2005. Inhibiting primary effusion lymphoma by lentiviral vectors encoding short hairpin RNA. Blood105:2510–2518.
31.Gwack, Y., S. Hwang, H. Byun, C. Lim, J. W. Kim, E. J. Choi, and J. Choe.
2001. Kaposi’s sarcoma-associated herpesvirus open reading frame 50 re-presses p53-induced transcriptional activity and apoptosis. J. Virol.75:6245– 6248.
32.Harris, S. L., and A. J. Levine.2005. The p53 pathway: positive and negative feedback loops. Oncogene24:2899–2908.
33.Issaeva, N., A. Friedler, P. Bozko, K. G. Wiman, A. R. Fersht, and G. Selivanova.2003. Rescue of mutants of the tumor suppressor p53 in cancer cells by a designed peptide. Proc. Natl. Acad. Sci. USA100:13303–13307. 34.Iwakuma, T., and G. Lozano.2003. MDM2, an introduction. Mol. Cancer
Res.1:993–1000.
35.Jenner, R. G., M. M. Alba, C. Boshoff, and P. Kellam. 2001. Kaposi’s sarcoma-associated herpesvirus latent and lytic gene expression as revealed by DNA arrays. J. Virol.75:891–902.
36.Jenner, R. G., K. Maillard, N. Cattini, R. A. Weiss, C. Boshoff, R. Wooster, and P. Kellam.2003. Kaposi’s sarcoma-associated herpesvirus-infected pri-mary effusion lymphoma has a plasma cell gene expression profile. Proc. Natl. Acad. Sci. USA100:10399–10404.
37.Jeong, J., J. Papin, and D. Dittmer.2001. Differential regulation of the overlapping Kaposi’s sarcoma-associated herpesvirus vGCR (orf74) and LANA (orf73) promoters. J. Virol.75:1798–1807.
38.Katano, H., Y. Sato, and T. Sata. 2001. Expression of p53 and human herpesvirus-8 (HHV-8)-encoded latency-associated nuclear antigen with in-hibition of apoptosis in HHV-8-associated malignancies. Cancer92:3076– 3084.
39.Kedes, D. H., M. Lagunoff, R. Renne, and D. Ganem.1997. Identification of the gene encoding the major latency-associated nuclear antigen of the Kaposi’s sarcoma-associated herpesvirus. J. Clin. Investig.100:2606–2610. 40.Klein, U., A. Gloghini, G. Gaidano, A. Chadburn, E. Cesarman, R.
Dalla-Favera, and A. Carbone.2003. Gene expression profile analysis of AIDS-related primary effusion lymphoma (PEL) suggests a plasmablastic deriva-tion and identifies PEL-specific transcripts. Blood101:4115–4121.
on November 8, 2019 by guest
http://jvi.asm.org/
41.Kojima, K., M. Konopleva, T. McQueen, S. O’Brien, W. Plunkett, and M. Andreeff.2006. Mdm2 inhibitor Nutlin-3a induces p53-mediated apoptosis by transcription-dependent and transcription-independent mechanisms and may overcome Mdm2 and Atm-mediated resistance to fludarabine in chronic lymphocytic leukemia. Blood108:993–1000.
42.Komanduri, K. V., J. A. Luce, M. S. McGrath, B. G. Herndier, and V. L. Ng.
1996. The natural history and molecular heterogeneity of HIV-associated primary malignant lymphomatous effusions. J. Acquir. Immune Defic. Syndr. Hum. Retrovir.13:215–226.
43.Komarov, P. G., E. A. Komarova, R. V. Kondratov, K. Christov-Tselkov, J. S. Coon, M. V. Chernov, and A. V. Gudkov.1999. A chemical inhibitor of p53 that protects mice from the side effects of cancer therapy. Science285:1733– 1737.
44.Kussie, P. H., S. Gorina, V. Marechal, B. Elenbaas, J. Moreau, A. J. Levine, and N. P. Pavletich.1996. Structure of the MDM2 oncoprotein bound to the p53 tumor suppressor transactivation domain. Science274:948–953. 45.Momand, J., G. P. Zambetti, D. C. Olson, D. George, and A. J. Levine.1992.
The mdm-2 oncogene product forms a complex with the p53 protein and inhibits p53-mediated transactivation. Cell69:1237–1245.
46.Nador, R. G., E. Cesarman, A. Chadburn, D. B. Dawson, M. Q. Ansari, J. Sald, and D. M. Knowles. 1996. Primary effusion lymphoma: a distinct clinicopathologic entity associated with the Kaposi’s sarcoma-associated her-pes virus. Blood88:645–656.
47.Papin, J., W. Vahrson, R. Hines-Boykin, and D. P. Dittmer.2004. Real-time quantitative PCR analysis of viral transcription. Methods Mol. Biol.292:449– 480.
48.Park, J., T. Seo, S. Hwang, D. Lee, Y. Gwack, and J. Choe.2000. The K-bZIP protein from Kaposi’s sarcoma-associated herpesvirus interacts with p53 and represses its transcriptional activity. J. Virol.74:11977–11982.
49.Parravicini, C., B. Chandran, M. Corbellino, E. Berti, M. Paulli, P. S. Moore, and Y. Chang.2000. Differential viral protein expression in Kaposi’s sarcoma-associated herpesvirus-infected diseases: Kaposi’s sarcoma, primary effusion lymphoma, and multicentric Castleman’s disease. Am. J. Pathol.
156:743–749.
50.Patton, J. T., L. D. Mayo, A. D. Singhi, A. V. Gudkov, G. R. Stark, and M. W. Jackson.2006. Levels of HdmX expression dictate the sensitivity of normal and transformed cells to Nutlin-3. Cancer Res.66:3169–3176.
51.Paulose-Murphy, M., N. K. Ha, C. Xiang, Y. Chen, L. Gillim, R. Yarchoan, P. Meltzer, M. Bittner, J. Trent, and S. Zeichner.2001. Transcription pro-gram of human herpesvirus 8 (Kaposi’s sarcoma-associated herpesvirus). J. Virol.75:4843–4853.
52.Petre-Draviam, C. E., E. B. Williams, C. J. Burd, A. Gladden, H. Moghadam, J. Meller, J. A. Diehl, and K. E. Knudsen.2005. A central domain of cyclin D1 mediates nuclear receptor corepressor activity. Oncogene24:431–444. 53.Pfeffer, S., A. Sewer, M. Lagos-Quintana, R. Sheridan, C. Sander, F. A.
Grasser, L. F. van Dyk, C. K. Ho, S. Shuman, M. Chien, J. J. Russo, J. Ju, G. Randall, B. D. Lindenbach, C. M. Rice, V. Simon, D. D. Ho, M. Zavolan, and T. Tuschl.2005. Identification of microRNAs of the herpesvirus family. Nat. Methods2:269–276.
54.Rainbow, L., G. Platt, G. Simpson, R. Sarid, S. Gao, H. Stoiber, C. Her-rington, P. Moore, and T. Schulz.1997. The 222- to 234-kilodalton latent nuclear protein (LNA) of Kaposi’s sarcoma-associated herpesvirus (human herpesvirus 8) is encoded by orf73 and is a component of the latency-associated nuclear antigen. J. Virol.71:5915–5921.
55.Rivas, C., A. E. Thlick, C. Parravicini, P. S. Moore, and Y. Chang.2001. Kaposi’s sarcoma-associated herpesvirus LANA2 is a B-cell-specific latent viral protein that inhibits p53. J. Virol.75:429–438.
56.Roth, J., P. Koch, A. Contente, and M. Dobbelstein.2000. Tumor-derived mutations within the DNA-binding domain of p53 that phenotypically re-semble the deletion of the proline-rich domain. Oncogene19:1834–1842. 57.Rozen, S., and H. Skaletsky.2000. Primer3 on the WWW for general users
and for biologist programmers. Methods Mol. Biol.132:365–386. 58.Samols, M. A., J. Hu, R. L. Skalsky, and R. Renne.2005. Cloning and
identification of a microRNA cluster within the latency-associated region of Kaposi’s sarcoma-associated herpesvirus. J. Virol.79:9301–9305. 59.Sarid, R., O. Flore, R. A. Bohenzky, Y. Chang, and P. S. Moore.1998.
Transcription mapping of the Kaposi’s sarcoma-associated herpesvirus (hu-man herpesvirus 8) genome in a body cavity-based lymphoma cell line (BC-1). J. Virol.72:1005–1012.
60.Secchiero, P., E. Barbarotto, M. Tiribelli, C. Zerbinati, M. G. di Iasio, A. Gonelli, F. Cavazzini, D. Campioni, R. Fanin, A. Cuneo, and G. Zauli.2006. Functional integrity of the p53-mediated apoptotic pathway induced by the non-genotoxic agent nutlin-3a in B-cell chronic lymphocytic leukemia (B-CLL). Blood107:4122–4129.
61.Seo, T., J. Park, D. Lee, S. G. Hwang, and J. Choe.2001. Viral interferon regulatory factor 1 of Kaposi’s sarcoma-associated herpesvirus binds to p53 and represses p53-dependent transcription and apoptosis. J. Virol.75:6193– 6198.
62.Shin, Y. C., H. Nakamura, X. Liang, P. Feng, H. Chang, T. F. Kowalik, and J. U. Jung.2006. Inhibition of the ATM/p53 signal transduction pathway by Kaposi’s sarcoma-associated herpesvirus interferon regulatory factor 1. J. Virol.80:2257–2266.
63.Si, H., S. C. Verma, and E. S. Robertson.2006. Proteomic analysis of the Kaposi’s sarcoma-associated herpesvirus terminal repeat element binding proteins. J. Virol.80:9017–9030.
64.Simonelli, C., M. Spina, R. Cinelli, R. Talamini, R. Tedeschi, A. Gloghini, E. Vaccher, A. Carbone, and U. Tirelli.2003. Clinical features and outcome of primary effusion lymphoma in HIV-infected patients: a single-institution study. J. Clin. Oncol.21:3948–3954.
65.Staudt, M. R., Y. Kanan, J. H. Jeong, J. F. Papin, R. Hines-Boykin, and D. P. Dittmer.2004. The tumor microenvironment controls primary effusion lym-phoma growth in vivo. Cancer Res.64:4790–4799.
66.Talbot, S. J., R. A. Weiss, P. Kellam, and C. Boshoff.1999. Transcriptional analysis of human herpesvirus-8 open reading frames 71, 72, 73, K14, and 74 in a primary effusion lymphoma cell line. Virology257:84–94.
67.Tovar, C., J. Rosinski, Z. Filipovic, B. Higgins, K. Kolinsky, H. Hilton, X. Zhao, B. T. Vu, W. Qing, K. Packman, O. Myklebost, D. C. Heimbrook, and L. T. Vassilev.2006. Small-molecule MDM2 antagonists reveal aberrant p53 signaling in cancer: implications for therapy. Proc. Natl. Acad. Sci. USA
103:1888–1893.
68.Vassilev, L. T., B. T. Vu, B. Graves, D. Carvajal, F. Podlaski, Z. Filipovic, N. Kong, U. Kammlott, C. Lukacs, C. Klein, N. Fotouhi, and E. A. Liu.2004. In vivo activation of the p53 pathway by small-molecule antagonists of MDM2. Science303:844–848.
69.Vogelstein, B., and K. W. Kinzler.2001. Achilles’ heel of cancer? Nature
412:865–866.
70.Wade, M., E. T. Wong, M. Tang, L. T. Vassilev, and G. M. Wahl.2006. Hdmx modulates the outcome of p53 activation in human tumor cells. J. Biol. Chem.281:33036–33044.
71.Wong, L. Y., G. A. Matchett, and A. C. Wilson.2004. Transcriptional acti-vation by the Kaposi’s sarcoma-associated herpesvirus latency-associated nuclear antigen is facilitated by an N-terminal chromatin-binding motif. J. Virol.78:10074–10085.
1922 PETRE ET AL. J. VIROL.