Growing Up in Scotland:
Changes in child cognitive ability in
the pre-school years
TECHNICAL APPENDIX
Contents
1
DESCRIPTION OF ANALYSIS UNDERTAKEN ... 3
1.1 Stage 1: Analysis of key social background factors associated with change in cognitive ability ... 3
1.2 Stage 2: Domain-based analysis of factors associated with change in cognitive ability ... 3
1.3 Stage 3: Combined domain analysis of factors associated with change in cognitive ability ... 4
1.4 Stage 4: Sub-group and interaction analysis ... 4
1.4.1 Description ... 4
1.4.2 Interpretation: knowledge of vocabulary ... 5
1.4.3 Interpretation: problem solving... 6
2
REGRESSION TABLES ... 8
1 DESCRIPTION OF ANALYSIS UNDERTAKEN
Many of the factors we are interested in are related to each other as well as being related to cognitive ability. For example, younger mothers are more likely to have lower qualifications, to be lone parents, and to live in areas of high deprivation. Simple analysis may identify a relationship between maternal age and cognitive ability. However, this relationship may be occuring because of the underlying association between maternal age and education. Thus, it is actually the lower education levels amongst younger mothers which is associated with a greater likelihood of lower cognitive ability in their children rather than the fact that they are younger in age. To avoid this difficulty, multivariate regression analysis was used. This analysis allows the examination of the relationships between an outcome variable and multiple explanatory variables whilst controlling for the inter-relationships between each of the explanatory variables. This means it is possible to identify an independent relationship between any single explanatory variable and the outcome variable; to show, for example, that there is a relationship between maternal age and cognitive ability that does not simply occur because both education and maternal age are related.
The regression models developed for this report were fitted with standardised ability score at age 5 as the outcome variable. The equivalent measure at age 3 was included as an
explanatory variable. Measures of parental education and the additional factors identified from the literature were also added as explanatory variables. By including a measure of ability at age 3, the results of this analysis identify characteristics which are associated with a change in assessment score between ages 3 and 5, after controlling for parental level of education and other, potentially confounding, characteristics.
1.1 Stage 1: Analysis of key social background factors associated with
change in cognitive ability
Tables 1 and 2
Household equivalised income, parental level of education and socio-economic classification were included as explanatory variables in a single regression model alongside standardised ability score at age 3.
1.2 Stage 2: Domain-based analysis of factors associated with change in
cognitive ability
Tables 3 to 18
The measures identified were added as explanatory variables to a linear regression model alongside standardised ability score at age 2 and parental level of education, with score at age 4 as the dependent (outcome) variable. Separate models were run for vocabulary and problem solving and for each domain. Those variables found to be significant in the
The effect of factors in each domain was explored using multivariate analysis. The results of this analysis allow us to determine which characteristics, circumstances and experiences of children’s lives were independently associated with a relative improvement or decline in cognitive ability in the pre-school period after controlling for level of parental education. In addition, by looking at whether and how these factors affect the relationship between parental level of education and cognitive ability at age 4 (by considering any change in the strength of the regression co-efficient), and considering how much of the difference in ability the combination of characteristics help explain when added to the model, it is possible to measure whether variations in the additional factors are behind some of the education-related differences. That is, for example, to demonstrate whether some of the difference in ability by parents’ education actually occurs as a result of differences in parenting practices amongst parents with different levels of education.
1.3 Stage 3: Combined domain analysis of factors associated with change in
cognitive ability
Tables 19 and 20
The next stage of analysis involved entering the significant domain factors together into a single regression model for each ability alongside parental level of education. In so doing, this analysis explores the extent to which each factor remains independently associated with change in ability and an examination of the combined effect of all factors on the relationship between education and change in ability.
1.4 Stage 4: Sub-group and interaction analysis
Sub-group analysis: tables 21 to 24 Interaction analysis: tables 25 and 26
1.4.1 Description
For the group analysis, the final combined domain models were run first, on a sub-sample of degree-educated parents, and then on a sub-sub-sample of parents who had no qualifications, lower-level Standard Grades (or equivalent) or upper-level Standard Grades (or equivalent).
For each interaction, three models were run. One including an interaction between the explanatory variable and degree-level qualification, one including an interaction between the explanatory variable and no or lower-level qualifications, and one included both the degree-level and no or lower-degree-level qualification variables. This permitted an exploration of the impact of different education reference groups. In the first, the reference group is all those who do not have a degree; in the second all those with qualifications at Higher grade level or above; in the third all those with Higher grades (or equivalent).
1.4.2 Interpretation: knowledge of vocabulary
So far as change in vocabulary ability is concerned, maternal age shows some difference in impact across different educational groups. In the main model, maternal age was not statistically significant, although the relationship between having a mother aged under 25 and change in ability was negative. However, the interaction results suggest that there appeared to be some positive effect of being a younger mother in the lower educational group. This is likely to reflect the temporal nature of the qualification data in that younger mothers are, by the very fact that they are younger, considerably less likely to have had the chance to obtain qualifications at further and higher education levels. Thus lack of
educational qualifications amongst younger mothers may be of less significance than a lack of qualifications amongst older mothers..
The relationship between infant-maternal attachment and change in vocabulary ability also shows some variation by level of parental education. The results from the main regression model suggested that children who experience better attachment are more likely to show a relative improvement in their vocabulary in the pre-school period. In this instance, the interaction indicates that attachment has a significant positive effect on the vocabulary development, in particular, of children whose parents have lower qualifications. The effect is not significant for children whose parents are degree-educated. This implies that the
negative effect on cognitive development associated with a lack of parental qualifications can be mediated by improving early infant-maternal attachment. The benefits of good attachment on cognitive development compensate for and protect against, in some part, the parents’ lower education level.
A revised interaction was included between education and communicative development at 22 months using an adjusted lower qualifications group restricted to only those with no qualifications or lower level Standard Grades1. This adjusted interaction was statistically significant and positive. This suggests that the significant positive relationship between early communication skills and relative improvement in vocabulary between ages 2 and 4, seen in the main model, was more pronounced for children whose parents had no or lower
qualifications. Thus better early communication ability is more predictive of later relative improvement in language skills for children from worse educational backgrounds. This finding has a number of implications. First, it suggests that the children from worse
educational backgrounds whose relative vocabulary ability improves in the pre-school period are those who were already demonstrating more advanced communication skills at an earlier age. Secondly, it implies that for children whose parents have no or lower
qualifications, poor early communication skills will likely persist through the pre-school period with little or no relative improvement. Third, and in contrast, there is a suggestion that in those families where parents have higher qualifications, a child’s lack of advanced early communication skillls does not necessarily prohibit later improvement in vocabulary in the same way it does for children whose parents have no or lower qualifications.
Put simply children from better educated backgrounds who underperform in early
intervention to maximise the successful communicative development of children in this group in the first two years of their lives will benefit their language development in later years. Leaving the remediation of language ability until the pre-school period would appear to be too late for those children from worse educational backgrounds.
None of the interactions between education and ante-natal class attendance were significant suggesting the positive effect of attending ante-natal classes on ability development between 3 and 5 is similar irrespective of parental education. Thus ante-natal classes appear to have a ‘universal’ effect. However, it is not possible to say whether it is attendance at the classes in itself which is driving the difference. The cross-sectional analysis detailed in section 3 of the main report illustrated the stark variation in ante-natal class attendance by parental level of education. Whilst our analysis has demonstrated the effect of class attendance is
independent of parental education, it is feasible, and perhaps likely, that attendance at ante-natal classes is instead measuring characteristics, attitudes and experiences associated with a desire to be a good parent which are also beneficial to the improvement of vocabulary ability in the pre-school period.
The interaction between breastfeeding and degree-level education is shown to be significant and positive. This suggests that the relationship between breastfeeding and the continuing development of vocabulary ability in the pre-school period is primarily for better educated parents. Thus whilst breastfeeding is known, from existing GUS research and research elsewhere (Iacovou and Sevilla-Sanz, 2010), to be associated with higher cognitive ability, encouraging mothers from lower educational backgrounds to breastfeed does not appear to offer a means of reducing the gap in vocabulary ability specifically during the pre-school period. Again, as with ante-natal classes, we do not have sufficient information to determine whether it is the experience of breastfeeding itself which leads to improvement in vocabulary ability in the pre-school period or some other characteristics of mothers most likely to
breastfeed not included in the model, but represented by the act of breastfeeding. What is clear is that breastfeeding, or the parenting behaviour it is measuring, has an effect
independent to that of education.
1.4.3 Interpretation: problem solving
In respect of change in problem solving ability, the interaction between the frequency of home learning activities and lower qualifications was significant and positive. It appears, therefore, that a good home learning environment – as measured by the frequency of parent-child activities such as reading, drawing, and singing nursery rhymes etc – at the ages of 2 and 3 has more benefit in respect of the relative improvement of problem solving ability for children whose parents have lower qualifications. Children from lower education households who experience a higher frequency of such activities are more likely to improve their relative problem solving skills in the pre-school period than children who have a lesser experience of this. Bromley (2009) reported a relationship between a higher frequency of child activities and higher cognitive ability at age 3, after controlling for parental education. What the positive interaction in
further suggests is that although children from lower educated backgrounds may have lower than average problem solving skills to start with (at age 3), those who experience a higher frequency of parent-child activities see that ability continue to improve during the pre-school period in the face of an overarching trend for children in this sub-group of ability
deteriorating, relative to their peers, during this time.
pre-school and degree education of the parents was significant and the co-efficient was positive, this suggests that for children with degree-educated parents missing pre-school is not necessarily detrimental to their problem solving ability. Given the very small size of the group of children who did not attend a pre-school place, it is not possible to draw any strong conclusions from these findings.
None of the remaining interactions included in the problem solving analysis – attending a private pre-school, starting primary school, being breastfed and living in an area in the most deprived quintile – were significant. This indicates that the relationship between these factors and change in problem solving ability does not vary according to parental level of education. Whilst it may be taken as encouraging that private pre-school attendance and early primary school experience appear to lead to a general improvement in problem solving ability, these factors do not appear to offer a policy solution for narrowing the cognitive gap and improving, in particular, the ability of those children whose parents have lower
2 REGRESSION
TABLES
2.1 Interpreting linear regression coefficients
In each output table included below, four items are included: unstandardised coefficient, standardised coefficient, the p-value (significance value) and the 95% confidence intervals for the unstandardised coefficients.
The unstandardised coefficients tell us by how much the value of the outcome or ‘Y’ variable (standardised cognitive ability at age 5) increases (when the coefficient is positive) or
decreases (when the coefficient is negative) when the value of the independent or ‘X’
variable increase by 1 unit and the value of all other independent variables (IVs) in the model are held constant. Since the independent variables all have different scales, we cannot compare the relative importance (or strength) of the unstandardised coefficients.
List of Tables
Table 1 Naming vocabulary social background multiple linear regression – full results Table 2 Problem solving social background multiple linear regression – full results Table 3 Naming vocabulary demographic domain multiple linear regression – full results Table 4 Picture similarities demographic domain multiple linear regression – full results Table 5 Naming vocabulary family composition domain multiple linear regression – full
results
Table 6 Picture similarities family composition domain multiple linear regression – full results
Table 7 Naming vocabulary parenting domain multiple linear regression – full results Table 8 Picture similarities parenting domain multiple linear regression – full results Table 9 Naming vocabulary childcare and pre-school domain multiple linear regression
– full results
Table 10 Picture similarities childcare and pre-school domain multiple linear regression – full results
Table 11 Naming vocabulary child health and development domain multiple linear regression – full results
Table 12 Picture similarities child health and development domain multiple linear regression – full results
Table 13 Naming vocabulary parenting support domain multiple linear regression – full results
Table 14 Picture similarities parenting support domain multiple linear regression – full results
Table 15 Naming vocabulary maternal health and health behaviours domain multiple linear regression – full results
Table 16 Picture similarities maternal health and health behaviours domain multiple linear regression – full results
Table 17 Naming vocabulary economic and material circumstances domain multiple linear regression – full results
Table 18 Picture similarities economic and material circumstances domain multiple linear regression – full results
Table 19 Naming vocabulary combined domain multiple linear regression – full results Table 20 Picture similarities combined domain multiple linear regression – full results Table 21 Naming vocabulary combined domain multiple linear regression on degree-level
educated sub-sample – full results
Table 22 Picture similarities combined domain multiple linear regression on degree-level educated sub-sample – full results
Table 23 Naming vocabulary combined domain multiple linear regression on lower educated sub-sample – full results
Table 24 Picture similarities combined domain multiple linear regression on lower educated sub-sample – full results
Table 1 Naming vocabulary social background multiple linear regression – full results
Demographic characteristic
Unstandardised co-efficient
Standardised
co-efficient P-value 95% confidence interval
Standardised ability score at age 2 0.487 0.490 0.018 0.450 0.523
Household equivalised income (ref: lowest
income quintile)
2nd Quintile (>=£11,875<£19,444) 0.087 0.086 0.085 -0.012 0.186 3rd Quintile (>=£19,444< £25,625) 0.109 0.109 0.050 0.000 0.219 4th Quintile (>=£25,625< £37,500) 0.153 0.153 0.007 0.043 0.264 Top Quintile (>=£37,500) 0.144 0.144 0.019 0.024 0.264
Parental level of education (ref: no qualifications)
Lower SGs or VQs or 'Other' quals 0.032 0.032 0.820 -0.248 0.312 Upper level SGs or Intmed VQs 0.224 0.223 0.009 0.058 0.389 Higher Grades or Upper level VQs 0.228 0.227 0.017 0.043 0.414 Degree level academic or VQs 0.336 0.336 0.000 0.164 0.508
Household socio-economic classification (ref:
routine/semi-routine)
Lower supervisory -0.083 -0.083 0.271 -0.233 0.066 Small Emps and Own Account -0.014 -0.014 0.872 -0.183 0.156
Intermediate 0.043 0.043 0.453 -0.071 0.158
Managerial/professional 0.048 0.048 0.404 -0.067 0.163
Rsquared 0.30
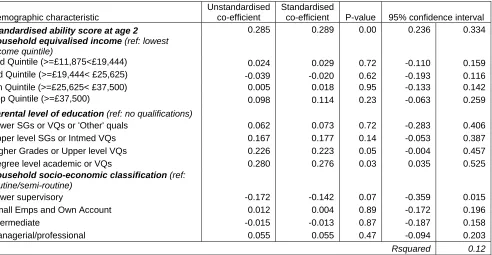
Table 2 Problem solving social background multiple linear regression – full results
Demographic characteristic
Unstandardised co-efficient
Standardised
co-efficient P-value 95% confidence interval
Standardised ability score at age 2 0.285 0.289 0.00 0.236 0.334
Household equivalised income (ref: lowest
income quintile)
2nd Quintile (>=£11,875<£19,444) 0.024 0.029 0.72 -0.110 0.159 3rd Quintile (>=£19,444< £25,625) -0.039 -0.020 0.62 -0.193 0.116 4th Quintile (>=£25,625< £37,500) 0.005 0.018 0.95 -0.133 0.142 Top Quintile (>=£37,500) 0.098 0.114 0.23 -0.063 0.259
Parental level of education (ref: no qualifications)
Lower SGs or VQs or 'Other' quals 0.062 0.073 0.72 -0.283 0.406 Upper level SGs or Intmed VQs 0.167 0.177 0.14 -0.053 0.387 Higher Grades or Upper level VQs 0.226 0.223 0.05 -0.004 0.457 Degree level academic or VQs 0.280 0.276 0.03 0.035 0.525
Household socio-economic classification (ref:
routine/semi-routine)
Lower supervisory -0.172 -0.142 0.07 -0.359 0.015 Small Emps and Own Account 0.012 0.004 0.89 -0.172 0.196
Intermediate -0.015 -0.013 0.87 -0.187 0.158
Managerial/professional 0.055 0.055 0.47 -0.094 0.203
[image:10.595.60.552.418.673.2]Table 3 Naming vocabulary demographic domain multiple linear regression – full results
Unstandardised co-efficient
Standardised
co-efficient P-value 95% confidence interval
Standardised ability score at age 2 0.495 0.498 0.00 0.460 0.529
Child’s gender (ref: male)
Female -0.031 -0.015 0.40 -0.102 0.041
Parental ethnicity (ref: both parents white)
At least one parent non-white -0.245 -0.050 0.01 -0.430 -0.060
Maternal age at child’s birth (ref: 25 or older)
25 or older -0.094 -0.040 0.03 -0.178 -0.010
Parental level of education (ref: no qualifications)
Lower SGs or VQs or 'Other' quals 0.112 0.112 0.40 -0.153 0.378 Upper level SGs or Intmed VQs 0.341 0.340 0.00 0.192 0.491 Higher Grades or Upper level VQs 0.364 0.363 0.00 0.192 0.537 Degree level academic or VQs 0.502 0.501 0.00 0.331 0.673
Rsquared 0.31
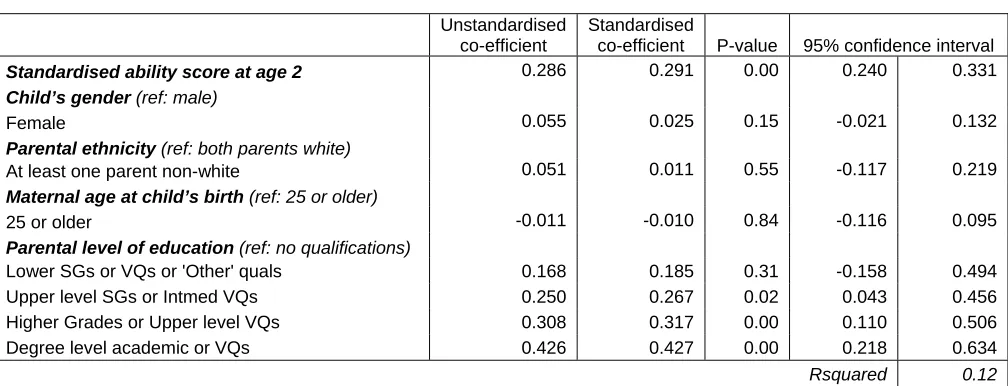
Table 4 Picture similarities demographic domain multiple linear regression – full results
Unstandardised co-efficient
Standardised
co-efficient P-value 95% confidence interval
Standardised ability score at age 2 0.286 0.291 0.00 0.240 0.331
Child’s gender (ref: male)
Female 0.055 0.025 0.15 -0.021 0.132
Parental ethnicity (ref: both parents white)
At least one parent non-white 0.051 0.011 0.55 -0.117 0.219
Maternal age at child’s birth (ref: 25 or older)
25 or older -0.011 -0.010 0.84 -0.116 0.095
Parental level of education (ref: no qualifications)
Lower SGs or VQs or 'Other' quals 0.168 0.185 0.31 -0.158 0.494 Upper level SGs or Intmed VQs 0.250 0.267 0.02 0.043 0.456 Higher Grades or Upper level VQs 0.308 0.317 0.00 0.110 0.506 Degree level academic or VQs 0.426 0.427 0.00 0.218 0.634
[image:11.595.47.551.378.571.2]Table 5 Naming vocabulary family composition domain multiple linear regression – full results
Unstandardised co-efficient
Standardised
co-efficient P-value 95% confidence interval
Standardised ability score at age 2 0.498 0.502 0.000 0.462 0.533
Family type transitions (ref: stable couple)
Couple who separated -0.025 -0.025 0.631 -0.127 0.078 Stable lone parent -0.046 -0.046 0.420 -0.158 0.067 Lone parent who re-partnered 0.075 0.075 0.102 -0.015 0.165
Number of children in household (ref: one)
Two 0.064 0.064 0.249 -0.046 0.174
Three or more 0.046 0.046 0.681 -0.178 0.271
Cohort child’s birth order (ref: not first born)
First born in household 0.118 0.059 0.241 -0.081 0.316
Parental level of education (ref: no qualifications)
Lower SGs or VQs or 'Other' quals 0.081 0.081 0.555 -0.191 0.353 Upper level SGs or Intmed VQs 0.322 0.321 0.000 0.166 0.477 Higher Grades or Upper level VQs 0.351 0.350 0.000 0.172 0.529 Degree level academic or VQs 0.486 0.485 0.000 0.305 0.667
Rsquared 0.32
Table 6 Picture similarities family composition domain multiple linear regression – full results
Unstandardised co-efficient
Standardised
co-efficient P-value 95% confidence interval
Standardised ability score at age 2 0.287 0.293 0.000 0.244 0.33
Family type transitions (ref: stable couple)
Couple who separated -0.028 -0.028 0.639 -0.146 0.09 Stable lone parent -0.051 -0.050 0.370 -0.162 0.06 Lone parent who re-partnered 0.048 0.048 0.476 -0.086 0.18
Number of children in household (ref: one)
Two 0.093 0.093 0.119 -0.024 0.21
Three or more 0.095 0.094 0.406 -0.131 0.32
Cohort child’s birth order (ref: not first born)
First born in household 0.072 0.036 0.520 -0.150 0.29
Parental level of education (ref: no qualifications)
Lower SGs or VQs or 'Other' quals 0.138 0.138 0.387 -0.178 0.45 Upper level SGs or Intmed VQs 0.225 0.225 0.037 0.014 0.44 Higher Grades or Upper level VQs 0.284 0.283 0.008 0.076 0.49 Degree level academic or VQs 0.392 0.392 0.001 0.170 0.61
[image:12.595.50.550.420.641.2]Table 7 Naming vocabulary parenting domain multiple linear regression – full results
Unstandardised co-efficient
Standardised
co-efficient P-value 95% confidence interval
Standardised ability score at age 2 0.467 0.462 0.000 0.427 0.506
Mean score on home learning activities scale
0.007 0.078 0.000 0.004 0.011
Banded level of rules in household (ref: low
rules)
Medium 0.060 0.066 0.109 -0.014 0.134
High 0.136 0.150 0.016 0.026 0.245
Harsh discipline (ref: never smacked)
Used smacking before age 4 0.056 0.022 0.113 -0.013 0.124
Infant-maternal attachment score
0.141 0.074 0.000 0.073 0.208
Parental problems with reading/writing (ref:
does not have any problems)
Does have some problems -0.060 -0.015 0.277 -0.170 0.050
Parental level of education (ref: no qualifications)
Lower SGs or VQs or 'Other' quals 0.026 -0.028 0.863 -0.271 0.322 Upper level SGs or Intmed VQs 0.270 0.192 0.004 0.087 0.453 Higher Grades or Upper level VQs 0.264 0.202 0.011 0.062 0.467 Degree level academic or VQs 0.406 0.348 0.000 0.206 0.606
Rsquared 0.31
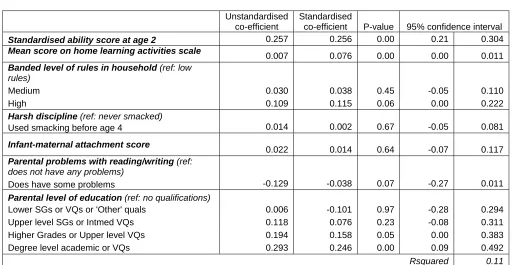
Table 8 Picture similarities parenting domain multiple linear regression – full results
Unstandardised co-efficient
Standardised
co-efficient P-value 95% confidence interval
Standardised ability score at age 2 0.257 0.256 0.00 0.21 0.304
Mean score on home learning activities scale
0.007 0.076 0.00 0.00 0.011
Banded level of rules in household (ref: low
rules)
Medium 0.030 0.038 0.45 -0.05 0.110
High 0.109 0.115 0.06 0.00 0.222
Harsh discipline (ref: never smacked)
Used smacking before age 4 0.014 0.002 0.67 -0.05 0.081
Infant-maternal attachment score
0.022 0.014 0.64 -0.07 0.117
Parental problems with reading/writing (ref:
does not have any problems)
Does have some problems -0.129 -0.038 0.07 -0.27 0.011
Parental level of education (ref: no qualifications)
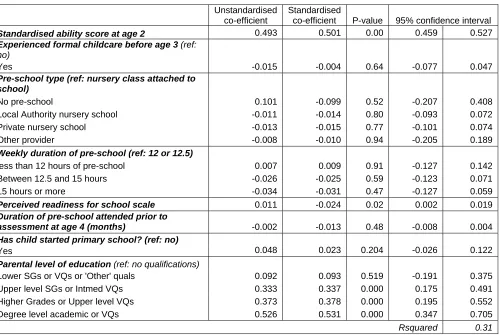
[image:13.595.42.554.444.709.2]Table 9 Naming vocabulary childcare and pre-school domain multiple linear regression – full results
Unstandardised co-efficient
Standardised
co-efficient P-value 95% confidence interval
Standardised ability score at age 2 0.493 0.501 0.00 0.459 0.527
Experienced formal childcare before age 3 (ref:
no)
Yes -0.015 -0.004 0.64 -0.077 0.047
Pre-school type (ref: nursery class attached to school)
No pre-school 0.101 -0.099 0.52 -0.207 0.408
Local Authority nursery school -0.011 -0.014 0.80 -0.093 0.072 Private nursery school -0.013 -0.015 0.77 -0.101 0.074
Other provider -0.008 -0.010 0.94 -0.205 0.189
Weekly duration of pre-school (ref: 12 or 12.5)
less than 12 hours of pre-school 0.007 0.009 0.91 -0.127 0.142 Between 12.5 and 15 hours -0.026 -0.025 0.59 -0.123 0.071 15 hours or more -0.034 -0.031 0.47 -0.127 0.059
Perceived readiness for school scale 0.011 -0.024 0.02 0.002 0.019
Duration of pre-school attended prior to
assessment at age 4 (months) -0.002 -0.013 0.48 -0.008 0.004
Has child started primary school? (ref: no)
Yes 0.048 0.023 0.204 -0.026 0.122
Parental level of education (ref: no qualifications)
Lower SGs or VQs or 'Other' quals 0.092 0.093 0.519 -0.191 0.375 Upper level SGs or Intmed VQs 0.333 0.337 0.000 0.175 0.491 Higher Grades or Upper level VQs 0.373 0.378 0.000 0.195 0.552 Degree level academic or VQs 0.526 0.531 0.000 0.347 0.705
Table 10 Picture similarities childcare and pre-school domain multiple linear regression – full results
Unstandardised co-efficient
Standardised
co-efficient P-value 95% confidence interval
Standardised ability score at age 2 0.279 0.286 0.000 0.23 0.324
Experienced formal childcare before age 3 (ref:
no)
Yes 0.028 0.016 0.512 -0.06 0.115
Pre-school type (ref: nursery class attached to school)
No pre-school -0.060 -0.211 0.750 -0.43 0.314
Local Authority nursery school 0.000 -0.003 0.994 -0.12 0.119 Private nursery school 0.210 0.208 0.000 0.11 0.313
Other provider 0.150 0.147 0.148 -0.05 0.354
Weekly duration of pre-school (ref: 12 or 12.5)
less than 12 hours of pre-school -0.149 -0.148 0.068 -0.31 0.011 Between 12.5 and 15 hours -0.060 -0.058 0.425 -0.21 0.090
15 hours or more -0.086 -0.085 0.154 -0.21 0.033
Perceived readiness for school scale 0.009 -0.027 0.071 0.00 0.019
Duration of pre-school attended prior to
assessment at age 4 (months) 0.007 0.032 0.141 0.00 0.017
Has child started primary school? (ref: no)
Yes 0.096 0.045 0.019 0.02 0.177
Parental level of education (ref: no qualifications)
Lower SGs or VQs or 'Other' quals 0.166 0.166 0.308 -0.16 0.488 Upper level SGs or Intmed VQs 0.234 0.238 0.029 0.03 0.443 Higher Grades or Upper level VQs 0.276 0.280 0.008 0.07 0.478 Degree level academic or VQs 0.388 0.392 0.001 0.17 0.605
Table 11 Naming vocabulary child health and development domain multiple linear regression – full results
Unstandardised co-efficient
Standardised
co-efficient P-value 95% confidence interval
Standardised ability score at age 2 0.458 0.462 0.000 0.418 0.498 General health from birth to age 3 (ref: always
good or very good)
Temporarily or always fair, bad or very bad -0.072 -0.024 0.140 -0.169 0.024
Birth weight (ref: not low)
Low 0.080 0.019 0.286 -0.068 0.228
Total score on CSBS Infant/Toddler checklist 0.012 0.060 0.001 0.005 0.019 Level of physical activity 0.000 0.000 1.000 -0.004 0.004 Parental level of education (ref: no qualifications)
Lower SGs or VQs or 'Other' quals 0.002 0.002 0.991 -0.275 0.278
Upper level SGs or Intmed VQs 0.213 0.213 0.005 0.067 0.360
Higher Grades or Upper level VQs 0.231 0.230 0.009 0.061 0.401
Degree level academic or VQs 0.397 0.396 0.000 0.232 0.563
Rsquared 0.28
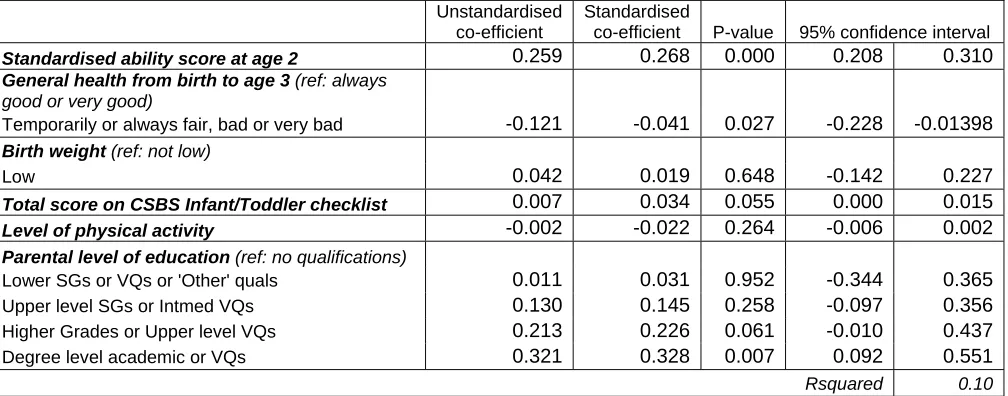
Table 12 Picture similarities child health and development domain multiple linear regression – full results
Unstandardised co-efficient
Standardised
co-efficient P-value 95% confidence interval
Standardised ability score at age 2 0.259 0.268 0.000 0.208 0.310 General health from birth to age 3 (ref: always
good or very good)
Temporarily or always fair, bad or very bad -0.121 -0.041 0.027 -0.228 -0.01398
Birth weight (ref: not low)
Low 0.042 0.019 0.648 -0.142 0.227
Total score on CSBS Infant/Toddler checklist 0.007 0.034 0.055 0.000 0.015 Level of physical activity -0.002 -0.022 0.264 -0.006 0.002 Parental level of education (ref: no qualifications)
Lower SGs or VQs or 'Other' quals 0.011 0.031 0.952 -0.344 0.365
Upper level SGs or Intmed VQs 0.130 0.145 0.258 -0.097 0.356
Higher Grades or Upper level VQs 0.213 0.226 0.061 -0.010 0.437
Degree level academic or VQs 0.321 0.328 0.007 0.092 0.551
[image:16.595.49.553.396.594.2]Table 13 Naming vocabulary parenting support domain multiple linear regression – full results
Unstandardised co-efficient
Standardised
co-efficient P-value 95% confidence interval
Standardised ability score at age 2 0.490 0.494 0.000 0.453 0.527 Level of service use at 10 months 0.021 0.039 0.058 -0.001 0.043 Existence of social networks (ref: has both
satisfactory family and friendship networks)
Only has satisfactory friendship network 0.071 0.071 0.125 -0.020 0.162
Only has satisfactory family network 0.011 0.011 0.773 -0.063 0.084 Has neither satisfactory social network -0.091 -0.091 0.193 -0.230 0.047
Attended any parenting classes from birth to age 3 (ref: no)
Yes -0.084 -0.083 0.087 -0.180 0.012
Attendance at ante-natal classes (ref: did not
attend)
Went to some classes -0.012 -0.012 0.847 -0.135 0.111
Went to all classes 0.113 0.113 0.001 0.045 0.181
Parental level of education (ref: no qualifications)
Lower SGs or VQs or 'Other' quals 0.071 0.071 0.600 -0.198 0.341
Upper level SGs or Intmed VQs 0.288 0.288 0.000 0.138 0.439
Higher Grades or Upper level VQs 0.303 0.302 0.001 0.126 0.479
Degree level academic or VQs 0.426 0.425 0.000 0.253 0.599
Rsquared 0.31
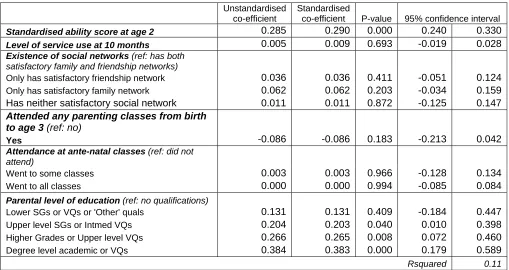
Table 14 Picture similarities parenting support domain multiple linear regression – full results
Unstandardised co-efficient
Standardised
co-efficient P-value 95% confidence interval
Standardised ability score at age 2 0.285 0.290 0.000 0.240 0.330 Level of service use at 10 months 0.005 0.009 0.693 -0.019 0.028 Existence of social networks (ref: has both
satisfactory family and friendship networks)
Only has satisfactory friendship network 0.036 0.036 0.411 -0.051 0.124
Only has satisfactory family network 0.062 0.062 0.203 -0.034 0.159 Has neither satisfactory social network 0.011 0.011 0.872 -0.125 0.147
Attended any parenting classes from birth to age 3 (ref: no)
Yes -0.086 -0.086 0.183 -0.213 0.042
Attendance at ante-natal classes (ref: did not
attend)
Went to some classes 0.003 0.003 0.966 -0.128 0.134
Went to all classes 0.000 0.000 0.994 -0.085 0.084
Parental level of education (ref: no qualifications)
Lower SGs or VQs or 'Other' quals 0.131 0.131 0.409 -0.184 0.447
Upper level SGs or Intmed VQs 0.204 0.203 0.040 0.010 0.398
Higher Grades or Upper level VQs 0.266 0.265 0.008 0.072 0.460
Degree level academic or VQs 0.384 0.383 0.000 0.179 0.589
[image:17.595.44.553.423.693.2]Table 15 Naming vocabulary maternal health and health behaviours domain multiple linear regression – full results
Unstandardised co-efficient
Standardised
co-efficient P-value 95% confidence interval
Standardised ability score at age 2 0.496 0.500 0.000 0.459 0.532
Ever smoked since child’s birth (ref: no) -0.041 -0.019 0.284 -0.116 0.035
Was child ever breastfed?(ref: no)
Yes 0.102 0.050 0.008 0.028 0.177
Poor mental health since child’s birth (ref: no)
Yes -0.107 -0.045 0.013 -0.191 -0.023
Less than good health since child’s birth
(ref: no)
Yes 0.015 0.006 0.716 -0.068 0.098
Parental level of education (ref: no qualifications)
Lower SGs or VQs or 'Other' quals 0.069 0.069 0.623 -0.210 0.348
Upper level SGs or Intmed VQs 0.311 0.310 0.000 0.149 0.473
Higher Grades or Upper level VQs 0.312 0.311 0.002 0.124 0.500
Degree level academic or VQs 0.429 0.428 0.000 0.241 0.616
Rsquared 0.30
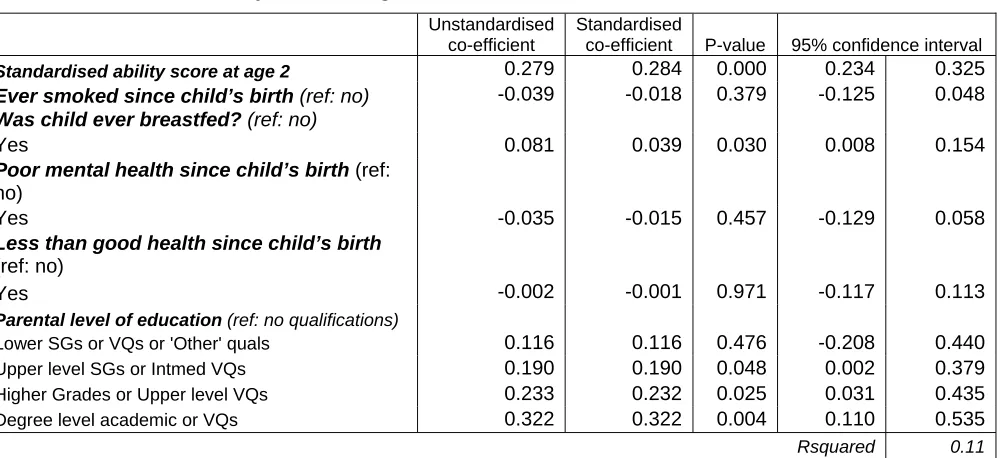
Table 16 Picture similarities maternal health and health behaviours domain multiple linear regression – full results
Unstandardised co-efficient
Standardised
co-efficient P-value 95% confidence interval
Standardised ability score at age 2 0.279 0.284 0.000 0.234 0.325
Ever smoked since child’s birth (ref: no) -0.039 -0.018 0.379 -0.125 0.048
Was child ever breastfed?(ref: no)
Yes 0.081 0.039 0.030 0.008 0.154
Poor mental health since child’s birth (ref: no)
Yes -0.035 -0.015 0.457 -0.129 0.058
Less than good health since child’s birth
(ref: no)
Yes -0.002 -0.001 0.971 -0.117 0.113
Parental level of education (ref: no qualifications)
Lower SGs or VQs or 'Other' quals 0.116 0.116 0.476 -0.208 0.440
Upper level SGs or Intmed VQs 0.190 0.190 0.048 0.002 0.379
Higher Grades or Upper level VQs 0.233 0.232 0.025 0.031 0.435
Degree level academic or VQs 0.322 0.322 0.004 0.110 0.535
[image:18.595.53.553.401.630.2]Table 17 Naming vocabulary economic and material circumstances domain multiple linear regression – full results
Unstandardised co-efficient
Standardised
co-efficient P-value 95% confidence interval
Standardised ability score at age 2 0.489 0.492 0.000 0.445 0.532 Housing tenure (ref: owner occupied)
Social rented -0.070 -0.071 0.215 -0.182 0.042
Private rented -0.108 -0.110 0.282 -0.308 0.091
Other 0.061 0.061 0.533 -0.133 0.254
Score on material deprivation index -0.003 -0.038 0.042 -0.006 0.000
Maternal employment between birth and age 3
(ref: not employed)
Employed 0.024 0.010 0.466 -0.041 0.089
Area deprivation (ref: least deprived)
2 0.064 0.064 0.224 -0.040 0.167
3 -0.049 -0.049 0.302 -0.143 0.045
4 0.023 0.023 0.709 -0.098 0.143
5 Most deprived -0.039 -0.039 0.477 -0.147 0.069
Difficulty coping on income between birth and age 3 (ref: no)
Yes -0.015 -0.007 0.717 -0.100 0.069
Parental level of education (ref: no qualifications)
Lower SGs or VQs or 'Other' quals -0.051 -0.052 0.712 -0.325 0.223
Upper level SGs or Intmed VQs 0.227 0.229 0.005 0.069 0.384
Higher Grades or Upper level VQs 0.193 0.195 0.034 0.016 0.370
Degree level academic or VQs 0.327 0.331 0.000 0.154 0.499
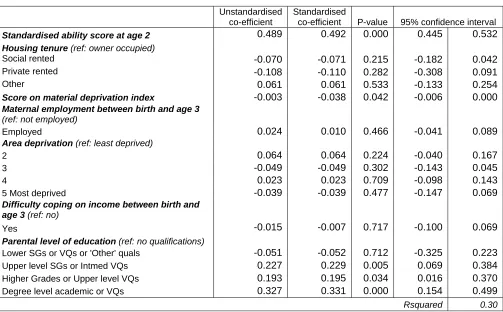
Table 18 Picture similarities economic and material circumstances domain multiple linear regression – full results
Unstandardised co-efficient
Standardised
co-efficient P-value 95% confidence interval
Standardised ability score at age 2 0.279 0.284 0.000 0.231 0.328 Housing tenure (ref: owner occupied)
Social rented -0.070 -0.070 0.213 -0.182 0.041
Private rented 0.137 0.137 0.120 -0.037 0.311
Other 0.117 0.117 0.475 -0.208 0.441
Score on material deprivation index 0.000 0.003 0.902 -0.004 0.004
Maternal employment between birth and age 3
(ref: not employed)
Employed 0.052 0.021 0.218 -0.031 0.135
Area deprivation (ref: least deprived)
2 -0.002 -0.002 0.972 -0.113 0.109
3 0.012 0.012 0.849 -0.118 0.143
4 -0.022 -0.022 0.737 -0.152 0.108
5 Most deprived -0.166 -0.166 0.030 -0.316 -0.017
Difficulty coping on income between birth and age 3 (ref: no)
Yes -0.018 -0.008 0.689 -0.109 0.073
Parental level of education (ref: no qualifications)
Lower SGs or VQs or 'Other' quals 0.066 0.066 0.684 -0.256 0.388
Upper level SGs or Intmed VQs 0.144 0.144 0.172 -0.064 0.352
Higher Grades or Upper level VQs 0.149 0.149 0.151 -0.056 0.354
Degree level academic or VQs 0.245 0.244 0.030 0.025 0.465
Table 19 Naming vocabulary combined domain multiple linear regression – full results
Unstandardised co-efficient
Standardised
co-efficient P-value 95% confidence interval
Standardised ability score at age 2 0.439 0.439 0.000 0.39 0.49 Maternal age at child’s birth (ref: 25 or older)
25 or older -0.040 -0.040 0.405 -0.13 0.06
Parental ethnicity (ref: both parents white)
At least one parent non-white -0.169 -0.169 0.152 -0.40 0.06
Mean score on home learning activities scale 0.003 0.034 0.126 0.00 0.01 Banded level of rules in household (ref: low
rules)
Medium 0.045 0.045 0.216 -0.03 0.12
High 0.138 0.138 0.010 0.03 0.24
Infant-maternal attachment score 0.133 0.063 0.001 0.05 0.21 Perceived readiness for school scale 0.002 0.009 0.616 -0.01 0.01 Total score on CSBS Infant/Toddler checklist 0.010 0.048 0.021 0.00 0.02 Attendance at ante-natal classes (ref: did not
attend)
Went to some classes -0.047 -0.047 0.483 -0.18 0.09
Went to all classes 0.123 0.123 0.000 0.06 0.19
Was child ever breastfed?(ref: no)
Yes 0.080 0.039 0.032 0.01 0.15
Poor mental health since child’s birth (ref: no)
Yes -0.050 -0.021 0.270 -0.14 0.04
Score on material deprivation index
Parental level of education (ref: no qualifications) -0.002 -0.023 0.168 0.00 0.00
Lower SGs or VQs or 'Other' quals -0.105 -0.105 0.456 -0.39 0.18
Upper level SGs or Intmed VQs 0.165 0.165 0.057 -0.01 0.34
Higher Grades or Upper level VQs 0.099 0.099 0.283 -0.08 0.28
Degree level academic or VQs 0.232 0.232 0.015 0.05 0.42
Table 20 Picture similarities combined domain multiple linear regression – full results
Unstandardised co-efficient
Standardised
co-efficient P-value 95% confidence interval
Standardised ability score at age 2 0.259 0.250 0.000 0.214 0.304
Mean score on home learning activities scale 0.007 0.058 0.002 0.003 0.012 Pre-school type (ref: nursery class attached to
school)
No pre-school -0.335 -0.357 0.025 -0.626 -0.043 Local Authority nursery school 0.015 0.052 0.796 -0.102 0.132 Private nursery school 0.174 0.158 0.000 0.086 0.262
Other provider 0.119 0.082 0.279 -0.099 0.337
Has child started primary school? (ref: no)
Yes 0.091 0.038 0.028 0.010 0.172
General health from birth to age 3 (ref: always
good or very good)
Temporarily or always fair, bad or very bad -0.096 -0.030 0.080 -0.204 0.012
Was child ever breastfed?(ref: no)
Yes 0.071 0.011 0.042 0.003 0.139
Area deprivation (ref: least deprived)
2 -0.008 0.043 0.889 -0.121 0.105
3 -0.012 0.050 0.867 -0.150 0.126
4 -0.040 -0.041 0.529 -0.165 0.086
5 Most deprived -0.163 -0.169 0.020 -0.299 -0.027
Parental level of education (ref: no qualifications)
Lower SGs or VQs or 'Other' quals 0.127 0.014 0.409 -0.179 0.433 Upper level SGs or Intmed VQs 0.158 0.074 0.133 -0.049 0.365 Higher Grades or Upper level VQs 0.163 0.082 0.105 -0.035 0.361 Degree level academic or VQs 0.225 0.146 0.04 0.011 0.440
Table 21 Naming vocabulary combined domain multiple linear regression on degree-level educated sub-sample – full results
Unstandardised co-efficient
Standardised
co-efficient P-value 95% confidence interval
Standardised ability score at age 2 0.414 0.414 0.000 0.343 0.485 Maternal age at child’s birth (ref: 25 or older)
25 or older -0.114 -0.114 0.250 -0.309 0.082
Parental ethnicity (ref: both parents white)
At least one parent non-white -0.173 -0.173 0.415 -0.596 0.249
Mean score on home learning activities scale 0.005 0.053 0.132 -0.002 0.012 Banded level of rules in household (ref: low
rules)
Medium 0.005 0.005 0.954 -0.156 0.165
High 0.066 0.066 0.476 -0.118 0.250
Infant-maternal attachment score 0.148 0.069 0.070 -0.012 0.307 Perceived readiness for school scale 0.000 0.000 0.988 -0.009 0.009 Total score on CSBS Infant/Toddler checklist 0.014 0.069 0.022 0.002 0.026 Attendance at ante-natal classes (ref: did not
attend)
Went to some classes -0.074 -0.074 0.410 -0.252 0.104
Went to all classes 0.115 0.115 0.036 0.007 0.223
Was child ever breastfed?(ref: no)
Yes 0.187 0.091 0.006 0.056 0.319
Poor mental health since child’s birth (ref: no)
Yes -0.070 -0.029 0.314 -0.208 0.068
Score on material deprivation index -0.002 -0.021 0.623 -0.008 0.005
Table 22 Picture similarities combined domain multiple linear regression on degree-level educated sub-sample – full results
Unstandardised co-efficient
Standardised
co-efficient P-value 95% confidence interval
Standardised ability score at age 2 0.248 0.261 0.000 0.177 0.319 Mean score on home learning activities scale 0.006 0.048 0.058 0.000 0.012 Pre-school type (ref: nursery class attached to
school)
No pre-school 0.180 0.089 0.349 -0.200 0.560
Local Authority nursery school 0.027 0.037 0.764 -0.155 0.209
Private nursery school 0.278 0.251 0.000 0.157 0.400
Other provider 0.046 0.051 0.759 -0.253 0.346
Has child started primary school? (ref: no)
Yes 0.032 0.013 0.598 -0.088 0.151
General health from birth to age 3 (ref: always
good or very good)
Temporarily or always fair, bad or very bad -0.034 -0.017 0.725 -0.230 0.161
Was child ever breastfed?(ref: no)
Yes 0.037 -0.019 0.569 -0.093 0.167
Area deprivation (ref: least deprived)
2 -0.072 -0.024 0.353 -0.225 0.081
3 -0.050 -0.027 0.521 -0.204 0.105
4 -0.050 -0.060 0.553 -0.216 0.116
5 Most deprived -0.237 -0.225 0.020 -0.435 -0.039
Table 23 Naming vocabulary combined domain multiple linear regression on lower educated sub-sample – full results
Unstandardised co-efficient
Standardised
co-efficient P-value 95% confidence interval
Standardised ability score at age 2 0.409 0.409 0.000 0.323 0.495 Maternal age at child’s birth (ref: 25 or older)
25 or older 0.063 0.026 0.398 -0.085 0.211
Parental ethnicity (ref: both parents white)
At least one parent non-white -0.281 -0.055 0.061 -0.575 0.013
Mean score on home learning activities scale 0.006 0.060 0.088 -0.001 0.013 Banded level of rules in household (ref: low
rules)
Medium 0.109 0.109 0.143 -0.038 0.257
High 0.151 0.151 0.163 -0.062 0.365
Infant-maternal attachment score 0.209 0.097 0.001 0.091 0.326 Perceived readiness for school scale -0.002 -0.013 0.672 -0.014 0.009 Total score on CSBS Infant/Toddler checklist 0.009 0.047 0.355 -0.011 0.029 Attendance at ante-natal classes (ref: did not
attend)
Went to some classes -0.008 -0.008 0.953 -0.267 0.252
Went to all classes 0.107 0.107 0.133 -0.033 0.248
Was child ever breastfed?(ref: no)
Yes 0.088 0.042 0.238 -0.060 0.235
Poor mental health since child’s birth (ref: no)
Yes -0.051 -0.021 0.542 -0.217 0.115
Score on material deprivation index -0.003 -0.031 0.283 -0.007 0.002
Table 24 Picture similarities combined domain multiple linear regression on lower educated sub-sample – full results
Unstandardised co-efficient
Standardised
co-efficient P-value 95% confidence interval
Standardised ability score at age 2 0.271 0.224 0.000 0.196 0.347 Mean score on home learning activities scale 0.011 0.103 0.003 0.004 0.019 Pre-school type (ref: nursery class attached to
school)
No pre-school -0.263 -0.382 0.344 -0.815 0.288
Local Authority nursery school -0.023 -0.006 0.815 -0.222 0.175
Private nursery school 0.121 -0.003 0.246 -0.085 0.326
Other provider -0.039 -0.026 0.872 -0.514 0.437
Has child started primary school? (ref: no)
Yes 0.162 0.055 0.059 -0.006 0.330
General health from birth to age 3 (ref: always
good or very good)
Temporarily or always fair, bad or very bad -0.128 -0.064 0.136 -0.298 0.041
Was child ever breastfed?(ref: no)
Yes 0.105 0.033 0.066 -0.007 0.216
Area deprivation (ref: least deprived)
2 -0.152 -0.070 0.232 -0.405 0.100
3 -0.194 -0.076 0.183 -0.482 0.094
4 -0.116 -0.123 0.360 -0.366 0.135
5 Most deprived -0.231 -0.150 0.061 -0.474 0.011
Table 25 Summary of interaction analysis results for knowledge of vocabulary Interaction included, whether significant, (direction of interaction*
and direction of main effect*)
Both (ref: those with Higher grades or equivalent)
Explanatory variable
Degree-level (ref: those without degree
education)
No, lower or upper Standard
Grade (ref: those with
Higher grades
or above) Degree-level
No, lower or upper Standard
Grades Mother was aged under
25 at child’s birth NS p < .05 +, - NS NS
Level of infant-maternal
attachment at 10 months NS NS NS p < .05 +, +
Language and communicative development at 22 months**
NS NS NS P < .01 +, +
Mother attended all
ante-natal classes NS NS NS NS
Child was breastfed NS NS p < .05 +, + NS
* ‘NS’ = not significant, ‘+’ = positive relationship, ‘-‘ = negative relationship
**The lower qualification group was adjusted for this explanatory variable being restricted to those with no qualifications or lower level Standard Grades only.
Table 26 Summary of interaction analysis results for problem solving
Interaction included, whether significant, direction of interaction* and direction of main effect*
Both (ref: those with Higher grades or equivalent) Explanatory variable Degree-level (ref: those without degree education)
No, lower or upper Standard
Grade (ref: those with
Higher grades
or above) Degree-level
No, lower or upper Standard Grades Frequency of
home-learning activities at age 1-2
NS NS NS p < .05 +, +
Did not attend pre-school p < .05 +, - NS p <.01 +, - NS Attended private
pre-school NS NS NS NS
Child had started primary
school NS NS NS NS
Child was breastfed NS NS NS NS
[image:27.595.64.534.420.648.2]