Deriving a High Resolution DEM from ALOS PRISM data
A dissertation submitted by
Andrew Charles Campbell
in fulfillment of the requirements of
Courses ENG4111 and 4112 Research Project
towards the degree of
Bachelor of Spatial Science (Surveying)
i
Abstract
With the launch of Japan Aerospace Exploration Agency‟s (JAXA) Advanced Land Observing Satellite (ALOS) carrying the Panchromatic Remote Sensing Instrument for Stereo Mapping (PRISM) a large scale high resolution solution for efficient and economically viable digital elevation models may have been found.
This research project endeavored to create a methodology for extracting a high resolution digital terrain model from JAXA‟s ALOS PRISM imagery using ITT‟s ENVI 4.6 software suite and in particular the „DEM Extraction‟ Module.
As ENVI 4.6 uses a RPC and GCP based approach to the extraction of DEMs GCPs were collected in the field using differential GPS techniques. The GCPs were then used to create an RPC model for the imagery from which the DEM could be extracted using ENVI 4.6‟s DEM Extraction Module.
It was found using this methodology that a useful DEM could not be extracted from ALOS PRISM data at this time.
ii
University of Southern Queensland
Faculty of Engineering and Surveying
ENG4111 Research Project Part 1 &
ENG4112 Research Project Part 2
Limitations of Use
The Council of the University of Southern Queensland, its Faculty of Engineering and Surveying, and the staff of the University of Southern Queensland, do not accept any responsibility for the truth, accuracy or completeness of material contained within or associated with this dissertation.
Persons using all or any part of this material do so at their own risk, and not at the risk of the Council of the University of Southern Queensland, its Faculty of Engineering and Surveying or the staff of the University of Southern Queensland.
This dissertation reports an educational exercise and has no purpose or validity beyond this exercise. The sole purpose of the course "Project and Dissertation" is to contribute to the overall education within the student‟s chosen degree programme. This document, the associated hardware, software, drawings, and other material set out in the associated appendices should not be used for any other purpose: if they are so used, it is entirely at the risk of the user.
Professor Frank Bullen Dean
iii
Certification
I certify that the ideas, designs and experimental work, results, analyses and conclusions set out in this dissertation are entirely my own effort, except where otherwise indicated and acknowledged.
I further certify that the work is original and has not been previously submitted for assessment in any other course or institution, except where specifically stated.
Andrew Charles Campbell
Student Number: 0078554
________________________________________ Signature
iv
Acknowledgements
I would like to acknowledge Dr Badri Basnet and Miss Xiaoye Lue from the University of Southern Queensland for the help and guidance that was given to me for the duration of the research project.
I also gratefully acknowledge Dr Peter Gibbings, Mr Clinton Caudell and Mr Liam Curren with regards to the help I received in the GPS component of the research project.
I acknowledge Dr Tony Ahfock for booking my external access times and the software developers at ITT for their help with problems encountered whilst using ENVI. I would like to thank Mr Bob Walker, the CEO of GeoImage, for his suggestions and help with the extraction of ALOS PRISM DEM‟s in industry.
v
Contents
Abstract ... i
Certification... iii
[image:6.595.114.526.210.762.2]Acknowledgements ... iv
Table of Figures ... viii
List of Tables... ix
Nomenclature & Acronyms ... x
Chapter 1 - Introduction ... 1
1.1 Background ... 1
1.2 Aim of Project ... 2
1.3 Benefit of Project ... 2
1.4 Justification ... 2
1.5 Limitations of Research ... 3
Chapter 2 - Literature Review ... 4
2.1 Introduction ... 4
2.2 Digital Elevation Model Generation ... 5
2.3 Limitations ... 7
2.4 ALOS (Advanced Land Observing Satellite) ... 8
2.5 PRISM (Panchromatic Remote Sensing Instrument for Stereo Mapping) ... 9
2.7 Previous Methods for ALOS PRISM DEM Extraction. ... 11
2.9 Levels of ALOS PRISM data ... 12
2.8 Conclusions ... 14
Chapter 3 - Methodology ... 16
3.1 Introduction ... 16
3.2 Materials ... 16
3.2.1 ALOS PRISM Imagery ... 16
vi
3.2.3 Trimble Hand-held GPS ... 18
3.2.4 Trimble Pathfinder Office ... 18
3.2.5 Equipment used in Field Survey ... 19
3.2.6 Equipment used for DEM Extraction ... 19
3.3 Methods ... 20
3.3.1 Reconnaissance and Planning ... 20
3.3.1 Collection of Ground Control Points using Differential GPS techniques . 21 3.3.2 Post Processing of Ground Control Points ... 22
3.3.3 RPC model Generation ... 23
3.3.4 Extraction of the DEM ... 28
3.2.5 Compilation of Resulting Digital Elevation Models ... 33
3.2.6 Analysis of Results ... 33
3.3. Conclusions ... 35
Chapter 4 - Results and Discussion ... 36
4.1 Introduction ... 36
4.2 Field Survey ... 36
4.3 Software Testing ... 38
4.3.1 RPC Model ... 38
4.3.2 Preliminary Testing... 38
4.3.3 Testing with ITT supplied patch ... 39
4.3.4. Stereo Pair Testing ... 39
4.3.5. Consultation with Industry... 41
4.2.6. Google Earth Ground Control Point Test ... 42
4.2.7. Effects of Cloud Coverage on DEM ... 43
4.3 Conclusions ... 44
Chapter 5 – Conclusion ... 46
5.1 Introduction ... 46
5.2 Future Research ... 46
5.3 Oversights in Research ... 47
5.4 Close ... 48
List of References ... 49
Appendix A - Project Specification ... 51
Appendix B – ALOS PRISM Nadir Image ... 52
Appendix C – Raw ALOS PRISM data ... 53
Appendix D – Amended Header (RPC Model Corrections) ... 61
vii
viii
Table of Figures
Figure 2.1Typical DEM (Gonçalves, J.A 2008) ... 5
Figure 2.2 PRISM Configuration (Takaku J. et al 2007) ... 10
Figure 2.3Differenitating between levels of ALOS PRISM data (PCI Geomatics 2006) ... 13
Figure 2.4 Differenitating between levels of ALOS PRISM data (PCI Geomatics 2006) ... 13
Figure 3.1 Trimble GeoXT Mapping Grade GPS ... 18
Figure 3.2 The location of GCPs over subject site ... 22
Figure 3.3 ENVI RPC Build Interface ... 25
Figure 3.4 Identifying Ground Control Points for RPC Model calculation ... 26
Figure 3.5 Orientation Calculations from RPC Build Widget ... 27
Figure 3.6 Stereo Pair Selection for DEM Extraction Wizard ... 29
Figure 3.7 Selection of GCPs for ALOS PRISM Stereo Pair ... 31
Figure 3.8 3D SurfaceView Display ... 33
Figure 3.9 ENVI 4.6 3D Epipolar Cursor ... 34
Figure 4.1 Forward & Backward DEM ... 40
Figure 4.2 3D Epipolar Cursor for Forward Backward Imagery ... 41
ix
List of Tables
x
Nomenclature & Acronyms
ACRES: Australian Centre for Remote Sensing
AHD: Australian Height Datum
ALOS: Advanced Land Observing Satellite
CCD: Charged Couple Device
DEM: Digital Elevation Model
ENVI 4.6: A photogrammety based software suite used for orhorectification, DEM Extraction and other photogrammety applications
GCP: Ground Control Point, being a point that is measured in the field and located on the piece of satellite imagery.
ITT: ITT Visual Systems are the company that developed the photogrammetry software suite ENVI 4.6
JAXA: Japanese Aerospace Exploration Agency
MGA94: Map Grid of Australia
PRISM: Panchromatic Remote Sensing Instrument for Stereo Mapping.
RPC: Rational Polynomial Coefficient
1
Chapter 1
- Introduction
1.1
Background
In the past the task of creating digital elevation models has been a time consuming and expensive exercise. Traditionally the work would entail a surveyor using a theodolite, steel band or Electronic Distance Measurement (EDM) and physically measuring points in the field from which would later be reduced and the digital elevation model deduced. Obviously this method was expensive and time consuming for both the field survey and the calculations from which the DEM would be created.
With the invention of airplanes and satellites a new method by which the geometry of two images, a stereo-pair, along with known control points could be used to calculate the elevation changes of the topography. The methodology of creating digital elevation models using this imagery relies upon a large amount of man hours expertly reducing the data and at times large geodetic surveys to provide the ground control to create the digital elevation model. The imagery itself is also expensive whether it is from an airborne or orbiting sensor especially when the data is ordered „on demand‟.
2
ALOS PRISM data. With the dexterity and power of ENVI 4.6 it may be now possible to realise this potential and provide a cost effective and efficient high resolution ALOS PRISM DEM.
1.2 Aim of Project
The aim of this project is to create a methodology for the extraction of a high resolution digital elevation model from ALOS PRISM data using ITT‟s ENVI 4.6 and DEM Extraction module.
1.3 Benefit of Project
The methodology created from this project will help to further the understanding of the interaction of ALOS PRISM data with a program that is marketed at being compatible with ALOS PRISM and the problems encountered with the data‟s reduction. Currently there is no set procedure available when extracting a DEM from ALOS PRISM data using ENVI 4.6. The research and testing done in this project is expected to create a working procedure so the future uses are not required to face the limitations and functional problems identified in this project.
1.4 Justification
3
1.5 Limitations of Research
4
Chapter 2
- Literature Review
2.1
Introduction
This chapter provides a review of the literature that was available at the time of the project. It is important to understand what a digital elevation model (DEM) is and the benefits of deriving a methodology for the extraction of a high resolution DEM. This requires a general background on the current methods of extracting a DEM. It is also prudent to understand the applications for such a DEM and therefore this chapter outlines how industry uses the data.
As it is an emerging technology a general background on the Advanced Land Observing Satellite (ALOS) is outlined in this chapter as well as its mission objective and a description of the sensors that ALOS is using to achieve the objective. A more in-depth overview of the Panchromatic Remote Viewing Sensor for Stereo Mapping (PRISM) is given as it is important to understand the sensor when creating a DEM from its data.
5
2.2
Digital Elevation Model Generation
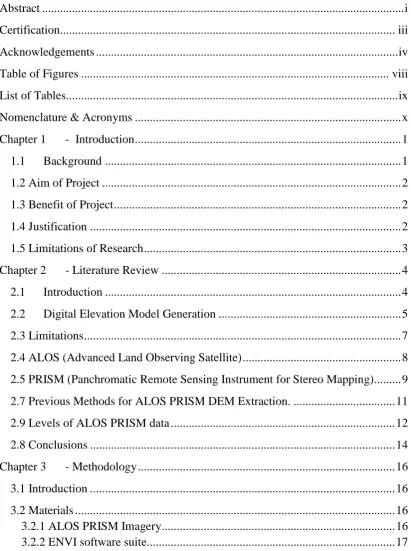
[image:16.595.126.512.262.496.2]A DEM is a digital representation of topography created in the digital environment of computer hardware and software. Figure 2.1 shown below indicates a general representation of a DEM created in the computer environment. The X axis shows the Easting co-ordinate, beginning with 564000 and the Northing is indicated by the Y axis beginning with 4567000. The height is indicated by the Z axis and ranges from 300 units to 500 units.
Figure 2.1Typical DEM (Gonçalves 2008)
6
orientation. Mechanical Stereo Plotters have since evolved and become computer based.
Computer software has been developed so that the user can digitally align the stereo pair and digitise the topographic data by way of setting a 'floating' cross hair over a point and when the cross hair is in focus a foot pedal or mouse click will store the x,y and z position of that point. This method still relies on manual labor to extract the DEM and allows the inaccuracy of human error into the DEM (Elfick et al 1994). Whilst in some respects different software packages differ in the process of extracting DEMs from stereo-scopic pairs they are all fundamentally similar. This is one of the areas in which extraction of a DEM differs with using ALOS PRISM data to create a DEM as stereo-scopic triplets are used. As conventional software does not offer a system that can handle stereo triplets two stereo pairs need to be created and merged to give the final DEM. A study on the accuracy of Digital Surface Models (DSM) has stated that; “Since triplet matching is redundant, it can generate a DSM with less noise than stereo matching” (Imai et al 2008). Conventional DEM's rely on Tie Points based on GCP's (Ground Control Points) to orthorectify the imagery from which the DEM can be extracted from. The developers of PRISM have determined that the redundancy created by the third photograph can be used to reduce matching error. This is outlined in a prominent remote sensing journal as below; “The triplet matching of an ALOS PRISM DEM uses triplet redundancy to reduce matching error” (Maruya 2007). F-N matching and B-N matching and F-B matching are performed independently, and only a portion of results which coincide with each other are adopted (Imai et al 2008) This coupled with the GPS attached to PRISM voids the need for GCP's when creating a DEM from PRISM data. Another article written on the application of PRISM DSM's to disaster monitoring furthers this statement:
7
to extract correspondence pixels from stereo pair (Gruen 2005).” (Kyaw et al 2008)
2.3 Limitations
There are several limitations for the application of ALOS PRISM data, most of which depend on the level of detail that the client wishes to have in the final DEM. For example, a study on the elevation accuracy of a DSM using ALOS PRISM data found “some noises in the generated DSM data when the place has low contrast such a forests and flat area. The miss-matching errors could be occurred in such area” (Kyaw et al 2008). The study also proved that the RMS (Route Mean Squared) error of the elevation value fluctuated when compared to GCP's surveyed by GPS (Kyaw
et al 2008).
This also brings up the limitation of the software for ALOS PRISM DEM extraction as the positional algorithms are still in their testing stage and any high precision DEM would still need to be compared with GCP's in practice to verify the DEM. Another study on the geometric validation of ALOS PRISM DEM's found that “radiometric quality problems” (Geoimage 2008) may cause the imagery to have deficiencies which in turn added to noise. This is suggested to be due to the “non optimal on-board jpg compression” (Geoimage 2008).
It has also been suggested that nadir PRISM is limited by the fact that it is not usually captured at the same time as the nadir AVNIR-2. This introduces errors into the integration of using data captured from both instruments (Geoimage 2008).
8
2.4 ALOS (Advanced Land Observing Satellite)
ALOS was launched by Japanese scientists on the 24th of January 2006 by the H-IIA #8 at Yoshinobu Launch Complex of the Tanegashima Space Center. The ALOS has a design life to be functional from 2009 until 2011 (JAXA 2007).
The official objectives of ALOS are;
to provide maps for Japan and other countries including those in the
Asian-Pacific region (Cartography)
to perform regional observation for "sustainable development",
harmonization between Earth environment and development (Regional Observation),
to conduct disaster monitoring around the world (Disaster Monitoring),
to survey natural resources (Resources Surveying),
to develop technology necessary for future Earth observing satellite
(Technology Development)
(JAXA 2007)
To achieve the mission objects ALOS was put into a “sun synchronous sub recurrent orbit” (Bignone et al 2008) with an orbital revisit period of 46 days. (Rosenqvist et al 2004) ALOS is fitted with three different remote sensing instruments two being optical sensors and a single radar sensor. The optical sensors attached to ALOS are PRISM and the Advanced Visible and Near Infrared Radiometer type 2 (ANVNIR-2) with the third sensor known as the Phased Array type L-band Synthetic Aperture Radar (PALSAR) (JAXA 2007).
9
Position is tracked by a dual-frequency carrier-phase tracking-type GPS receiver in the satellite which provides 1-metre off-line positional accuracy. The attitude of the craft is calculated from observations taken by a high precision 3-telescope Star Tracker (STT) which monitor the positions of distant stars. The attitude movements is then corrected by gyros within the space craft (JAXA 2007).
All of the instruments found on the ALOS satellite have been used to enhance the data collected by each individual instrument, for example AVNIR-2 images have been orthrectified using PRISM data collected on a different epoch. (JAXA 2007).
2.5 PRISM (Panchromatic Remote Sensing Instrument for Stereo
Mapping)
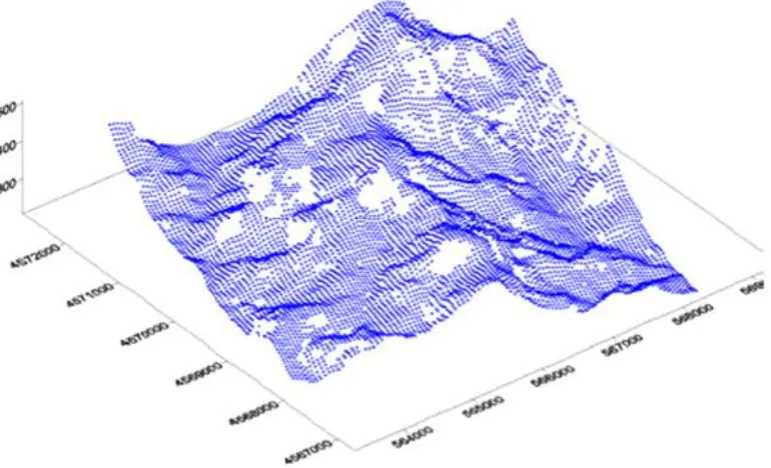
PRISM acquires high resolution stereo imagery by way of a triple line scanner, this provides three overlapping images from different viewing angles.
Figure 2.2 below illustrates the sensor itself, defining the three mounts of the PRISM sensor as they are mounted to the ALOS. The 23.8˚ difference in the across track angle can be seen as the Forward and Backward sensors are mounted in tandem on the plate with the Nadir sensor mounted on the opposite side. The Nadir position meaning angle of the image is directly below the sensor at the time of scanning. The Nadir sensor is mounted as such so that the base-to-height ratio of the sensor is to a ratio of 1.0 (Imai 2008). In a paper authored by Jing it is stated that the base-to-height ratio greatly impacts the elevation accuracy of DEM's produced from linear triplet satellite imagery with scientists stating that; “the greater the „base-to-height‟ ratio the higher the elevation precision” (Jing et al 2008).
10
The optical line sensors comprising PRISM have a ground resolution of 2.5m to produce the high resolution imagery that is necessary to complete the instruments objective. This allows for good potential for relief mapping with a positional accuracy compatible with scale 1:25000 (Gonçalves 2008).
The sensor itself is made up of 3 radiometers made up of between 6 and 8 CCD units (Nadir 6, Forward and Backward 8). Each CCD unit has approximately 5000 detectors and the consecutive maximum of 4 CCD units from each of the three radiometers is used for capturing the stereo triplet observations (Takaku et al 2007). Furthermore the method of calibrating the CCD's is explained by Junichi Takaku as follows;
“The CCD alignment models of each unit are given as the pre-launch measurement values. The on-orbit relative accuracy of these alignment models between CCD units was evaluated and calibrated as the self-calibration. To evaluate the relative CCD alignment GCP residuals of exterior orientations were used.”
[image:21.595.169.496.150.315.2]Another potential of the PRISM sensor is to provide “medium scale mapping and DEM production without ground control points” (Kamiya 2007). An Angular
11
Displacement Sensor (ADS) is mounted directly to the PRISM module and this measures high-frequency oscillation (Kamiya 2007).
To compute the orientation, a program using open algorithms was created to determine error factors and better the geometric accuracy. Coupled with this was a DEM and Orthoimage generation program was developed in the hope that eventually ALOS PRISM DEM's could be created without the need for a digital stereo plotter.
Although this review has shown that ALOS PRISM data has been used in high resolution DEM extraction, it has yet to be done in Australia and the automation of such data in the extraction process has not yet been tested and verified. Thus the necessary methodology for such automation of DEM extraction using ALOS PRISM data is an important evolution of photogrammetry and remote sensing reduction methods.
A study performed by Terranean Mapping Technologies found that ALOS PRISM DEM's were potentially more economically viable than that of LIDAR and SAR as it was estimated that ALOS would cost between $4 and $8 per square km, in comparison, LIDAR and SAR currently cost between $100 and $150 per square km. (Terranean 2008)
2.7 Previous Methods for ALOS PRISM DEM Extraction.
ALOS PRISM imagery has previously been used to generate DEM‟s using photogrammetric software suites. A study into the Photogrammetric Generation of DEMs using ALOS PRISM images was conducted by Terranean Mapping Technologies and a report written for submission to Geoscience Australia.
The study provided some insight into what techniques can be employed in industry when extracting an ALOS PRISM DEM. The study area was based over the Young, Harden, Cootamundra and Gundagai townships in of central New South Wales.
12
scene, this was due to the conclusion that “stereo pairs with one vertical image have less (y) parallax and therefore less vertical precision”. Thus in this study the Nadir image was not used (Terranean 2008).
The first issue that was encountered occurred when the original data was purchased from ACRES the photogrammetic software that was used in the study, being Socket SET, could compute the interior and exterior orientation of the ALOS PRISM imagery without having complimenting RPC data. Socket SET, evidently did not have the capacity to compute the RPC model. As a result of this, imagery had to be purchased from JAXAs direct distributor RESTEC in Japan. The data purchased was of such a level that RPC data was also included.
Twelve ground control points were purchased from Geoscience Australia and were used with SOCET SET to generate the ALOS PRISM DEM. Terranean managed to extract a 10 meter interpolated DEM using this methodology and created 5 meter contours. From these a TIN was extracted and compared with GPS observations of the ground control points gathered by and purchased from Geoscience Australia. The results of this comparison showed that by just using the Forward and Backward ALOS PRISM imagery without the use of the Nadir image, Terranean could achieve a DEM that was on average 3.4108m different to the GPS observations and a TIN with an RMS of 3.55764 (Terranean 2008).
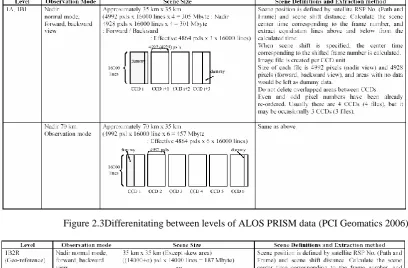
2.9 Levels of ALOS PRISM data
13
[image:24.595.114.523.207.475.2]The supplied files are; the Volume directory, Leader, Image, Trailer and Supplemental. The level at which the data has been reduced to will have an effect on whether the Supplemental file is supplied and the records that are kept in the remaining file types (PCI Geomatics 2006). Below are two figures extracted from a PCI Socket SET demonstration on the levels of ALOS PRISM data.
[image:24.595.115.522.446.602.2]Figure 2.3Differenitating between levels of ALOS PRISM data (PCI Geomatics 2006)
Figure 2.4 Differenitating between levels of ALOS PRISM data (PCI Geomatics 2006)
As shown above the product that is supplied greatly differs between the level of data that is supplied by the distributor.
14
the Socket Set software suite with purchased RPC models and the imagery provided is Level1A or Level1B thus all 4 CCD images are provided. (Terranean 2008)
This project based the digital terrain model off a computed RPC model and Level1B2 data. The Level1B2 data having all 4 CCD images already combined and therefore there is only one image supplied. (see fig 2.4)
2.8 Conclusions
The extraction of a high resolution DEM from satellite imagery provides an opportunity for large tracks of terrain to be mapped. This may have not been previously feasible when using traditional methods due to the large amount of time and cost that these methods incur.
To realise the potential of the extraction of a high resolution ALOS PRISM DEM without the use of ground control points will rely on developing software that can handle Geo-Referenced imagery. For this to be achieved it is advisable to have a level of ALOS PRISM data that has not been reduced significantly as the Supplemental file will provide the data that is needed to reference the image without ground control points.
With a pixel resolution of 2.5m JAXA‟s ALOS PRISM sensor provides a solution for large scale mapping to an accuracy of 1:25000. With the base to height ratio being 1 at the Nadir optical sensor the vertical accuracy has the potential to be extremely high.
15
16
Chapter 3
- Methodology
3.1 Introduction
The above review of current literature provided in Chapter 2 identified the components that were necessary to successfully extract a high resolution DEM using ALOS PRISM data.
In this chapter the methods that were used to satisfy the aim of this project as shown in Chapter 1 have been outlined. Due to the level of data obtained for the project an RPC model was created using ENVI 4.6.
The procedure below is only for the extraction of a high resolution DEM using ENVI. Although the theory may not change, this procedure does not cover issues or problems that may arise when using other software packages.
To ascertain accuracies of raw data, such as the GPS observations collected during the field survey, where possible the collection of such data was done personally. This may not represent true occurrences in industry as much of this work will be subcontracted.
3.2 Materials
3.2.1 ALOS PRISM Imagery
17
data had been quality assured by staff at ACRES and the check list provided within the bundle.
Three directories with a „Twmba‟ prefix were provided with a suffix „UB‟, „UN‟ and „UF‟ for Backward, Nadir and Forward respectively. Within each folder there was a;
„scene01‟ directory
„ALOS licence‟ PDF
„Label‟ text file
„QACheckList‟ text file
„Readme‟ text file
Within each „scene01‟ directory a leader, image, trailer and volume file was provided.
An example of the ALOS imagery can be found in Appendix B and the three raw data files can be found in Appendix C.
3.2.2 ENVI software suite
Access to the ENVI software suite was provided by way of the University of Southern Queensland‟s Remote Access computer. The DEM Extraction module was installed and used for the experiment. Furthermore as the project progressed it came to light that ENVI‟s Extraction module could not cope as well as the designers expected with the RPC model. As a result, ITT was contacted and a patch was provided by ITT. This patch was installed as directed by ITT.
18
region. There is a dramatic change in topography between the eastern down-lands and the top of the range featuring the city of Toowoomba. There is also several other deviations in topography throughout the western part of the imagery.
The imagery was provided with co-ordinated extents and each image had around 7% cloud coverage.
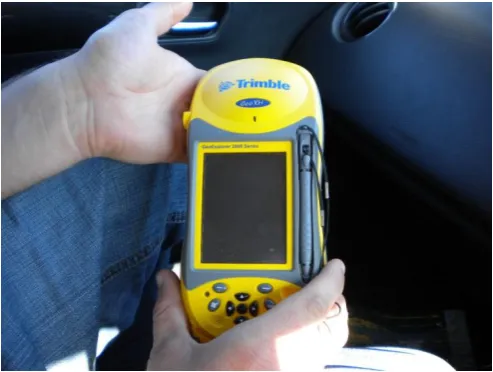
[image:29.595.195.442.279.465.2]3.2.3 Trimble Hand-held GPS
Figure 3.1 Trimble GeoXT Mapping Grade GPS
The GPS „rover‟ used for the field component of this research project was a Trimble GEO XT Mapping Grade GPS (see fig 3.1 above) from the University of Southern Queensland. The software used on the GPS for data collection was „Trimble Terrsync’. The hand-held GPS was used in tandem with the University of Southern Queensland‟s Base Station „ANANGA‟ to provide corrections to the observations.
3.2.4 Trimble Pathfinder Office
19
logged on the base station. This component of the project was completed by Dr Peter Gibbings and the corrected data provided for use as Ground Control Points for the DEM Extraction.
3.2.5 Equipment used in Field Survey
1 x Car
1 x Map of ALOS PRISM Scene (Nadir) or standard car GPS
1 x Computer
1 x Trimble Geo XT handheld GPS with TerrSync installed
Offset Tape (For measuring height of GPS)
Permanent Mark Form 6 (for GPS verification)
3.2.6 Equipment used for DEM Extraction
Computer (HP TouchSmart)
ITT ENVI Software
ITT ENVI DEM Extraction Module Software
Microsoft Excel
Bernie J Snodgrass‟s Survulator (For Co-ordinate transformations)
HP 50g Calculator
Writing Materials
20
3.3 Methods
3.3.1 Reconnaissance and Planning
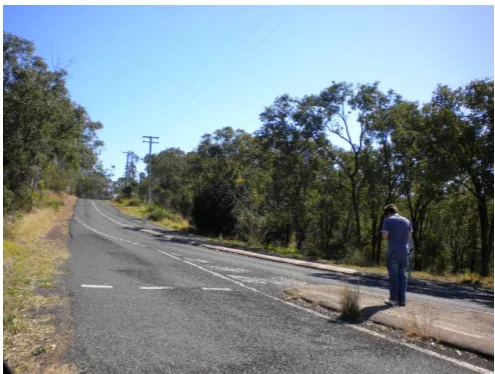
Before the differential GPS survey to collect ground control points could be carried out it was necessary to plan a route to travel that would maximize efficiency (see Appendix E). It was also necessary to survey the imagery for cloud coverage as any points within these areas would be unusable.
There was also a need to verify the field survey. To achieve this Permanent Survey Marks were used (see Appendix F). As a previous USQ Student had rigorously verified the co-ordinates and reduced levels of several Permanent Survey Marks around Toowoomba using static GPS techniques, these marks provided a highly accurate solution. Each Permanent Mark had 1st Order horizontal co-ordinates. Each Permanent Mark also had a high order AHD level. The Form 6 for each mark was obtained using CONICS Brisbane‟s Permanent Mark database.
The Permanent Marks therefore formed the basis for the beginning and end of each field trip. The Universities fixed base station „ANANGA‟ was also checked at this time to ensure that data was being correctly logged.
Due to the accuracy of the GPS being used no skyplots or satellite almanacs were consulted.
As private property could not easily or legally be accessed it was omitted from this project and therefore the route was forced to predominantly follow main roads around the greater Toowoomba area.
21
3.3.1 Collection of Ground Control Points using Differential GPS
techniques
The field survey was completed over two days, the first being the 16th of August and the second the 24th of August 2009. The field process on both days was the same and was as follows;
1. Ensure that Trimble Geo XT is set up to log data in appropriate form
2. Ellipsoid – WGS84
3. Co-ordinate system set appropriately for reduction
4. TerraSync data dictionary set to „General‟
5. Ensure that no „real time‟ correction is occurring
6. Check that Base Station, in this case the University of Southern Queensland‟s ANANGA, is logging data correctly
7. Set receiver height on Trimble Geo XT to appropriate height for the day, in the case of this project 1.2m
8. Drive to first known point and locate point for several epocs at least 10 times ignoring expected error. The point is hit several times as it is important to have enough data on known points to compare with the correct co-ordinates
22
Figure 3.2 The location of GCPs over subject site
10.Locate a scatter of points within the subject sight ensuring to get a balance of points for verification and DEM Extraction. An appropriate point for ALOS PRISM imagery is the intersection of two roads. An appropriate verification point is a grass field, wooded area or bare soil. For one ALOS PRISM scene around 100 points (at Nadir) are sufficient to both extract and verify the DEM.
11.Once sufficient ground points have been collected repeat Step 4 on each of the known control points so that a shift in the constellation of satellites can be derived.
3.3.2 Post Processing of Ground Control Points
23
3.3.3 RPC model Generation
The creation of a RPC model for each image is an essential component in extracting a high resolution ALOS PRISM DEM using ENVI‟s Extraction Module as the software uses the RPC model for orthorectification and calculating the epopular images that lead to the creation of the DEM. The best way to create an RPC model using ENVI is the Build RPC Wizard. Due to the way that ENVI 4.6 deals with RPC data created for ALOS PRISM imagery ITT must be contacted, a patch downloaded and installed before the DEM Extraction model can use the RPC model with ALOS PRISM data. The method of how to install the patch is as follows;
1. Save envi_ort.sav to Desktop
2. Locate the ITT directory on computers hard drive, with a standard installation the directory is found at: C:\Program Files\ITT
3. Locate the ENVI46 folder within the ITT directory: C:\Program Files\ITT\IDL708\products\ENVI46\
4. Locate the „Save‟ folder
5. Copy and paste envi_ort.sav into the „Save‟ folder within the ENVI46 directory
6. Accept the message to „Overwrite Existing File‟
With the patch installed the Build RPC function is used to create the RPC model for each of the ALOS PRISM images. The method of how to use the Build RPC wizard is as follows;
1. ENVI 4.6 is opened
2. The MAP tab is selected and the Build RPC option is clicked
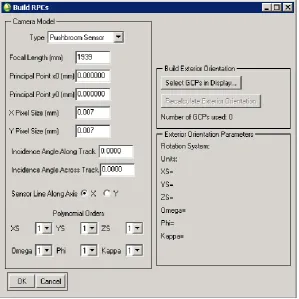
3. The Build RPC interface is presented. For ALOS PRISM data the interface is filled out as follows;
24
Type = Pushbroom Sensor
Focal Length (mm) = 1939.0
Principal Point x0 (mm) = 0.0000
Principal Point y0 (mm) = 0.0000
Xpixel Size (mm) = 0.007
Ypixel Size (mm) = 0.007
Incidence Angle Along Track = 0.0° at Nadir / 23.8° (Backward) /
-23.8° (Forward)
Incidence Angle Across Track = 0.0°
Sensor Line Along Axis = X
25
Figure 3.2 illustrates the interface into which the above values need to be input.
26
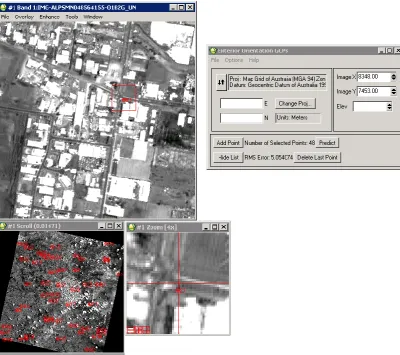
[image:37.595.116.517.158.513.2]4. The Ground Control Points are defined interactively by clicking the Select GCP‟s in Display button. Figure 3.4 illustrates the interface used when selecting Ground Control Points for the RPC Model in ENVI 4.6.
Figure 3.4 Identifying Ground Control Points for RPC Model calculation
5. The co-ordinate system is chosen to match the format in which the Ground Control Points have been reduced to, in the case of this project it was MGA Zone 56.
27
7. When at least four ground control points have been entered, the „Predict‟ button is utalised so that when true co-ordinates are entered with an elevation then the software will predict where this point is on the image.
8. Once the ground control points were entered they were saved as a .pts file and then exported back to the Build RPC widget by clicking the „Options‟ tab on the menu bar.
[image:38.595.115.572.346.705.2]9. Now back at the Build RPC interface the „Calculate Exterior Orientation‟ button is clicked and the Exterior Orientation Parameters examined. Figure 3.5 shows the interface that is presented when orientations are calculated. The left side window shows the process by which the RPC model was calculated with the final results in the Build RPCs window.
28
10.When the Exterior Orientation Parameters are satisfactory the „OK‟ button is clicked. A message stating that the RPC information has been added to the
Header of the image notifies that the RPC model has been calculated. The resulting file can be found for all three images in Appendix D.
11.Steps 3-10 are then repeated for each of the images. This result in each image has its own RPC Model created. At this point the coefficients are check to ensure that there are similar solutions. Though it is a derivative of the true value it is beneficial to be as close as possible.
3.3.4 Extraction of the DEM
Now that the RPC model for each image has been computed the ENVI DEM Extraction module can be used. The method for extracting the DEM from the ALOS PRISM data with RPC‟s using the ENVI DEM Extraction module is as follows;
1. ENVI 4.6 is opened
2. As a Display must be open to run the DEM Extraction Wizard go to FILE – Open External File – ALOS – PRISM
3. An image file is selected, i.e. with the prefix IMG_
4. The Topography tab in the menu bar is selected, the process is then as follows - DEM Extraction - DEM Extraction Wizard – New
29
Figure 3.6 Stereo Pair Selection for DEM Extraction Wizard
6. The image that is to be displayed as the „Left Image‟ is selected and Band 1 is loaded. In the case of this project the Forward image is selected
7. The image that is to be displayed as the „Right Image‟ is selected and Band 1 is loaded. In the case of this project the Nadir image is selected
8. The „Scene Elevation in Meters‟ section is checked for reasonable figures
9. The „Next Button‟ is clicked
30
No GCPs (relative DEM values only)
Define GCPs Interactively
Read GCP‟s From File
11.In the case that the DEM Extraction Wizard is being used for the first time then the „Define GCPs Interactively‟ radio button is checked. For use there after the „Read GCPs From File‟ is checked and a saved ASCII file is read
31
[image:42.595.141.570.163.520.2]13.True co-ordinates are entered with the elevation and the same pixel is selected on each image. As shown in Figure 3.6 a „scattering‟ of GCPs are input around the ALOS PRISM scene.
Figure 3.7 Selection of GCPs for ALOS PRISM Stereo Pair
14.Once the GCPs have been entered the data is exported back to the DEM Extraction Wizard and the „Next‟ button is clicked
15.The Tie Points Interface is now viewed with the choice‟s to;
Generate Tie Points Automatically
Define Tie Points Interactively
Read Tie Points From File
32
17.The „Tie Points‟ widget and both images are now displayed and a sufficient number of tie points are selected on each image. The „Y Maximum Parallax‟ of the tie points must stay under „10‟ for the DEM Extraction Module to work
18.Once a sufficient number of tie points has been established the tie points are exported back to the DEM Extraction Wizard
19.It is now possible for the program to create the left and right epipolar images
20. The epipolar images are examined by clicking the „RGB= Left, Right, Right‟ or „RGB=Right, Left, Left‟ buttons
21.When the epipolar images are satisfactory the „Next‟ button is clicked
22.The DEM Output Project Parameters are now specified. In the case of this project they are as follows;
Proj: MGA, Zone 55
X Pixel Size = 2.5 Meters
Y Pixel Size = 2.5 Meters
23. After these parameters are entered the „Next‟ button is clicked
24. Now the DEM Extraction Parameters are specified
25.The DEM is now generated and can be viewed and examined in a number of ways. These include „3D Surface View‟ and in the case of ALOS PRISM DEM‟s the DEM can be verified by way of the „3D Epipolar Cursor‟
33
3.2.5 Compilation of Resulting Digital Elevation Models
Now that two digital elevation models have been created, and as ENVI 4.6 cannot deal in stereo-triplets, they must be combined to create a single ALOS PRISM DEM. As it is not possible to combine two DEM‟s in this software, the method to create a single DEM is to orthorectify the imagery before creating a single DEM.
3.2.6 Analysis of Results
[image:44.595.111.525.492.726.2]As a gross check on the DEM itself, ENVI‟s 3D Surface View was used. This gave the opportunity to visually look at the areas of the DEM that were giving grossly incorrect values in the DEM. To achieve this, the 3D Surface View set-up box was utalised by choosing the highest and lowest values to plot. The value that was needed was given by the RPC Build widget. To further exaggerate the difference elevation the „plot elevation‟ was scaled up by a factor of 5. Figure 3.8 shows both the input interface for 3D Surface View and the output window with a DEM shown.
34
[image:45.595.112.523.249.660.2]Once a single DEM has been created it is possible to test the quality of the DEM by using ENVI‟s 3D Epipolar cursor. This function uses the epipolar results of the imagery to provide an x and y position for a single point and calculates the z value. The values can then be compared with known values from the GPS survey and the DEM is then verified for accuracy. Figure 3.9 gives an example of the ENVI 4.6 interface when using the 3D Epipolar Cursor.
35
3.3. Conclusions
The above methodology is fundamentally the same as would be followed using the photogrammetry software packages that are currently being used to extract high resolution DEMs from ALOS PRISM data in industry.
The main difference encountered with the methodology in this dissertation is the generation of an RPC model. In industry if an RPC model is not supplied by the manufacturer the data is usually neglected and new data purchased.
The field component in this methodology is based on using a Trimble Handheld GPS with the software Terrasync installed. The same solution may be available through other methods of differential survey such as using a rover and a CORS network of choice. As such this was not available at the time of this project and therefore the fixed base station at the University of Southern Queensland was used and was provided a comparable result with post processed corrections.
The RPC model generated using this methodology appears to be of sufficient quality, as professionals from Geoimage have been consulted and agree. The result of the RPC model is also supported by the Upper and Lower limit shown at the end of generation and the quality of the ground control points used by the RMS error within the widget itself.
36
Chapter 4
- Results and Discussion
4.1 Introduction
The procedures outlined above were followed and provided a range of results. From these results an abundance of problems arose that are to be discussed in this chapter.
It is due to the issues that were faced with the extraction of a high resolution DEM using ALOS PRISM data that it is necessary to present the results and discussion in the same chapter.
Where necessary the results are provided either in statistical or graphical data and imagery. Several screen shots accompanied with discussion are also provided in this chapter to define and explain the results that have been obtained.
4.2 Field Survey
37
POINT ID NORTHING EASTING RL COMMENT DATE TIME
1 6945488.978 394860.426 683.073 pm40424 08/24/09 11:01:29am 2 6945488.965 394859.944 682.815 08/24/09 11:01:44am 3 6945489.107 394860.745 684.044 08/24/09 11:01:56am 4 6945489.096 394860.269 683.586 08/24/09 11:02:07am 5 6945489.265 394860.151 683.907 08/24/09 11:02:20am 6 6945489.524 394860.384 684.430 08/24/09 11:02:34am
AVERAGE 6945489.156 394860.320 683.643
KNOWN
CO-ORDS 6945489.266 394860.174 683.293
DELTA
CO-ORDS -0.110 0.146 0.350
11 6952126.258 391675.100 615.019 pm59005 08/24/09 11:40:40am 12 6952126.543 391674.496 615.171 08/24/09 11:40:52am 13 6952126.690 391674.065 615.330 08/24/09 11:41:05am 14 6952126.269 391674.321 614.710 08/24/09 11:41:18am 15 6952126.530 391673.986 614.342 08/24/09 11:41:28am 16 6952126.249 391674.516 615.063 08/24/09 11:41:37am
AVERAGE 6952126.423 391674.414 614.939
KNOWN
CO-ORDS 6952126.284 391674.487 615.218
DELTA
CO-ORDS 0.139 -0.073 -0.279
21 6952344.011 400594.818 615.917 pm40827 08/24/09 12:09:11pm 22 6952343.800 400594.174 615.399 08/24/09 12:09:24pm 23 6952343.795 400593.631 615.130 08/24/09 12:09:37pm 24 6952343.873 400593.913 615.084 08/24/09 12:09:50pm 25 6952344.298 400593.956 615.387 08/24/09 12:10:02pm
AVERAGE 6952343.955 400594.098 615.383
KNOWN
CO-ORDS 6952343.303 400593.839 614.622
DELTA
CO-ORDS 0.652 0.259 0.761
27 6953734.238 396586.416 608.966 pm40828 08/24/09 12:23:31pm 28 6953733.840 396586.154 609.448 08/24/09 12:23:46pm 29 6953734.385 396586.044 608.469 08/24/09 12:23:57pm 30 6953734.053 396586.196 609.129 08/24/09 12:24:07pm 31 6953734.427 396586.027 608.595 08/24/09 12:24:29pm 32 6953734.418 396586.313 608.578 08/24/09 12:24:41pm
AVERAGE 6953734.227 396586.192 608.864
KNOWN
CO-ORDS 6953734.721 396586.030 608.797
DELTA
[image:48.595.111.562.109.729.2]CO-ORDS -0.494 0.162 0.067
38
As can be seen from the table above, sub meter accuracy was achieved on each Permanent Mark thus verifying that the GPS Survey was sub meter accurate in each dimension. As the expected accuracy of the DEMs created using this data is far less than this, the points located can be used as ground control and verification marks in the DEM extraction process.
An example of the raw data sent by Dr Gibbins can be found in Appendix G.
4.3 Software Testing
4.3.1 RPC Model
As the data supplied was Level1B2G the Rational Polynomial Coefficient model for each image was not supplied in the data. Therefore, following the above methodology, each image was run through the RPC Build function of ENVI using Ground Control Points. The RPC Model was based on 50 Ground Control Points and was considered to have an acceptable Route Mean Squared error under the tolerances set by the software. The RPC data that was stored in the header file is shown in Appendix D.
4.3.2 Preliminary Testing
The preliminary test involved using the ALOS PRISM data with RPC models created without the supplied patch from ITT. Although the results of the initial RPC model looked to have a good RMS and the expected height range in the Build RPC module was acceptable, when the DEM Extraction Wizard was run the scene height ranged from 3.74m to 1687.98m.
39
The DEM that was extracted as a result of the poor results from previous modules had large deviations in height and did not resemble the subject site. It was due to this that the software developers, ITT, were contacted and in return the patch was e-mailed.
4.3.3 Testing with ITT supplied patch
After the patch had been correctly installed and the RPC models computed again the expected height range of the DEM was deemed to be respectable. When the epipolar images were created there appeared to be a 90 degree shift in the data. ITT was contacted and asked if this was due to the way that the co-ordinates had been read into the program. In reply ITT suggested that it was probably not because of a shift in the co-ordinates and more likely to be a function of the imagery itself. Due to time constraints and technical problems the imagery could not be uploaded to ITT‟s FTP site and examined by their technicians. Thus the solution to the 90 degree shift could not be dealt with in this project.
4.3.4. Stereo Pair Testing
The original DEM‟s created by the DEM Extraction module were examined and checked before merging the data. It appeared that the DEM created from a stereo pair did not have enough correlation in the regions of the imagery. It was then decided to follow Terranian‟s suggested method of only using the Backward and Forward imagery discarding the Nadir image.
40
[image:51.595.161.477.180.517.2]As can be seen in Figure 4.1 there was a large gap in the DEM in the south-east region of the scene. This appears to correlate with the other DEM‟s created both Forward Nadir and Backward Nadir. Because of this it appears that ALOS PRISM data does not deal correctly with areas that have large amounts of vegetation present.
41
Figure 4.2 shows the 3D epipolar cursor scanning the surface of the epipolar imagery used to create the DEM. As can be seen the elevation value is negative and almost 200m different to the correct RL that was used to create the RPC Model and DEM.
Figure 4.2 3D Epipolar Cursor for Forward Backward Imagery
4.3.5. Consultation with Industry
42
several trips to Japan to discuss the technical issues that had plagued them with staff from RESTEC and JAXA.
The first issue that Mr. Walker was able to discern was the necessity for an accurate RPC model. To achieve this in industry the RPC data was generally supplied in the Supplemental file. This was another advantage of the lower levels of reduced data.
In the same phone conversation Mr. Walker was interested in what level of ALOS PRISM data was being used, as he believed that this may be having an effect on the successfulness of the experiment. He advised that the data that GeoImage conventionally used was Level 1B1 and therefore in the package that was supplied by RESTEC 6 images corresponding to 6 of the 12 CCD units were supplied. This provided several levels of correlation between the imagery from which the DEM could be extracted that apparently were not available with the higher levels of ALOS PRISM data such as the one that was being used in the experiment. He went on to state that ALOS PRISM data was hard to use and there were several problems encountered when attempting to extract a DEM due to the lack of correlation between the images especially when provided in the Backward, Forward and Nadir format. To overcome this at GeoImage he suggested that the data could be forced to create the DEM by smothering the scene with extrapolated ground control points. To achieve this the images were orthorectified in Socket SET and several hundred points created from each image and these computed points reused in the DEM extraction process to force the imagery into the correct geographical position.
4.2.6. Google Earth Ground Control Point Test
43
The above methodology was followed with over 150 ground control points for both the RPC model and the DEM Extraction Wizard. Though even 80% more GCPs, the resulting DEM did not appear to be greatly influenced and there was still an overwhelming amount of spikes and noise.
Thus it appeared for this technique to work in ENVI one would need hundreds of ground control points over the scene. Generation of such an amount of data that can be used for this purpose was outside of the scope of this project. Future work could focus on GCPs to investigate create a DEM from extrapolated GCPs.
4.2.7. Effects of Cloud Coverage on DEM
44
Figure 4.3Spikes in DEM created by cloud coverage
4.3 Conclusions
The results and discussions shown above illustrate the problematic nature of ALOS PRISM data when trying to extract a DEM from it. Also highlighted are the problems that were found when using ENVI 4.6 to try to achieve the task.
The field survey worked extremely well and achieved the result that it was designed to do in providing excellent ground control points and verification marks for the creation and testing of the DEM.
After several attempts of using the methodology explained in Chapter 3 it has been found that currently a practical DEM cannot be extracted even when some of the ALOS PRISM data is ignored.
Although the RPC models appear to have been created from sufficient amounts of data for an unknown reason when being used with the DEM Extraction Module problems appear to arise.
For an unknown reason the epipolar results were swung by 90° and this was then reproduced in the final extracted DEM.
45
affected by atmospheric elements such as cloud and manipulates the DEM accordingly.
46
Chapter 5
– Conclusion
5.1 Introduction
The previous chapter analyzed the results that were gained from using the methodology as shown in Chapter 3. The testing of this methodology provided mixed results in whether it was possible to derive a high resolution DEM from ALOS PRISM imagery.
Chapter 5 will further discuss the research conducted in this dissertation and investigate the implications that such research has had on photogrammetry and spatial science.
This chapter will also identify oversights that have been identified in the research and testing conducted in this dissertation. Also discussed in this chapter is the future research that would complement this dissertation and that either was not completed due to the scope of this project, time constraints or needs future technological development.
5.2 Future Research
The research conducted in this project provided a basis for spatial scientists in the future to better understand what is required when extracting a high resolution DEM from ALOS PRISM DATA.
47
resulting DEM is greatly affected by the level of ALOS PRISM data that it was extracted from.
Furthermore ENVI 4.6 did not manage the ALOS PRISM imagery as was suggested by the manufacturer. When this deficiency in the software has been rectified there is scope for a future researcher to re-test the methodology outlined in this dissertation and discern if the resulting ALOS PRISM DEMs are of better quality.
As suggested in the above literature review, with the redundancy of the third image creating stereo-triplets, the potential for ALOS PRISM DEMs to be extracted without the use of ground control points is provided. Yet currently the software does not allow for the use of stereo-triplets. If this becomes possible there is scope for future research to be conducted into the efficiency and accuracy of the DEMs extracted without the use of ground control points.
5.3 Oversights in Research
Whilst care was taken in the attempt to include all factors in the successful generation of an ALOS PRISM DEM, due to unforeseen or uncontrollable factors, there were oversights that if time and funding had of permitted should have been included in this project.
Due to the expense and availability of ALOS PRISM imagery, testing of different levels of ALOS PRISM data using the methodology explained in Chapter 3 was not able to be conduct in this project. As there are fundamental differences in the levels of ALOS PRISM imagery the methods for the extraction of a DEM from the data would change depending on the level.
Furthermore this study only deals with mathematically calculated RPC models computed by ENVI 4.6. Had the true RPC data for the imagery been available the accuracy of the calculated RPC model could have been checked against the true RPC values.
48
study proved that atmospheric factors such as cloud cover create large areas of un-useable data on the DEM, if time had of permitted, it would have been frugal to test a set of data with 0% cloud coverage.
5.4 Close
This project aimed to derive a high resolution DEM using ALOS PRISM data using ITT‟s ENVI 4.6 software suite.
The testing conducted has found that due to several different factors, ENVI 4.6 does not cope as well as the manufacturer expected with ALOS PRISM data. Although, throughout each step in the DEM Extraction process, the statistical checks of the data appeared to pass at a satisfactory level when the resulting DEM was analysed there were obvious problems.
49
List of References
Berthier, E & Toutin, T 2008 'SPOT5-HRS digital elevation models and the monitoring of glacier elevation changes in North-West Canada and South-East Alaska' Remote Sensing oif Environment 112. viewed 15 May 2009, ScienceDirect
Bignone, F & Umakawa, H 2008, 'Assessment of ALOS PRISM Digital Elevation Model Extraction over Japan' The International Archives of the Photogrammetry, Remote Sensing and Spatial Information Sciences. Vol XXXVII Part B1 pp1135-1138
DEM Extraction of PRISM Stereo Imagery. (Tutorial) 2007 PCI Geomatics viewed 05/05/2009
<www.pcigeomatics.com/support/tutorials/pdf/dem_extraction_prism.pdf>
DEM Scoping Study. Spatial Analysis Group 2007. USQ. Available on request
Elfick, M, Fryer, J, Brinker, R & Wolf, P 1994, Elementary Surveying, 8th edn, Pearson, Edinburgh Gate, Harlow
Geoimage, 2008 „Advanced Land Observing Satellite‟ viewed 10 May 2009 <http://www.geoimage.com.au>
Gonçalves, J.A 2008, 'Orientation and DEM Extraction from ALOS-PRISM images using the SRTM-DEM as ground control' The International Archives of the
Photogrammetry, Remote Sensing and Spatial Information Sciences. Vol XXXVII Part B1 pp 1177-1182
Gruen, A et al 2007, 'Calibration and validation of early ALOS/PRISM images'
Journal of the Japan Society of Photogrammetry and Remote Sensing pp24-38
Imai, Y et al 2008, 'An Accuracy Assessment of DSMS and Orthoimages derived from ALOS/PRISM and their availability in forestry' The International Archives of the Photogrammetry, Remote Sensing and Spatial Information Sciences. Vol XXXVII Part B8 pp 1021-1026
JAXA, Advanced Land Observing Satellite 2007, Japan Aerospace Exploration Agency, viewed 20 May 2009,
<http://wwww.jaxa.jp/projects/sat/alos/index_e.html>
50 Photogrammetry, Remote Sensing and Spatial Information Sciences. Vol XXXVII Part B1 pp 757-760
Kamiya, I 2007, 'Geometric Characteristics of Early Products of ALOS PRISM'
Buletin of the Geographical Survey Institute. Vol 54, March, pp75-82
Kyaw, S et al 2008, 'Accuracy Evaluation of Digital Surface Model using ALOS PRISM data or disaster monitoring' The International Archives of the
Photogrammetry, Remote Sensing and Spatial Information Sciences. Vol XXXVII Part B4 pp 1383-1388
Rosenqvist, A. et al 2004, 'ALOS PALSAR: Technical outline and mission concepts'
4th International Symposium on Retrieval of Bio- and Geophysical Parameters from SAR Data for Land Applications Innsbruck, Austria, November 16-19
Takaku, J et al 2007, 'High resolution DSM generation from ALOS PRISM, Performance Analysis' Geoscience and Remote Sensing Symposium. pp 1974-1977
51
Appendix A -
Project Specification
University of Southern QueenslandFACULTY OF ENGINEERING AND SURVEYING
ENG 4111/4112 Research Project PROJECT SPECIFICATION
FOR: Andrew Charles CAMPBELL
TOPIC: DERIVING HIGH RESOLUTION DEM FROM ALOS
PRISM DATA
SUPERVISORS: Dr. Badri Basnet Xiaoye Liu
ENROLMENT: ENG 4111 - S1, X, 2009; ENG 4112 - S2, X, 2009
PROJECT AIM: This project aims to develop a process to extract high resolution DEM (Digital Elevation Model) using ENVI and ALOS PRISM Data.
PROGRAMME: Issue A, 19th March 2009
1 Literature review on background of general DEM extraction techniques using ALOS PRISM Data.
2 Familiarise with the techniques of DEM extraction using the ENVI DEM extraction module.
3 Derive high resolution DEM.
4 Produce report on the developed technique.
5 Analyse and compare process with previous techniques of DEM extraction. 6 Validate the DEM using physical ground control marks.
7 Submit report and comparison outlining the developed processes for DEM extraction using the ENVI software package.
As time permits:
Contribute towards a conference publication to be developed by supervisors.
AGREED:
(Student) , (Supervisors)
/ / / / / /
52
53
Appendix C –
Raw ALOS PRISM data
Backward Image
ALOS OPTICAL PROCESSING REPORT
---
Work Order: 05540_01B Priority: Low
Satellite: ALOS Sensor: PRISM
Camera: BACKWARD Sensor Mode: Triplet
Ground Station: HEOC SceneID: ALPSMB048564210
Input Media Type: Archive Data Format: ACRES format
Processing Level: Level1B2G Resampling: CC
Map Projection: UTM Zone: -56
Earth Ellipsoid: WGS84 Elevation Corr: None
Orbit Data: Precision Map Direction: MapNorth
Orbit Number: 04856 Path/Strip No.: 018
Scene Shift: 1 Frame No.: 4210
Pointing Angle: N/A deg Image Lines: 17013
Pixels: 18948 Image Orientation: 0 deg from N
Output Bands: B Pixel size: 2.5 m
Scene Centre Lat: -27.5799630 deg Scene Centre Long: 151.9021587 deg
Sun Elevation: 65.70 deg Sun Azimuth: 86.19 deg
Scene Centre Date: 2006 12 23 Scene Centre Time: 00:04:50.615
Output Media: DVD-R Size: 309 MB
Product Format: CEOS Interleaving: BSQ
Completion date: 20080206 Completion Time: 00:03:41
PGS Release Version:4.04 Product Status: Successful Completion
54
RADIOMETRIC CORRECTION
---
Absolute Calibration Coefficient:
L=O*a+b L:radiances(W/m2/sr/µm)
O:calibrated digital numbers(count)
a:Gain
a:Gain
PRODUCT FORMATTING
---
Product Scene Centre Location (lat/long) : -27.5799630 / 151.9021587
Product Scene Centre Date/Time (yyyy mm dd hh:mm:ss.ss): 2006 12 23 00:04:50.615
55
Nadir Image
ALOS OPTICAL PROCESSING REPORT
---
Work Order: 05540_01N Priority: Low
Satellite: ALOS Sensor: PRISM
Camera: NADIR Sensor Mode: Triplet
Ground Station: HEOC SceneID: ALPSMN048564155
Input Media Type: Archive Data Format: ACRES format
Processing Level: Level1B2G Resampling: CC
Map Projection: UTM Zone: -56
Earth Ellipsoid: WGS84 Elevation Corr: None
Orbit Data: Precision Map Direction: MapNorth
Orbit Number: 04856 Path/Strip No.: 018
Scene Shift: 0 Frame No.: 4155
Pointing Angle: N/A deg Image Lines: 16824
Pixels: 17408 Image Orientation: 0 deg from N
Output Bands: N Pixel size: 2.5 m
Scene Centre Lat: -27.5719140 deg Scene Centre Long: 151.9114856 deg
Sun Elevation: 65.54 deg Sun Azimuth: 86.31 deg
Scene Centre Date: 2006 12 23 Scene Centre Time: 00:04:05.325
Output Media: DVD-R Size: 280 MB
Product Format: CEOS Interleaving: BSQ
Completion date: 20080205 Completion Time: 23:38:43
PGS Release Version:4.04 Product Status: Successful Completion
56
RADIOMETRIC CORRECTION
---
Absolute Calibration Coefficient:
L=O*a+b L:radiances(W/m2/sr/µm)
O:calibrated digital numbers(count)
a:Gain
a:Gain
PRODUCT FORMATTING
---
Product Scene Centre Location (lat/long) : -27.5719140 / 151.9114856
Product Scene Centre Date/Time (yyyy mm dd hh:mm:ss.ss): 2006 12 23 00:04:05.325
57
Forward Image
ALOS OPTICAL PROCESSING REPORT
---
Work Order: 05540_01F Priority: Low
Satellite: ALOS Sensor: PRISM
Camera: FORWARD Sensor Mode: Triplet
Ground Station: HEOC SceneID: ALPSMF048564100
Input Media Type: Archive Data Format: ACRES format
Processing Level: Level1B2G Resampling: CC
Map Projection: UTM Zone: -56
Earth Ellipsoid: WGS84 Elevation Corr: None
Orbit Data: Precision Map Direction: MapNorth
Orbit Number: 04856 Path/Strip No.: 018
Scene Shift: -1 Frame No.: 4100
Pointing Angle: N/A deg Image Lines: 17088
Pixels: 18923 Image Orientation: 0 deg from N
Output Bands: F Pixel size: 2.5 m
Scene Centre Lat: -27.5672497 deg Scene Centre Long: 151.9205788 deg
Sun Elevation: 65.38 deg Sun Azimuth: 86.43 deg
Scene Centre Date: 2006 12 23 Scene Centre Time: 00:03:20.040
Output Media: DVD-R Size: 310 MB
Product Format: CEOS Interleaving: BSQ
Completion date: 20080205 Completion Time: 23:46:50
PGS Release Version:4.04 Product Status: Successful Completion
58
RADIOMETRIC CORRECTION
---
Absolute Calibration Coefficient:
L=O*a+b L:radiances(W/m2/sr/µm)
O:calibrated digital numbers(count)
a:Gain
a:Gain
PRODUCT FORMATTING
---
Product Scene Centre Location (lat/long) : -27.5672497 / 151.9205788
Product Scene Centre Date/Time (yyyy mm dd hh:mm:ss.ss): 2006 12 23 00:03:20.040
59
Example of ACRES ALOS PRISM data Checking Sheet
Nadir Image
ACRES 20 - Dec 2002
ACRES DIGITAL QUALITY ASSESSMENT CHECKLIST
Work Order: [ 05540_01N ] 1. Product Quality
====================================================================== (a) Is Pixel Intensity (gain, offset, mean) in all Bands acceptable? : [ Yes ]
(b) Ephemeris used (LS7/ETM+ only)? : [ N/A ]
(c) Is geometric quality assesment acceptable? : [ Yes ] (N/A) (RMS)
(d) Is positional accuracy acceptable? : [ Yes ] (N/A) (RMS)
(e) Any drop out & sync loss? : [ No ]
(f) Cloud Cover Percentage : [ 8 ] %
======================================================================
2. Product checked against order confirmation and visually checked
======================================================================
Satellite/Sensor : [ ALOS / PRISM ]
Orbit