The relationship between native vegetation and
in-stream salinity: an Australian case study
VINCENT LAWRENCE VERSACE1,
DANIEL IERODIACONOU1, FRANK STAGNITTI1,
ANDREW JOHN HAMILTON1, M. TODD WALTER2 &
MARC LEBLANC3
1 School of Life and Environmental Sciences, Deakin University, PO Box 423, Warrnambool,
Victoria 3280, Australia
2 Department of Biological and Environmental Engineering, Cornell University,
New York 14853-5701, USA
3 School of Geosciences, Monash University, Clayton, Victoria 3800, Australia
Abstract The Glenelg-Hopkins area is a large regional watershed (2.6 million ha) in southwest Victoria that has been extensively cleared for agriculture. In-stream electrical conductivity (EC) in relation to remnant native vegetation is examined from the headwaters to the upper extent of the estuary of the Glenelg River. Five water quality gauging stations were selected. Their contributing subcatchments represent a continuum of disturbance. Proportions of native vegetation ranged from ~100% at the headwaters of the river to ~30% at the furthest downstream gauge station. The relationship between remnant vegetation and in-stream EC was examined using aggregated and non-aggregated land use statistics over a period of 22 years from three land use maps. Increased proportions of native vegetation were significantly negatively correlated with in-stream EC and were consistent across all scenarios investigated.
Key words dryland salinity, GIS, land cover, land degradation, land use, vegetation
INTRODUCTION
Natural salinisation of the Australian landscape throughout the geological record has been documented (Bowler, 1990); however, recent increases in salinisation are largely attributed to human activities. It is now widely accepted that large-scale land clearing to facilitate European style agriculture has promoted the spread of dryland salinity (Jolly et al., 2001). Removal of deep-rooted perennial vegetation and replacement with seasonal crops with a lesser capacity to utilize available rainfall has seen groundwater levels rise. Currently it is estimated that 2.5 million ha of land in Australia is affected by dryland salinity and it is forecast this may increase to around 15 million ha in the next 30–100 years (CSIRO, 2000). As much as 20 000 km of streams could be salt-affected by 2050 (National Land and Water Resources Audit, 2001).
(Van Bueren & Price, 2004). These challenges exist in the most intensely studied areas on the continent; yet Australia also has other agriculturally significant regions from which markedly less data have been collected. It is in these data-poor regions where regional-scale salinity research is arguably in its infancy. The Glenelg Hopkins region in southwest Victoria is an example of this.
This paper will examine in-stream electrical conductivity (EC) in relation to the proportion of native vegetation cover from the headwaters to the upper extent of the estuary of the Glenelg River, the major river in the west of the region.
METHODS
Site description
The Glenelg Hopkins catchment is a regional watershed in southwest Victoria, Australia, covering approximately 2.6 million ha. Less than 20% of the original vegetation remains in the region (GHCMA, 2002). Groundwater flow patterns have been altered following clearing of deep-rooted native vegetation and groundwater extractions (National Land and Water Resources Audit, 2001). It is estimated that 144 500 ha of land is affected by dryland salinisation (National Land and Water Resources Audit, 2001). The Glenelg Hopkins region is considered to be one of the areas most at risk from rising water tables and dryland salinity in the next decade (GHCMA, 2002).
GIS and statistical methods
Surface water data and latitude and longitude coordinates were obtained from the Victorian Water Quality Database. Catchments were delineated following Versace et
al. (2005). The mean proportions of native vegetation were calculated from land use maps for the years 1980, 1995, and 2002 (Ierodiaconou et al., 2005). The mean electrical conductivity was calculated for all available years and years for which data corresponded to land use maps for comparative purposes. Simple linear regression analyses were performed at two spatial scales. Aggregated analyses used the proportion of native vegetation from the entire area upstream of the gauging station. This approach accounts for all upstream land use contributing to water quality at a given gauging station. Non-aggregated analyses only accounted for the proportion of native vegetation in the subcatchment immediately upstream of the gauge station, and did not account for land use beyond the immediate upstream gauge station. Electrical conductivity data were log10-transformed prior to regression analyses. Testing the null hypothesis of no difference in slope between aggregated and non-aggregated analysis was done using the Test for Parallelism (Kleinbaum & Kupper, 1978).
RESULTS
Table 1 Aggregated and non-aggregated land cover statistics by site. Proportion of native vegetation Site code Catchment
area (ha) 1980N
1980A 1995N 1995A 2002N 2002A 238231 5921 0.999 0.999* 0.999 0.999* 0.999 0.999* 238236 129884 0.773 0.783 0.775 0.784 0.777 0.787 238205 1010 0.605 0.782 0.605 0.783 0.605 0.785 238202 282807 0.288 0.432 0.280 0.428 0.279 0.428 238206 199027 0.375 0.315 0.317 0.301 0.303 0.298 N
Non-aggregated land cover statistics A
Aggregated land cover statistics
*Non-aggregated and aggregated statistics identical
Table 2 EC total data availability and data availability corresponding with land use maps. Location (Site code) Year (n) Mean EC available all
years (SE)
Mean EC years with land cover information (SE) 238231 1980–2002 (274) 118 (3) 136 (21)
238236 1992–1997 (107) 507 (7) 480 (10) 238205 1991–2002 (146) 694 (24) 660 (49) 238202 1980–2002 (276) 3663 (99) 3722 (249) 238206 1980–2002 (282) 2644 (66) 2654 (114) n Number of EC observations available between 1980–2002
SE Standard Error
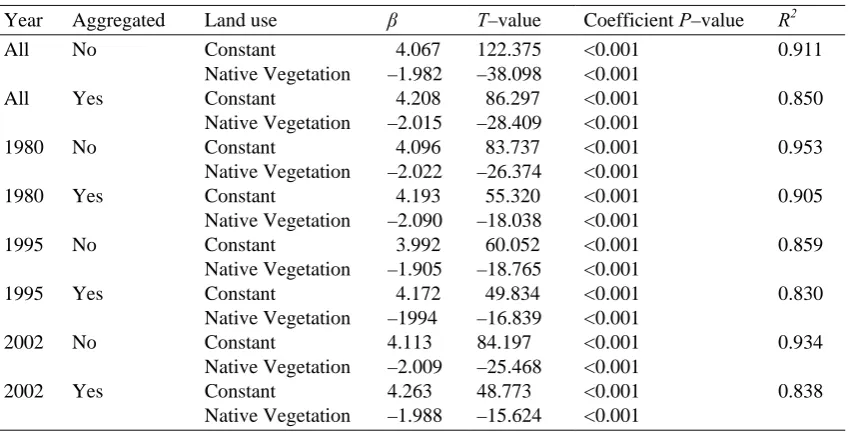
Table 3 Summary of regression analyses.
Year Aggregated Land use β T–value Coefficient P–value R2 All No Constant 4.067 122.375 <0.001 0.911 Native Vegetation –1.982 –38.098 <0.001
All Yes Constant 4.208 86.297 <0.001 0.850 Native Vegetation –2.015 –28.409 <0.001
1980 No Constant 4.096 83.737 <0.001 0.953 Native Vegetation –2.022 –26.374 <0.001
1980 Yes Constant 4.193 55.320 <0.001 0.905 Native Vegetation –2.090 –18.038 <0.001
1995 No Constant 3.992 60.052 <0.001 0.859 Native Vegetation –1.905 –18.765 <0.001
1995 Yes Constant 4.172 49.834 <0.001 0.830 Native Vegetation –1994 –16.839 <0.001
2002 No Constant 4.113 84.197 <0.001 0.934 Native Vegetation –2.009 –25.468 <0.001
2002 Yes Constant 4.263 48.773 <0.001 0.838 Native Vegetation –1.988 –15.624 <0.001
regression analyses are presented in Table 2. Regression analyses showed significant relationships for all combinations of aggregated and non-aggregated land cover statistics examined (Table 3).
DISCUSSION
The results of this study support the concept of elevated salinity following clearance of native vegetation. This widely promoted mechanism has been linked to the region (National Land and Water Resources Audit, 2001); yet other authors remain less convinced of this single mechanism being solely responsible (Nathan, 1999; Dahlhaus, 2002). Dahlhaus et al. (2002) makes the observation that primary salinisation of land and water assets in the region were more prevalent prior to landscape-scale changes than first thought. Logically this implies the geomorphology of the region cannot be ruled out as a substantial contributor to in-stream salinity. Ultimately in-stream salinity is likely a function of historical and prevailing land use, climate, groundwater levels and salt concentration, or complex interactions between these factors. Given the focus on maintaining and restoring deep-rooted perennial vegetation by salinity researchers, and considering the results here, native vegetation may provide an appropriate surrogate measure of these at the catchment scale.
The downstream pattern of vegetation cover observed is loosely consistent with many examples where high relief areas unsuitable for agriculture are left largely unaffected whereas flatter, lowland areas are farmed extensively. Therefore, it may be argued that that the downstream increase of salt may be a cumulative effect. However, the non-aggregated native vegetation statistics indicate greater cover in subcatchment 238206 in comparison to 238202, which also corresponds with significantly lower in-stream salinity. This may be explained by higher rainfall in the south of the region combined with the Lower Glenelg National Park, which comprises a substantial proportion of this subcatchment 238206. This example serves to identify the importance of getting more information to model dryland salinisation at the catchment scale.
In conclusion, a significant relationship between reduced native vegetation and elevated salinity has been shown. As many modern management methods are adaptive and based upon the best available information, a finding of this type should not be ignored. Whilst it would be premature to implement management based upon these findings, they do suggest native vegetation in the region may provide a surrogate measure of other processes, both natural and human-induced. This study has demonstrated the potential of combining existing data sources integrated in a GIS environment to understand regional scale dryland salinisation.
REFERENCES
Bowler, J. M. (1990) The last 500 000 years. In: In the Murray (ed. by N. Mackay & D. Eastburn), 95–110. Murray-Darling Basin Commission, Canberra, Australian Capital Territory, Australia.
CSIRO (2000) Management of Dryland Salinity: Future Strategic Directions in the Context of Developing a National
Policy for Natural Resource Management. CSIRO Publishing, Collingwood, Victoria, Australia.
Dahlhaus, P., Heislers, D. & Dyson, P. (2002) Groundwater flow systems of the Glenelg Hopkins Catchment Management Authority region. Glenelg Hopkins Catchment Management Authority, Report No. 02/02.
Dawes, W. R., Gilfedder, M., Stauffacher, M., Coram, J., Hajkowicz, S., Walker, G. R. & Young, M. (2002) Assessing the viability of recharge reduction for dryland salinity control: Wanilla, Eyre Peninsula. Aust. J. Soil Res. 40, 1407–1424.
Glenelg Hopkins Catchment Management Authority (2002) Salinity Plan. Glenelg Hopkins Catchment Management Authority, Hamilton, Victoria, Australia.
Ierodiaconou, D., Laurenson, L., Leblanc, M., Stagnitti, F., Duff, G., Salzman, S. & Versace, V. (2005) Consequences of land use change on nutrient exports: A regional scale assessment in south-west Victoria, Australia. J. Environ.
Manage. 74(4), 305–316.
Jolly, I. D., Williamson, D. R., Gilfedder, M., Walker, G. R., Morton, R., Robinson, G., Jones, H., Zhang, L., Dowling, T. I., Dyce, P., Nathan, R. J., Nandakumar, N., Clarke, R. & McNeill, V. (2001) Historical stream salinity trends and catchment salt balances in the Murray-Darling Basin, Australia. Mar. Freshw. Res.52, 53–63.
Kleinbaum, D. G. & Kupper, L. L. (1978) Applied Regression Analysis and Other Multivariate Methods. Duxbury Press, North Scituate, Massachusetts, USA.
Nathan, E. (1999) Dryland salinity on the Dundas Tableland: a historical appraisal. Aust. Geogr. 30(3), 295–310.
National Land and Water resources Audit (2001) Australian Dryland Salinity Assessment 2000: extent, impacts, processes, monitoring and management options. Land and Water Australia, Canberra, Australian Capital Territory, Australia. Versace, V., Ierodiaconou, D., Stagnitti, F., Leblanc, M., March, T. & Salzman, S. (2005) Multivariate modelling of the
influence of land use on in-stream salinity over multiple spatial scales. In: Water Resources Management III (ed. by M. De Conceicao Cunha & C. A. Brebbia), 299–309. WIT Press, Ashurst, Southampton, UK.