Effects of blasting on the stability of paste fill stopes at Cannington Mine
40
0
0
Full text
(2) Chapter 4 - Field Instrumentation Tests. 4. Field Instrumentation Tests The monitoring of production blasts discussed in Chapter 3 was useful to obtain information on how blast waves travel from a blast hole through the rock and into the paste fill. However, in order to obtain a relationship that describes the travel of a wave through paste fill, it was necessary to record the transmission of a blast wave originating within the paste fill. Therefore, field instrumentation tests which involved detonating blast holes within paste fill was conducted at Cannington Mine. These field instrumentation tests are discussed in the following chapter.. 4.1. Introduction A blast monitoring exercise was conducted at Cannington Mine on the lih and 13th of September, 2002. The field instrumentation tests were conducted with the help of Mr. Dale Luke from Cannington Mine and Mr. John Heilig, a consulting engineer from Heilig and Partners. In this exercise, two geophones were used to measure velocity waveforms produced by a series of explosions. The tests were carried out in stope 4261, which has previously been mined and backfilled with paste. The purpose of this exercise was to obtain a representative waveform caused by the detonation of a single explosive. This waveform was used to develop a blast loading function for use in the numerical models, as described in Chapter 6. Another aim of this exercise was to observe the response of the paste to the explosives. Nine separate blasts were monitored by two geophones, one of which was situated in the rock, while the other was situated in the paste fill.. 4.2. Location ofthe Blast Holes and Geophones The field instrumentation tests were conducted in stope 4261, at the 400 m level. Ten blast holes with a diameter of 44 mm and a length of approximately 3 m were drilled into the wall of the tunnel leading into the paste fill stope, as shown in Figure 4.1. The orientation of each blast hole is shown in Figure 4.1 and the chainage at which each blast hole was drilled is listed in Table 4.1. Two geophones were installed into this wall, one geophone installed in paste fill, and the other geophone installed in rock, approximately 1 m beyond the paste fill/rock interface. The blast holes were loaded with Orica 200 mm by 32 mm powergel plugs. Each powergel plug was initiated separately using a detonation cord. The geophones were connected to a Blastronics BMX blast monitor that was used to record the velocity waveforms resulting from each blast. As each blast hole was fired individually, a separate waveform was recorded for each blast. The position of each blast hole was measured prior to the blasting exercise, and the depth of each blast hole was measured. This information was used to calculate the distance from the. 53.
(3) Chapter 4 - Field Instrumentation Tests centre of each explosive to each geophone. These distances and the depth of the blast holes are listed in Table 4.1. The explosives are labelled by the name of the waveform file that recorded the detonation of that explosive, and the chainage at which the hole was drilled. The chainage was measured from the entrance of the tunnel. The explosives were fired in the order they are listed in Table 4.1.. Rock ,,. , ,,. ~'. ,. Chainage 0 m. Not to Scale. Figure 4.1 - Plan View ofBlast Holes and Geophones within Stope 4261. 54.
(4) Chapter 4 - Field Instrumentation Tests Table 4.1 Distance Between Explosives and Geophones Chainage. Waveform File. Blast Hole. Distance from. Distance from. (m). Name. Length (m). Geophone 1 (m). Geophone 2 (m). 25. Cann#1. 1.97. 3.48. 17.27. 23. Cann#2. 2.45. 1.96. 15.55. 11. Cann#3. 3.20. 10.96. 3.66. 13. Cann#4. 3.37. 8.19. 5.97. 15. Cann#5. 3.30. 6.25. 7.90. 17. Cann#6. 3.15. 4.11. 10.02. 19. Cann#7. 3.25. 2.12. 12.26. 20. Cann#8. 3.34. 1.56. 13.15. 21. Cann#9. 2.69. 0.95. 13.84. 4.3. Type ofExplosive Used in the Test Cartridges of the emulsion explosive Powergel Powerfrag supplied by Orica were used for the field instrumentation tests.. The high strength, water resistant packaged explosive has the. properties listed in Table 4.2. Powergel Powerfrag is initiated through the use of a detonator and is designed for priming applications and as a medium density column explosive in mining and general blasting work. The explosive is suitable for use in blast holes of any depth, as long as the depth of any water in any holes does not exceed 20 m.. Table 4.2 Properties of Explosive Used in Field Instrumentation Tests Diameter (mm). Nominal Length. Density (g/cnr'). (mm). Nominal Mass. Typical. (g). Velocity of Detonation (km/s). 32. 200. 1.18. 170. 4.0. 55.
(5) Chapter 4 - Field Instrumentation Tests. 4.4.. Test Methodology. The following methodology was used for the field instrumentation tests: 1. A tunnel was excavated two-thirds ofthe way through the paste fill stope 4621 at the 400 m level. This was at the mid-height ofthe stope. 2. A total of 12 boreholes of 44 mm diameter were drilled into wall of tunnel. One of these boreholes was drilled into the rock, while the remaining 11 boreholes were drilled into the paste fill. These boreholes had an average depth of 2 to 3.5 m. Two of these boreholes were to be used for the installation of geophones and the remaining 10 were intended for use as blast holes. However, one hole became blocked and could not be used as a blast hole. 3. A triaxial geophone was installed into the borehole in the rock and another triaxial geophone was installed into one of the boreholes in the paste fill. The geophone installed in the paste fill was also used for the monitoring discussed in Chapter 3. Geophone 1 was located in the paste fill, while geophone 2 was located in the rock. Geophone 2 was approximately 1 m from the paste fill/rock interface. 4. The position and alignment of each borehole and the geophones were measured to ensure that the distance between each explosive and geophone could be accurately determined. 5. The boreholes that the geophones were installed in were backfilled with a cemented mixture. 6. On the day of the field instrumentation tests, each of the boreholes was cleared of debris. At this point, one borehole was found to be blocked and therefore unusable. 7. The geophones were tested and prepared for use. 8. Each of the 9 usable boreholes was loaded with one cartride of Powergel Powerfrag emulsion explosive supplied by Orica, and each explosive cartridge was connected to detonation cord. 9. The depth of each borehole from the tunnel wall to the location of the explosive was measured to find the position of each explosive cartridge. 10. "Before" photographs were taken of each borehole that had been loaded with explosive. 11. A blastronics BMX blast monitor, supplied by Mr John Heilig, was set up, connected to each geophone and prepared to record the first explosive blast. The velocities measured by each geophone were monitored by the blastronics BMX blast monitor, and, once a trigger value was reached the monitor recorded the data from the geophone. The trigger values were based on the velocities detected by the geophones prior to each blast and were therefore re-set prior to each blast.. 56.
(6) Chapter 4 - Field Instrumentation Tests 12. The first explosive cartridge, "Cann#I" was wired ready to fire and fired once all personnel had cleared the area. 13. Once the dust had settled in the area, an "after" photograph was taken of the first borehole, however due to the lack of visible damage to the walls, it was decided that "after" photographs would not be taken of the remaining boreholes. The lack of damage apparent of the wall of the tunnel was due to the use of only one cartridge in each blast hole. It was necessary to use such a small amount of explosive to ensure that the tunnel walls did not become unstable during the field instrumentation tests as this would have been unsafe for the people entering the tunnel during and after the tests. A much larger amount of explosive is generally used in each blast hole when blasting in rock. 14. The BMX blast monitor was checked to ensure that it had recorded a waveform and set up to record the next shot while the next explosive was wired ready to fire. 15. The next shot was fired once the area was clear. 16. Steps 14 and 15 were repeated until all shots were fired. 17. At the completion of the field tests, the measured waveforms were checked by Mr John Heilig to ensure that realistic results had been obtained. The waveforms recorded by the BMX blast monitor were converted from the Blastronics software format to Microsoft Excel format in order to allow analysis ofthe results.. 4.5.. Collected Data. A set of three velocity waveforms was measured at each geophone during each explosive blast of the field instrumentation tests. These waveforms represent the velocity at the geophone in three mutually perpendicular directions.. Velocity waveforms were not recorded at either. geophone during the detonation of the explosive in borehole Cann#2 and geophone 1 did not record a velocity waveform during the detonation of the explosive in borehole Cann#4. This was due to the trigger value set for these geophones for these blasts being observed prior to the blast occurring. Velocity waveforms were recorded at both geophones during the detonation of all other explosives. The data was converted from the format used by the Blastronics software of the BMX blast monitor to Microsoft Excel format to allow analysis ofthe data. The three waveforms recorded at geophone G1 for one explosive blast (Cann#l) is given in Figure 4.2.. 57.
(7) Chapter 4 - Field Instrumentation Tests. 4.6. Analysis ofResults 4.6.1.. Calculation of Peak Particle Velocity. Each geophone recorded velocity waveforms for the radial, transverse and vertical directions. These velocities are the particle velocities experienced in mutually perpendicular directions at the location of the geophone. In order to calculate the peak particle velocity, the magnitude of the resultant velocity was calculated using the following formula:. V. where. V. =. 2. V radial. 2. 2. + V transverse + V vertical. (4.1). is the magnitude ofthe resultant particle velocity. V radial' Vtransverse. and. V vertical. are the particle velocities in the radial, transverse. and vertical directions respectively The magnitude of the resultant velocity was calculated for each time step in order to obtain a resultant velocity magnitude waveform. The peak particle velocity, which is the maximum resultant velocity magnitude experienced due to the blast, could then be observed from the resultant velocity magnitude waveform. The values of peak particle velocity obtained from the resultant velocity waveforms were used for the analysis of the field instrumentation test data. The waveforms recorded at geophone 1 during the detonation of the explosive in borehole Cann#l is given in Figure 4.2 along with the resultant velocity magnitude waveform. The waveforms recorded at each geophone for each blast are given in Appendix D.. 4.6.2.. Equation for Predicting Peak Particle Velocity in Paste Fill. The peak particle velocities measured at Geophone 1 were used to determine the constants of the equation used to predict peak particle velocities in paste fill. The mechanics of what happens in the material surrounding a borehole when an explosive detonates is discussed in detail in Section 6.2. The detonation of an explosive charge in a borehole produces an initial shock wave in the surrounding material. This shock wave quickly decays into a stress wave. If the pressure of the initial shock wave is greater than the strength of the material, crushing of the material will occur as discussed in Section 6.2. As the wave moves out from the borehole, the pressure decreases and the wave becomes an elastic compressive wave known as a p-wave. The different types of waves are discussed in section 2.3.3. The wave strength in this region can be expressed in terms of the peak particle velocity (Holmberg and Persson, 1979). The peak particle velocity can be predicted by equation 2.3.. 58.
(8) Chapter 4 - Field Instrumentation Tests. Radial Direction 30. f\. ~. 20 .2 Iii' 10 (1)_ > E 0 ~ .5.- 10 ~ -20. a.. /\. f. ! \ .r.. J. \f v. (. \/. ). F\. v. ~. -~. --.. ~. '". -30. o. 0.02. 0.04. 0.06. 0.08. 0.1. 0.08. 0.1. 0.08. 0.1. Time (ms). Transverse Direction 30. .a-. /1. 20. ·u. I J. 0_10. Ci).!!!. >. E. .~. --10. ~ E. 1:: ~. 0. r,. I \ J"l.--... v. I V~. -20. V. -30. /\ ~. '---J. ~. --....-. f. o. 0.02. 0.04. 0.06 Time (ms). Vertical Direction. 60. .a-. ·uo. _. 40 20. Ci).!!!. >. E. (\. -20. ~. -40. 1::. ~I. f\. 0. ~ E .~ -. f\ <:>. \) V. ~. f. \J. \I. -60. o. 0.02. 0.04. 0.06 Time (ms). Magnitude of Resultant Velocity. 50 ,..--. .a-. -. -. -. -. -. -. -. -. -. -. -. -. -. -. -. -. -. -. -. -. -. ---,. 40. +--~_h____rc_------------------I. .!!! 30. + - -HI-'-b+---+-t- + - - - - - - - - - - - - - - - - -- I. ·u. 0_. Ci). > E. ~ E 20 +---F----\t---tt----+~-----------------I U. 1:: ~. -. 10 0 ~L---------r--~~~.:........:~:......::=~~~==~==~"""""==1. o. 0.02. 0.04. 0.06 Time (ms). 0.08. 0.1. Blast 1, Geophone G1. Figure 4.2 -Waveforms Recorded at Geophone G1 for Blast Cann#1 and the Velocity Magnitude for this Blast. 59.
(9) Chapter 4 - Field Instrumentation Tests For blast waves in rock, 700, a. =. 0.7 and. ~ =. ~. is often approximately equal to 2a, for example, for hard bedrock k =. 1.5 if W, Rand ppv are measured in the units given with equation 2.3. (Holmberg and Persson, 1979). If it is assumed that. ~ =. 2a, equation 2.3 reduces to the. following:. (4.2). Taking the logarithm of each side of equation 4.2 produces the following relationship:. JW. logppv = logk + f3logR. (4.3). The logarithm of the peak particle velocity measured at geophone 1 during each blast was plotted against the logarithm of the term ~. JW R. as shown in Figure 4.3 to obtain values ofk and. for paste fill.. The line of best fit was calculated, and had the following relationship:. JW. logppv = 3.00+ 1.02logR. (4.4). 60.
(10) Chapter 4 - Field Instrumentation Tests. 3 ,------. 2.5. -. -. -. -. -. -. -. -. -. -. -. -. -. -. -. -. -. -. -. -. -. -. -. -. -. -. -. -. -. -----,. +------------------------c-----=-~-=-----L------_____i. .......= - - - - - - - - - - - - - - - - - - - -_____i. 2 +-----------~. ~ ~ 1.5 ..2. 0.5 +--. -. -. -. -. -. -. -. -. -. -. -. -. -. -. -. -. -. -. -. -. -. -. -. -. -. -. -. -. -. _____i. O +--. -. -. ,------. -. -. -,------. -. -. -,------. -. -. -,------. -. -. -,-----. -. -. -,-----. -. -. -,-----. -. _____i. -1.6. -1.4. -1.2. -1. -0.8. -0.6. -0.4. o. -0.2. log (W1/2/ R). Figure 4.3 - Peak Particle Velocity in Paste Fill The values of k and ~ calculated from equation 4.4 were k = 1000 and b = 1.02, which produces the following peak particle velocity equation for paste fill:. JW J1.02. ppv= 1000( ;. (4.5). Equation 4.5 is valid when the entire wave propagation is within paste fill. The following items must be considered when estimating the peak particle velocity in paste fill from a blast in rock: •. The peak particle velocity equation for paste fill (Equation 4.5). •. The peak particle velocity equation for Cannington Mine Rock previously calculated by Sartor (1999). •. The percentage of the blast wave observed to cross the rock/paste fill boundary (section 3.7.3). A proposed method to estimate the peak particle velocity in paste fill from a blast in rock is shown in section 4.6.4. A similar method was used in section 4.6.3 to assess the effect of the paste fill/rock interface on the transmission ofthe blast wave.. 61.
(11) Chapter 4 - Field Instrumentation Tests. 4.6.3.. Effect of the Paste Fill/Rock Interface. The peak particle velocities measured at Geophone 2 were used. in. conjunction with the. constants calculated for equation 4.2 to examine the effect of the paste fill to rock interface on the transmission of the wave generated from the explosion. Geophone 2 was located in the rock, approximately 1 m from the paste fill/rock interface. The methodology presented in the following steps was used for this analysis. The calculations for the blast wave from Cann#l are given as an example below. 1. The peak particle velocity in the paste fill at the interface was estimated using equation 4.5. 2. The peak particle velocities measured at Geophone 2 were used to calculate the equivalent distance between the geophone and an explosive source that would give the same peak particle velocity if the explosive and the geophone had both been located in rock. Equation 2.3 was used for this calculation, along with values of the constants k and. ~. calculated for Cannington Mine Rock by Sartor (1999).. constants are k = 2938 and. ~. The values of the. = 1.32.. 3. The equivalent distance from an explosive source in rock to the interface was calculated based on the equivalent distances calculated in Step 2 and the fact that geophone 2 was located in the rock 1 m from the paste fill/rock interface. 4. The peak particle velocity in the rock at the interface was estimated using equation 4.2 and the constants for Cannington Mine rock reported by Sartor (1999). 5. The percentage of the wave which was refracted through the interface into the rock was calculated. An example calculation is given below:. Example 4.1 Calculation ofthe effect ofinterface on blast Cann#l Step 1 R = distancefrom blast to pastefill/rock interface = 16.3 m W= 0.17 kg Peak particle velocity in the pastefill at the interface is:. v= PP =. lOOO[ JQ.17J1.02 16.3. 23.1 mm/ s. 62.
(12) Chapter 4 - Field Instrumentation Tests Step 2 At Geophone 2,ppv = 0.93 mm/s, W= 0.17 kg. 0.93. ~ 298{ ~ J". r;:-;-;:;( 2938 )X32 R = '\/0.17 - 0.93 =. 185 m. Where R = the equivalent distance between explosive source and geophone G2. ~f. the blast had occurred in rock. Step 3 The equivalent distance between explosive source and geophone G2. ~f. the blast. had occurred in rock = 185 m The distancefrom geophone G2 to the pastefill/rock interface = 1 m Therefore, the equivalent distance between the explosive source and the location of the interface = 184 m Step 4 The peak particle velocity in the rock at the interface is estimated asfollows:. v = 2938(..f0I7J1.32. PP. 184. = 0.94 mm/ s Step 5 ppv on pastefill side ofinterface = 23.1 mm/s ppv on rock side ofinterface = 0.94 mm/s Therefore, the percentage ofwave which refracted through the interface. = 0.94 x 100% 23.1 =4.0% The results of the analysis are given in Table 4.3. The analysis indicated that between 4 % and 10 % ofthe wave was refracted through the interface into the rock, while the remaining 90 % of the wave was reflected back into the paste fill. The tendency of the paste fill/interface to reflect the majority of the pressure wave back into the paste fill indicates that once a pressure wave enters a paste fill stope, it will be transmitted back and forth within the stope until the wave attenuates. This result agrees with observations made during the blast monitoring discussed in Chapter 3 where it was observed that once the wave entered the paste fill, it seemed to bounce around within the paste fill and take a long time to leave the material.. 63.
(13) Chapter 4 - Field Instrumentation Tests Table 4.3 Effect of Paste Fill/Rock Interface on Transmission of p-Wave. Distance. Equivalent. Equivalent. Distance. ppvon. Distance:. Distance:. Percent of Percent of. Pressure. from. ppv. from. Paste Fill. Explosive to. Explosive to. ppvon. Pressure. Wave. Explosive to. measured at. Explosive to. side of. Geophone,. Interface,. Rock side of. Wave. Reflected. Blast. Geophone 2. Geophone 2. Interface. Interface. both in Rock. both in Rock. Interface. Refracted. into Paste. Number. (m). (mm/s). (m). (mm/s). (m). (m). (mm/s). into Rock. Fill. Cann#l. 17.27. 0.93. 16.27. 23.14. 184.6. 183.6. 0.94. 4.1 %. 95.9 %. Cann#3. 3.66. 10.77. 2.66. 147.82. 28.9. 27.9. 11.28. 7.6%. 92.4%. Cann#4. 5.97. 3.99. 4.97. 77.85. 61.2. 60.2. 4.08. 5.2 %. 94.8 %. Cann#5. 7.90. 3.72. 6.90. 55.65. 64.6. 63.6. 3.80. 6.8 %. 93.2 %. Cann#6. 10.02. 4.13. 9.02. 42.34. 59.7. 58.7. 4.22. 10.0 %. 90.0%. Cann#7. 12.26. 2.78. 11.26. 33.74. 80.6. 79.6. 2.82. 8.4 %. 91.6 %. Cann#8. 13.15. 2.19. 12.15. 31.19. 96.4. 95.4. 2.22. 7.1 %. 92.9%. Cann#9. 13.84. 1.06. 12.84. 29.48. 167.7. 166.7. 1.06. 3.6 %. 96.4 %. 64.
(14) Chapter 4 - Field Instrumentation Tests. 4.6.4.. Predicting ppv in Paste Fill from Blast in Adjacent Rock. The following steps can be used to predict the peak particle velocity in paste fill resulting from a blast in rock: 1. Estimate the peak particle velocity in the rock at the rock/paste fill interface using equation 4.2 and the constants k and. ~. calculated for Cannington Mine rock by Sartor. (1999). The values ofthe constants are k = 2938 and ~ = 1.32.. JW W ppvint = 2938 R [. where. mt. J1.32 .. ppvint is the peak particle velocity in the rock at the rock/paste fill interface (mm/s). R int is the distance from the explosive source to the rock/paste fill interface (m) 2. Estimate the peak particle velocity in the paste fill at the rock/paste fill interface assuming that between 50 % and 90 % of the amplitude of the blast wave will be refracted from the rock into the paste fill as occurred in the production blasts that were monitored at Cannington Mine (refer to section 3.7.3).. ppV paste int = 0.5 PPV int where. ppv paste int is the peak particle velocity in the paste fill at the rock/paste fill interface (mm/s). 3. Calculate the equivalent distance between the interface and an explosive source that would give the same peak particle velocity in the paste fill at the location of the interface if the explosive and the geophone had both been located in paste fill. This concept is shown in Figure 4.4.. R paste int. =. 1000 JX.02 JW [ ---ppv paste int. where. Rpaste int. is the equivalent distance between an explosive source in paste. fill and the interface (m). 65.
(15) Chapter 4 - Field Instrumentation Tests. Paste fill. Rock. ~I. t::,. I~intge. Rint. Paste fill. I. t. 1 1 1 1 1 1. :t::,. :. I>. 1. I:aste~t! I~geo! 0(. Rint. 1 1 1 1 1. R paste ~eo - - - - - - -. 1. Rock/paste fill interface Blast in rock adjacent to paste fill. Equivalent distances if the blast had been located in. Figure 4.4 - Equivalent Distances for Blast in Rock Adjacent to Paste Fill 4. Calculate the equivalent distance between the geophone and an explosive source that would give the same peak particle velocity in the paste fill at the location of the geophone if the explosive and the geophone had both been located in paste fill.. R paste geo. where. =. R paste in!. + R in! geo. is the equivalent distance between an explosive source in paste. R paste geo. fill and the geophone (m) R in! geo. is the distance between the rock/paste fill interface and the geophone (m). 5. Estimate the peak particle velocity in paste fill using equation 4.5 and. ppv paste = 1000(. where. Rpaste geo .. JW J1.02 R paste geo. ppv paste is the peak particle velocity in the paste fill due to the blast in the rock (mm/s). An example calculation is given below:. Example 4.2 Estimation ofppv in paste fill due to blast in nearby rock Problem: 2Q kg of explosive is detonated in rock 5 m from a rock/paste fill interface. Estimate the peak particle velocity measured at a geophone located 2 m beyond the. 66.
(16) Chapter 4 - Field Instrumentation Tests rock/paste fill interface.. Calculation: W= 20 kg, R int = 5 m, R int geo = 2 m Step 1. J20 J1.32. PPV int = 2938 [-5=. 2535 mml s. Step 2. PPV paste int = 0.5 X 2535 =. 1267 mml s. Step 3. r;:::;;( 1000 )X.02 R paste mt . ='\/201267 =3.5 m Step 4. R paste geo = R paste int + R int geo =. 3.5 + 2. =5.5 m Step 5. J20 J1.02. PPV paste = 1000 [55 =. 803 mml s. Therefore, a peak particle velocity of approximately 800 mm/s would be expected at the geophone.. 4.6.5.. Damage to Paste Fill During Field Instrumentation Tests. During the field instrumentation tests, "before" photographs were taken of the tunnel wall at each borehole location and an "after" photograph was taken of borehole Cann#l.. "After". photographs were not taken of the remaining boreholes as there was no visible damage to the tunnel walls. This is due to the use of a single cartridge of explosive in each borehole. The boreholes were all between 2 and 3 m deep.. Using equation 4.2, the peak particle velocity. predicted 2 m from the explosion of a single 170 g cartridge of explosive is 198 mm/s. This is much less than the 2.5 to 3.5 mls required in order to cause damage to paste fill observed in the field monitoring discussed in Chapter 3.. 67.
(17) Chapter 4 - Field Instrumentation Tests The maximum peak particle velocity observed during the field instrumentation tests was 335 mm/s. This was recorded at geophone 1 during the explosion of borehole Cann#9 which was located 0.95 m from the geophone. Based on these results and the lack of visible damage, it is expected that the paste fill was only damaged in the immediate vicinity of the explosive material.. 4.6.6.. Fourier Analysis of Data. The fast Fourier transform of each waveform was calculated in order to analyse the frequency content of the waveforms, using the method presented in section 3.6.5. The analysis showed that the maximum frequencies contributing to a waveform generally decreased with distance. This indicates that the higher frequencies are attenuated prior to lower frequencies from a blast wave. The results ofthe analysis are given in Table 4.4.. 4. 7.. Summary. A set of field instrumentation tests were conducted on stope 4261, a paste fill stope at Cannington Mine. These tests involved the installation of two geophones, one in paste fill and one in rock, to measure velocities during the detonation of 9 boreholes. The boreholes were all located in the paste fill and each borehole was loaded with one cartridge of the emulsion explosive Powergel Powerfrag. The following observations were made as a result ofthese field instrumentation tests: 1. The peak particle velocity can be predicted through the use of equation 4.2. constants for this equation were measured to be k = 1000 and. ~. The. = 1.02 for paste fill at. Cannington Mine. For rock, k = 2938 and ~ = 1.32 as reported by Sartor (1999). 2. Approximately 90 % of the blast wave is reflected back into the paste fill at the paste fill/rock interface. 3. Damage to the paste fill was not visible at the tunnel wall due to the small mass of explosives used in the field tests. The lack of damage apparent ofthe wall ofthe tunnel was due to the use of only one cartridge in each blast hole. It was necessary to use such a small amount of explosive to ensure that the tunnel walls did not become unstable during the field instrumentation tests as this would have been unsafe for the people entering the tunnel during and after the tests. Despite the small volume of explosive used in these tests there was still sufficient data to meet the aims of the field instrumentation tests.. 68.
(18) Chapter 4 - Field Instrumentation Tests Table 4.4 Results of Fourier Analysis Geophone 1 Maximum Frequency (Hz) Distance from. 1. Geophone 2 Maximum Frequency (Hz) Distance from. Borehole. Geophone 1 (m). Radial. Transverse. Vertical. Geophone 2 (m). Radial. Transverse. Vertical. Cann#1. 3.48. 550. 650. 660. 17.27. 140. 220. 200. Cann#3. 10.96. 720. 670. 580. 3.66. 1090. 870. 1330. Cann#4. 8.19. N/A1. N/A. N/A. 5.97. 640. 730. 1270. Cann#5. 6.25. 720. 720. 2050. 7.90. 600. 560. 570. Cann#6. 4.11. 1640. 1330. 2200. 10.02. 500. 550. 500. Cann#7. 2.12. 2110. 2090. 2200. 12.26. 340. 430. 540. Cann#8. 1.56. 1700. 2100. 2110. 13.15. 360. 360. 400. Cann#9. 0.95. 2240. 2120. 2490. 13.84. 290. 240. 280. The blast monitor did not record a useable signal at geophone I for blast Cann#4. 69.
(19) Chapter 4 - Field Instrumentation Tests. 4. Higher frequencies attenuate faster than lower frequencies during the transmission of the blast wave.. 70.
(20) Chapter 5 - The Study of Blast Attenuation in Paste Fill using Laboratory Tests. 5. The Study of Blast Attenuation in Paste Fill using Laboratory Tests A set of laboratory tests was conducted to study the attenuation of a longitudinal wave travelling through a column of paste fill. These tests are discussed in this chapter.. 5.1.. General. Work on determining the strength parameters of Cannington Mine paste fill has shown that the strength of paste fill changes with curing age, and the cement and solids content of the fill (Rankine, 2004).. Since the strength of the material changes, it was decided to see if the. attenuation of waves travelling in paste fill would show similar changes with curing age and paste fill mix. Therefore, a set of laboratory tests were conducted to study the transmissions of longitudinal waves through a column of paste fill. The aims ofthis experiment were to: •. Measure the attenuation of a longitudinal wave travelling through a column of paste fill;. •. Study the effects of cement content on the attenuation of a longitudinal wave in paste fill;. •. Study the effects of solids content on the attenuation of a longitudinal wave in paste fill; and. •. Study the effects of curing age on the attenuation of a longitudinal wave in paste fill.. This experiment involved measuring the transmission of a longitudinal wave in a column of paste fill using accelerometers. The paste fill was cured in 2.7 metre lengths of pvc pipe, and accelerometers were placed at several locations along the column. The wave was induced in the column by a hammer strike to the end of the column.. 5.2. Seismic Attenuation and Dispersion Attenuation is the weakening of a stress wave as it travels through a medium. It occurs due to two main mechanisms, geometric spreading and energy loss. Geometric attenuation occurs when waves are radiated from a source such as an explosive blast. When waves radiate from a source, the energy of the wave is spread over the area of the wave front, which increases with distance from the source. The energy per unit area therefore decreases as the distance from the wave source increases. The amplitude of the wave is proportional to the square root of energy per unit area, and hence the amplitude decreases with distance from the source (Sharma, 1997). Geometric attenuation can be expressed as:. 71.
(21) Chapter 5 - The Study of Blast Attenuation in Paste Fill using Laboratory Tests (5.1). where A = Amplitude (m/s) A o = initial amplitude where r = Om (m/s) r = pulse travel distance (m) K. Values of. K. = geometric attenuation exponent.. depend on the type of waves, where. K. is 0 for plane waves, 0.5 for cylindrical. waves, and 1.0 for spherical waves. Other energy losses also occur, in the form of frictional dissipation of the elastic energy into heat. These losses are known as internal friction and can be expressed as shown in equation 5.2. The frequency of the wave affects the attenuation characteristics, with higher frequencies attenuating more rapidly than low frequencies, as the energy loss in higher frequencies is more rapid. The combined effect of both methods of attenuation is given by the relationship given in equation 5.3.. (5.2) where f= frequency c = wave velocity Q = quality factor. (5.3). where a = attenuation coefficient Attenuation is commonly measured using the rock quality factor, Q, which is defined by the following relationship:. a= if Qv. (5.4). The quality factor can found using the rise time relation, as follows:. 72.
(22) Chapter 5 - The Study of Blast Attenuation in Paste Fill using Laboratory Tests Q=Q. o. where. + Ct. Q. (5.5). n = the pulse rise time (s). no = the initial pulse rise time at t = 0 (s) t = the time of pulse propagation (s) C = constant, experimentally estimated to be 0.53 ± 0.04. 5.3. Apparatus The apparatus used for the laboratory experiment is described in the following section.. 5.3.1.. General. The laboratory tests were conducted in two stages. The first stage consisted of a preliminary test to measure the waves that can be induced in a column of paste fill with a hammer strike and to determine the most appropriate instrumentation to use to measure the wave. The preliminary test was also used to determine whether or not accelerometers could be recovered from the column on completion of the test. The preliminary test was conducted on paste fill set in a 2.5 m long column which had two accelerometers installed in the column. The accelerometers were connected to an oscilloscope to measure the waveforms produced during the test. On the completion of the preliminary test, a measuring device was purchased to enable the use of 4 accelerometers in each column in the full test stage of tests. The paste fill was poured in columns that were 2.7 m long and had 4 accelerometers installed in the column. In both stages of the laboratory tests, a steel plate was attached to the paste fill at the end of the column to ensure that the load was applied evenly across the paste fill and to protect the paste fill from damage from repeated hammer strikes to the same spot. Waves were induced in the column with a hammer strike. The apparatus for the experiment consisted ofthe following items: •. Accelerometers;. •. Short lengths of 100 mm diameter pvc pipe. These pipe sections were between 0.5 and 0.7 m long;. •. 4 pipe joiners for each column;. 73.
(23) Chapter 5 - The Study of Blast Attenuation in Paste Fill using Laboratory Tests •. An end cap for each column;. •. Two steel plates for each column;. •. An oscilloscope for the preliminary tests;. •. A USB 26 IlDAQ analog data acquisition device;. •. Two hammers of different lengths and weights;. •. A stand to hold the hammers; and. •. A protractor to measure the angle the hammers were raised to before striking the paste fill.. 5.3.2.. J\cceleronneters. The accelerometers were made by Dr Peter Grabau, from the Electrical and Computer School of Engineering.. They consisted of an Analog Devices ADXL202E low-power 2-axis. accelerometer connected to a circuit board as shown in Figure 5.1, and encased in resin inside a small black box as shown in Figure 5.2.. The purpose of the resin was to protect the. accelerometers when they were placed into the paste fill column, as the moisture present during the pouring of the column would have destroyed an unprotected accelerometer.. The. accelerometers are capable of measuring both dynamic accelerations such as vibration and static acceleration such as gravity. The accelerometers can measure acceleration on 2 axes. The output is a voltage whose duty is proportional to acceleration.. Figure 5.1 - Accelerometer Connected to Circuit Board. 74.
(24) Chapter 5 - The Study of Blast Attenuation in Paste Fill using Laboratory Tests. Figure 5.2 - Accelerometer Installed in Casing Prior to Pouring Resin A problem faced early in the test process was identifying a method of placing the accelerometers into the paste fill column in such a way that the following criteria were met: •. The accelerometer was not damaged during the pouring and curing of paste fill;. •. The accelerometer had good contact with the surrounding paste fill;. •. The accelerometer was orientated correctly; and. •. The exact location ofthe accelerometer was known.. In order to protect the accelerometers from damage due to moisture in the paste fill, the accelerometers were encased in a small black box full of resin.. In order to allow the. accelerometer to be set in the centre of the pipe and in the correct orientation, brass tubes were placed in the black box (see Figure 5.3) during the pouring and setting ofthe resin. These tubes were used to locate the accelerometer in the centre of the column. Holes were drilled through the pvc pipe joiners and the accelerometers were held in place in the centre ofthe pipe joiner by placing brass poles through the holes and the brass tubes. Once the paste fill was poured into the column and had set, the brass poles were removed, ensuring that the accelerometer was in contact with only the paste fill, not the pipe. By placing the accelerometers into the paste fill as it was poured, the paste fill set to the accelerometer as it cured, providing good contact between the accelerometer and the paste fill. The holes that were drilled into the wall of the pvc pipe joiner could then be measured to determine the exact location of the accelerometer along the length ofthe column. The final problem was setting the accelerometers in the desired location along the length of the pipe. Since a 2.7 m long pipe was used, it would be difficult to reach into the pipe to set an. 75.
(25) Chapter 5 - The Study of Blast Attenuation in Paste Fill using Laboratory Tests accelerometer into the middle of the pipe, so an alternative was required. Short lengths of pipe, varying in length between 0.5 m and 0.7 m were used instead, connected with pipe joiners. The accelerometers were placed in the pipe joiners, every 0.5 m along the length of the pipe. The advantage of this system was that it allowed the accelerometers to be placed in the desired location, while eliminating damage to the accelerometers during the compaction ofthe paste fill. The paste fill was poured in 0.5 m sections and compacted.. The joiner containing an. accelerometer was then added, before the next pipe section was added, and more paste fill was poured and compacted.. Figure 5.3 - Accelerometer Installed in Pipe Joiner. 5.3.3.. Pipe. Rather than set the paste fill into a single long pipe, short sections of pipe were used and joined together using pipe joiners. These pipes varied between 0.5 and 0.7 m in length. This not only allowed the accelerometers to be placed in the correct orientation, but it also allowed the paste fill to be correctly poured and compacted. Steel plates were used on each end of the paste fill column to allow the ends to be hit with a hammer without damaging the paste during testing. By placing the steel plates on the ends during pouring, the plates were set in place as the paste fill cured, eliminating the need to use an adhesive. During pouring, the paste fill was compacted using a steel rod. This was done in order to simulate the paste fill found in stopes in Cannington Mine, where the huge distance the paste fill falls to the stope acts to compact the wet material. For the preliminary test, 0.5 m lengths of pipe were joined together to form a 2.5 m long pipe, and the accelerometers were placed 1 m apart, 0.5 m from one end of the pipe. Steel plates were used to cover the end of the pipe, so that when a wave was induced with a hammer, it was uniformly distributed over the end surface, and the paste fill ends were not damaged. The apparatus for the preliminary test is shown in Figure 5.4.. 76.
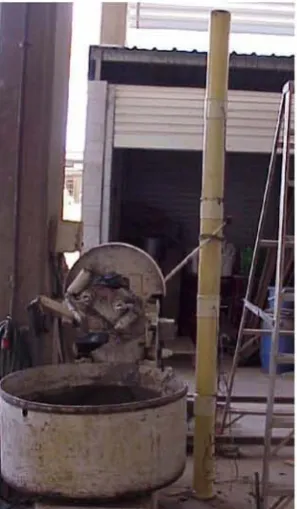
(26) Chapter 5 - The Study of Blast Attenuation in Paste Fill using Laboratory Tests 0.5. .-.-.-.-.- - .....-c:---Induce Wave Here. Figure 5.4 - Apparatus for Preliminary Test. Induce Wave Here !-lDAQ. Measuring Device. Figure 5.5 - Apparatus for the Full Test Stage For the full test stage, four 0.5 m long pipe sections and one 0.7 m long pipe section were joined together to form a 2.7 m long pipe. Four accelerometers were placed in the column, 0.5 m apart and 0.5 m from one end of the pipe. Steel plates were used to cover the end of the pipe, so that when a wave was induced with a hammer, it was uniformly distributed over the end surface, and the paste fill ends were not damaged. The apparatus for the stage 2 tests is shown in Figure 5.5.. 5.3.4.. Measuring Device. An oscilloscope was used to measure the acceleration during the preliminary test and the. calibration of the accelerometers.. The oscilloscope however could not be used to measure. signals from more than two accelerometers at anyone time.. For this reason, an Eagle. Technology USB 26 IlDAQ analogue data acquisition device was used for the full test. The IlDAQ has 16 analogue input channels. Data measured from the IlDAQ software was converted. into Microsoft Excel format to allow analysis of the waveforms.. 5.3.5.. Hammer. A hammer was used to induce a wave in the paste fill by striking the end of the column. In order to supply a consistent force each time to the column, the hammer was be set up so that it swung on a pivot point, striking the paste fill column as it reached the vertical position. A protractor was used to measure the angle the hammer was lifted to. The hammer was raised to a set angle and then allowed to fall. Two different sized hammers were used to induce waves of varying magnitude in the paste fill. The hammer apparatus is shown in Figure 5.6.. 77.
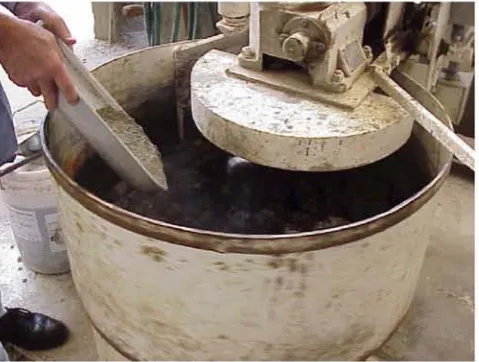
(27) Chapter 5 - The Study of Blast Attenuation in Paste Fill using Laboratory Tests. Figure 5.6 - Hammer used to Initiate Waves in Laboratory Tests. 5.4.. Test Methodology. The test methodology is described in the following section.. 5.4.1.. Preparation of Paste fill. Several drums of tailings were provided by Cannington Mine for use in the laboratory tests. The tailings in these drums were found to have quite a high water content, so they were allowed to dry until the water content was reduced to below the water content required for the laboratory tests. The water content ofthe partially dried tailings was determined to allow calculation ofthe quantities of cement and water to be added to the fill to create the appropriate mix. The following steps were followed to prepare the paste fill: 1. The water content of the tailings provided by Cannington Mine was determined. 2. The tailings were allowed to air dry. 3. The water content ofthe dried tailings was determined. 4. The quantity of tailings, water and cement required to produce the desired mixture of paste fill was calculated. 5. The tailings required for the mixture was measured and placed into the cement mixer.. 78.
(28) Chapter 5 - The Study of Blast Attenuation in Paste Fill using Laboratory Tests 6. The water and cement required for the paste fill mixture was measured. The cement mixer containing the tailings was turned on and the water and cement powder were added to the cement mixer, as shown in Figure 5.7. 7. The cement mixer was left running for half an hour to ensure that the paste fill was uniformly mixed. 8. The columns were poured with paste fill. The paste fill mixtures used for the laboratory tests are given in Table 5.1.. Figure 5.7- Paste Fill Being Mixed in the Cement Mixer as Cement is Added Table 5.1 Paste Fill Mixes used in Laboratory Tests Column. Preliminary. Cement content (%). 4. Solids Content (%). 74. 5.4.2.. 2. 3. 4. 5. 6. 3. 4. 3. 4. 4. 2. 77. 77. 79. 79. 77. 79. Pouring of Columns. The pouring method consisted ofthe following steps: 1. Prepare paste fill as outlined in section 5.4.1. 2. Place end cap onto a length of pipe and sit steel plate within the pipe inside the end cap. Pour in paste fill while pipe is standing upright. Compact with a steel rod. 3. Place a pipe joiner containing an accelerometer on to pipe. A paste fill column poured and compacted to the first pipe joiner is shown in Figure 5.8.. 79.
(29) Chapter 5 - The Study of Blast Attenuation in Paste Fill using Laboratory Tests. Figure 5.8 - Paste Fill Column Filled to the First Accelerometer. 4. Place next section of pipe into pipe joiner. Pour in paste fill and compact. 5. Repeat Steps 3 and 4 three times, ensuring that the accelerometer in each new pipe joiner is aligned the same way as the first accelerometer. 6. Place steel cap on the top of the pipe. Cure upright for 7 days. A finished paste fill column is shown in Figure 5.9. 7. Relocate paste fill column to sit horizontally on a long bench to allow for testing. Three columns are shown in Figure 5.10.. 5.4.3.. Test Procedure. The columns were tested at curing ages of 7, 14 and 28 days. The following methodology was followed for the testing ofthe columns: 1. The hammer was positioned on the stand so that the tip of the hammer lined up with the centre of the steel plate, which was marked on the plate.. The hammer stand was. positioned in front ofthe steel plate so that the tip of the hammer touched the steel plate when the hammer hung freely from the hammer stand. 2. The hammer was positioned on the stand so that the tip of the hammer lined up with the centre of the steel plate, which was marked on the plate.. The hammer stand was. positioned in front ofthe steel plate so that the tip of the hammer touched the steel plate when the hammer hung freely from the hammer stand.. 80.
(30) Chapter 5 - The Study of Blast Attenuation in Paste Fill using Laboratory Tests. Figure 5.9 - Finished Paste Fill Column. Figure 5.10 - Columns Ready For Testing 3. The accelerometers were connected to the monitoring device, which was connected to the computer. The monitoring program was set up to record. 4. The hammer was raised to an angle of 15 degrees and then allowed to swing and strike the steel plate at the end ofthe column.. 81.
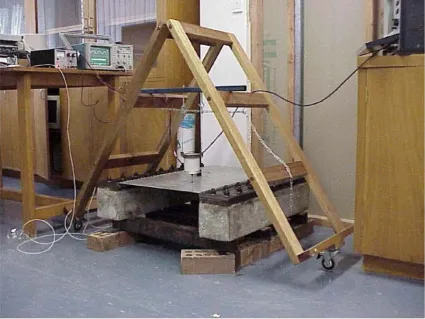
(31) Chapter 5 - The Study of Blast Attenuation in Paste Fill using Laboratory Tests 5. After each hammer strike, the recorded waveforms were checked to ensure that the waveform had been captured and the waveforms were saved to disk. The monitoring program was then set up to record the waveform from the next hammer strike. 6.. Steps 3 and 4 were performed twice for each measurement required to ensure that the waveforms obtained were reproducible.. 7. The hammer stand was then positioned in from of the steel plate at the opposite end of the column and steps 3 and 4 were repeated. Waveforms were induced and measured from both ends ofthe column, and for curing ages of 7, 14 and 28 days.. 5.5.. Calibration ofthe Accelerometers. Prior to using the accelerometers in the laboratory tests, they required calibration.. The. calibration process was used to obtain the gain of the accelerometer. The accelerometers were calibrated in the mechanical vibrations lab at James Cook University by comparing the accelerometers against a reference accelerometer using a method similar to that outlined in International Standard ISO l6063-l:l998(E) section 5.3.. The method used to calibrate the. accelerometers and the calibration factors obtained are discussed in the following section.. Method of Calibration. 5.5.1.. The accelerometers were calibrated against a reference accelerometer for which the calibration is known. In this method of calibration, both accelerometers are subjected to the same input motion and their outputs are measured.. The gain of the new accelerometer can then be. calculated from the following equation:. (5.6). where. SI. = the gain ofthe reference accelerometer. S2. = the gain ofthe accelerometer being calibrated. U 1 = the output ofthe reference accelerometer U2 = the output ofthe accelerometer being calibrated The input motion was applied to the accelerometers through the use of a shaker table. The shaker table consisted of a shaker which was suspended above an aluminium plate so that the. 82.
(32) Chapter 5 - The Study of Blast Attenuation in Paste Fill using Laboratory Tests needle from the shaker is touching the plate as shown in Figure 5.11. The shaker was used to apply sinusoidal motion to the aluminium plate. A frequency analyser connected to the shaker was used in order to vary the frequency ofthis motion. The accelerometers were attached to the aluminium plate using an adhesive and an oscilloscope was used to measure the output of the accelerometers.. The output of the accelerometers was measured for frequencies ranging. between 250 Hz and 1000 Hz, which was the range of frequencies expected to be encountered in the laboratory tests. The reference accelerometer was a Bruel & Kjaer accelerometer type 4384 which had the calibration given in Table 5.2.. Figure 5.11 - Apparatus used to Calibrate Accelerometers. Table 5.2 Calibration for Reference Accelerometer Description. Value. Charge Sensitivity (pC/g). 983. Voltage Sensitivity (mV/g). 7.85. Capacitance (pF). 1253. 83.
(33) Chapter 5 - The Study of Blast Attenuation in Paste Fill using Laboratory Tests. 5.5.2.. Calibration Factors. The gain for each accelerometer was calculated using equation 5.6. The results obtained are given in Table 5.3.. Table 5.3 Calibration of Accelerometers Accelerometer Number. Gain (mV/g). 271.6 2. 344.9. 3. 78.9. 4. 226.8. 5. 228.4. 6. 342.6. 7. 426.0. 8. 265.9. A. 341.5. B. 485.0. 5.6. Analysis ofResults A set of acceleration waveforms was obtained from the Laboratory Tests. These waveforms were converted to velocity waveforms and analysed. The results of the laboratory tests are given in the following section.. 5.6.1.. Reproducibility of Results. In order to ensure that the data obtained from this experiment was reproducible, each measurement was repeated. The two waveforms obtained from each measurement were then compared. Waveforms recorded in column 6 at a curing time of 14 days are shown in Figure 5.12. As can be seen, the waveforms have the same shape and the same peak particle velocities.. 84.
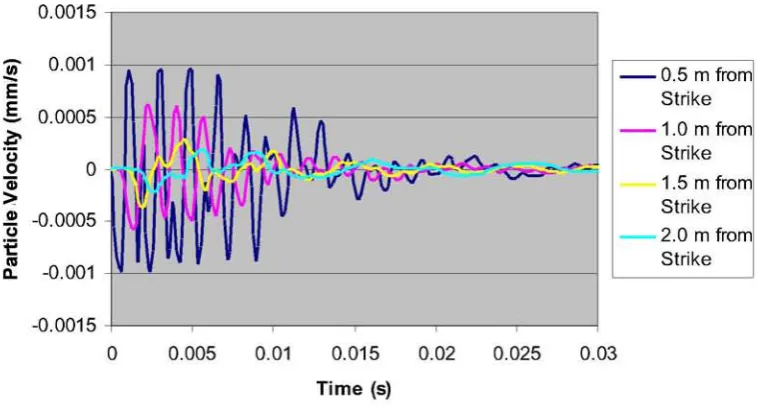
(34) Chapter 5 - The Study of Blast Attenuation in Paste Fill using Laboratory Tests This was seen for all waveforms which were recorded. These waveforms demonstrate that the method used for the laboratory tests produced reproducible results.. 5.6.2.. Transmission of a Wave through a Column of Paste Fill. Waveforms were measured at four locations along the column for each hammer strike. A comparison of waveforms measured at 0.5, 1.0, 1.5 and 2.0 m from the location of the hammer strike is shown in Figure 5.13. These are the waveforms measured at column 6 when it had been cured for 14 days. The waveforms for columns 1 to 5 are given in Appendix E. As can be seen, the wave measured at a distance of 0.5 m from the source has a high amplitude and a short wavelength whereas the wave measured at a distance of 2.0 m from the source has a low amplitude and a long wavelength. The reduction of amplitude as the wave travels through the paste fill corresponds to a reduction in peak particle velocity with distance from the source. This result is consistent with the results ofthe field instrumentation tests (see chapter 4), and the peak particle velocities predicted by the charge weight scaling law (see equation 2.3). A comparison between the waveforms measured at different locations along the column shows the wavelength increasing and the frequency decreasing with distance from the source. This result indicates that the higher frequencies attenuate before the lower frequencies. This result was observed for each column at each curing age tested. The fast Fourier transform of each waveform was calculated in order to analyse the frequency content of the waveforms. A brief description of the fast Fourier transform method is given in section 3.7.5. The frequency spectrum generated for the velocity waveforms measured in column 6 at a curing age of 14 days is given in Figure 5.14. This figure shows that for the waveform recorded at 0.5 m from the source, some high frequencies are present. These high frequencies are dramatically reduced in the waveforms recorded at 1.0 m from the source and the waveforms recorded at 1.5 m and 2.0 m from the source do not contain any high frequencies. Similar frequency spectrums were obtained for the waveforms recorded in the other columns.. In all cases, the frequency. spectrums showed that the higher frequencies attenuate faster than lower frequencies in paste fill. In order to provide a measure of attenuation, the quality factor discussed in section 5.2 was obtained for the paste fill in each column for each curing time. The quality factor was obtained from the relationship between the pulse rise time and the time of pulse propagation which was given in equation 5.5. The pulse rise time and the time of pulse propagation was determined for each measured waveform and plotted. A linear trendline was obtained, from which the slope of the line was equal to c/Q. The quality factor was then obtained using a value of c = 0.53. The quality factors obtained from the laboratory tests are summarised in Table 5.4.. 85.
(35) Chapter 5 - The Study of Blast Attenuation in Paste Fill using Laboratory Tests 0.5 m from Hammer Strike 0.0015 .---~. '>'u* ~ ~. fl.. -. -. -. -. -. -. -. -. -. -. -. -. -. -. ----,. 0.001 ~ 0.0005 ++l-r-t+-l+-l'\------,t-----{r----.- - - - - - - - - - I E 0 ++H-++-++-+~++\+-''V-\~__,_..._p_..p....,~'-'''-=~=='""~_j g -0.0005 -0.001 -p-~----------------I -0.0015 - t - - - - , - - - - , - - - - - - - - ; - - - - - - r - - - - - , - - ----l. o. 0.005. 0.01. 0.015. 0.02. 0.025. -. Strike 1. -. Strike 2. -. Strike 1. -. Strike 2. -. Strike 1. -. Strike 2. -. Strike 1. -. Strike 2. 0.03. Time (s). 1.0 m from Hammer Strike 0.0008 ,..-- - - - - - - - - - - - - - - - ---, 0.0006 + ----tr-__- - - - - - - - - - - - -- I 'u0 ...... 0.0004 Qi.!!! 0.0002 -+--+-+-++-++--..-~------------I > E 0 ~ g -0.0002 +++ -t+-t+-t+-+f---- - - - - - - - - - - - I 1:: -0.0004 l'CI -0.0006 +-'' ' - - - - - - - - - - - - - - - - - - -- 1 fl. -0.0008 +----,----,--------;-----r-----,---~ ~. o. 0.005. 0.01. 0.015. 0.02. 0.025. 0.03. Time (s). 1.5 m from Hammer Strike 0.0004 .---~. 'u0. -. -. -. -. -. -. -. -. -. -. -. -. -. -. ----,. 0.0002 -+---+\:---------=c _ _ - - - - - - - - - -- I ....... Qi.!!!. > E. 0 -+------++---+.c-f'"-V-~c__c/____.....___=+_""=...=.c=__"__=7"=4. ~. E -0.0002 -+-++--- - - - - - - - - - - - - -- 1. ~. -0.0004 - + - - - ' - - - - - - - - - - - - - - - - - -- 1. fl.. -0.0006 +----,----,-------,-----r-----,---~. CJ--. o. 0.005. 0.01. 0.015. 0.02. 0.025. 0.03. Time (s). 2.0 m from Hammer Strike 0.0002 ,..-~. 'u0. 0.0001. -. -. -. -. -. -. -. -. -. -. -. -. -. -. -. ---,. +---t-+-----,I-+---~--------I. ....... Qi.!!!. > E. 0 -t-~-----lf----'>d'--______\1A_-____rr-~'""4,._________7f~-~___:I. ~. E -0.0001. +--+-f - = - - - - - - - - - - - - - -- I. ~. -0.0002. +-- - - - t f - - - - - - - - - - - - - - -- I. fl.. -0.0003 +----,----,--------;-----r-----,---~. CJ--. o. 0.005. 0.01. 0.015 Time (s). 0.02. 0.025. 0.03. Column 6: 2 % cement, 79 % solids Curing age: 14 days. Figure 5.12 - Waveforms Recordedfor Column 6 After 14 Days Curing Time 86.
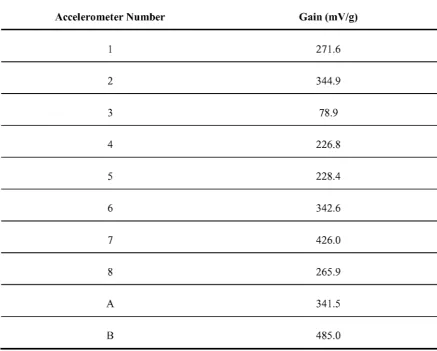
(36) Chapter 5 - The Study of Blast Attenuation in Paste Fill using Laboratory Tests 0.0015 ,..---. "iii'. 0.001. -. -. -. -. -. -. -. -. -. -. -. -. -. -. -. -----,. +--~~------------------I. E. .§. ~. 'uo. -. 0.5 m from Strike. -. 1.0 m from Strike 1.5 m from. -. 2.0 m from Strike. ;f~ ~~~=""----'-. G). >. Strike. II). u. :e ~. -0.001 -p-~----------------____I -0.0015. +-----,-------,-------,------,--------,--____1. o. 0.005. 0.01. 0.015. 0.02. 0.025. 0.03. Time (5). Figure 5.13 - Comparison of Waveforms Recordedfor Column 6 After 14 Days Curing Time 0.4 0.35. -. 2.0 m from source. -. 1.5 m from source. 0.3. .g. 0.25. ~. :=c.. 02 . 1.0 m from source. E <C 0.15 0.1. I. -1*o. IJ. -. 0.05. /:V':::0 ~ /\.-. o. 500. ~. ~. 1000. 0.5 m from source. 1500. 2000. 2500. 3000. 3500. Frequency (Hz). Figure 5.14 -FrequencySpectrumfor Waveforms Recordedfor Column 6 After 14 Days Curing Time Table 5.4 Quality Factors for Paste Fill Obtained in Laboratory Test Column Quality. N/A*. 2. 3. 4. 5. 6. 0.78. 2.40. 0.76. 1.06. 1.50. Factor *lnsufficient data was obtained to calculate Q as one ofthe accelerometers was faulty.. 87.
(37) Chapter 5 - The Study of Blast Attenuation in Paste Fill using Laboratory Tests. 5.6.3.. Effect of Curing Age on Attenuation. The columns were tested for curing ages of 7, 14 and 28 days. The waveforms recorded at the different curing ages were then compared to determine whether the curing age has an effect on the transmission of a wave through paste fill. A comparison of the waveforms recorded for column 5 is shown in Figure 5.15. The waveforms recorded for the 7 day and 14 day tests were very similar. As can be seen in Figure 5.15, similar peak particle velocities were recorded at all locations along the column. A slight increase in wavelength was observed between the 7 day and the 14 day tests, with the increase in wavelength becoming more pronounced with distance from the source.. The. waveforms recorded for the 28 day tests were similar in shape to the waveforms recorded in the 7 and 14 day tests. However, the peak particle velocities from the 28 day waveforms were less than those for the 7 and 14 day tests. A slight increase in wavelength was also observed for the 28 day tests. These results show that the wave attenuated faster in the paste fill once it had fully cured. The paste fill reaches its full strength when it is just fully cured. Therefore, the results show that as the strength of the material increases, waves attenuate faster within the material. This indicates that waves of a level capable of causing failure of the material are likely to penetrate deeper into a weaker material, resulting in greater failure of that material. Similar observations were made for the other columns analysed.. These results indicate that in order to reduce the damage. observed in the paste fill during blasting, the paste fill should be allowed to fully cure before it is exposed to nearby blasting.. 5.6.4.. Effect of Paste Fill Mix on Attenuation. The columns were tested for a number of different paste fill mixes, which are listed in Table 5.1. The waveforms recorded in columns of different paste fill mix were then compared to determine whether the cement or solids content had an effect on the transmission of a wave through paste fill. A comparison of the waveforms with a solids content of 77 % and cement contents of 2 %, 3 % and 4 % is shown in Figure 5.16. As can be seen, waveforms of similar shape were recorded for distances of 1.5 m and 2.0 m. At distances of 0.5 m and 1.0 m, the amplitude in the waveforms recorded in the column with 2 % cement is seen to attenuate much slower than the waveforms recorded in the columns with 3 % and 4 % cement content.. This reflects the. observations made with the effect of curing time, where the waveforms attenuate slower in the weaker material.. 88.
(38) Chapter 5 - The Study of Blast Attenuation in Paste Fill using Laboratory Tests 0.5 m from Hammer Strike. ~. 'u0. -. 7 days Curing Time. -. 14 days Curing Time. ....... -al_ III. > E ~ E CJ--. 1::. 28 days. l'CI. fl.. Curing Time. -0.001 0. 0.005. 0.01. 0.015. 0.02. 0.025. 0.03. Time (s). 1,0 m from Hammer Strike 0.0015 ~. 'u0. ....... -al_ III. > E ~ E CJ--. 1::l'CI. -. 7 days Curing Time. -. 14 days Curing Time. 0.001 0.0005 0. 28 days. -0.0005. fl.. Curing Time. -0.001 0. 0.005. 0.01. 0.015. 0.02. 0.025. 0.03. Time (s). 1.5 m from Hammer Strike 0.0004 -,---. -. -. -. -. -. -. -. -. -. -. -. -. -. -----,. ~. 0.0002 'u 0 ....... Qi.!!!. > E. o. ~. E -0.0002. ~. -0.0004. fl.. -0.0006 +-------,------,--,-----,-------,--------1 o 0.005 0.01 0.015 0.02 0.025 0.03. -. 7 days Curing Time. -. 14 days Curing Time. CJ--. 28 days. + - - - - - - - - - - - - - - --------l. Curing Time. Time (s). 2.0 m from Hammer Strike. ~g 0.0002 ~:~~~i j ~~. 0.0001. I\ ~. r) ']JIJi n\. ~ i -o.ooo~ ~ - ~I. 1:: ~. -0.0002 -0.0003 -0.0004. I(. ~. j. ~;. V1J'ri(l\l{-_n_~~~. I. -. 7 days Curing Time. -. 14 days Curing Time 28 days Curing Time. i. o. 0.005. i. 0.01. i. 0.015 Time (s). i. i. 0.02. 0.025. 0.03. Column 5: 4 % cement, 77 % solids. Figure 5.15 - Comparison of Waveforms Recordedfor Different Curing Times. 89.
(39) Chapter 5 - The Study of Blast Attenuation in Paste Fill using Laboratory Tests In Figure 5.16, peak particle velocities and wavelengths were similar in the waveforms recorded at distances of 1.5 m and 2.0 m from the source. Similar observations were made when the waveforms of two different solids contents were compared. As the strength of the paste fill changes with solids and cement content, a greater effect of the material composition on attenuation was expected than that measured. These waveforms were induced from very small loads, resulting in waveforms with very small amplitudes. In order to study the effect of paste fill composition, a greater variety of paste fill mixes and larger loads may be required.. 5. 7.. Summary. A set of laboratory tests was conducted to study the attenuation of a longitudinal wave travelling through a column of paste fill. These tests involved the generation of a longitudinal wave in a column of paste fill. Accelerometers installed along the length of the column were used to measure the acceleration at four locations along the column, from which the attenuation of the wave within the paste fill could be determined. The following observations were made as a result ofthese laboratory tests: 1. Peak particle velocity was observed to decrease with distance from the source. 2. Wavelength was observed to increase with distance from the source. 3. Higher frequencies were observed to attenuate faster than lower frequencies. 4. The wave attenuated faster in the paste fill once it had fully cured and reached its full strength.. Therefore, in order to reduce the damage observed in paste fill during. blasting, the paste fill should be allowed to fully cure before it is exposed to nearby blasting. 5. As the strength ofthe material increases, waves attenuate faster within the material.. 90.
(40) Chapter 5 - The Study of Blast Attenuation in Paste Fill using Laboratory Tests 0.5 m from Hammer Strike. ~ O~~~~~ ii~1 ~1 ~llrllil'.11 iii h~ ~E. (j. ~. g. 11 ~~~~~'h~yt4~~~~-. 0 I -0.0005 lLU~I' i"\f -0.001 +-'~~ V V _V~V -0.0015. fl.. ]. A. ..2 'iii 0.0005. V. -. -. -. 2 % Cement 3 % Cement 4 % Cement. -l. - t - - - - - r - - - - , - - - - - - - - r - - - - - , - - - - - - - - , - ----1. o. 0.005. 0.01. 0.015. 0.02. 0.025. 0.03. Time (s). 77 % solids. 1.0 m from Hammer Strike. -. 2 % Cement. -. 3 % Cement 4 % Cement. o. 0.005. 0.01. 0.015. 0.02. 0.025. 0.03 77 % solids. Time (s). 1.5 m from Hammer Strike. ~. 'u0. ....... -al_ III. > E ~ E CJ--. 1:: l'CI fl.. ~:~~~: ~. [. f\~\. ]. ~\,. l 1~W"v5~~-e=--~ ] o -B. 0.0002 -0.0002. -. o. 0.005. ,. ,. ,. 1. 0.01. 0.015. 0.02. 0.025. 3 % Cement 4 % Cement. . .--~---------. -0.0004,. 2 % Cement. 0.03 77 % solids. Time (s). 2.0 m from Hammer Strike 0.0006. f ~ ~~~~: lj----Jf'Ac----------,.-l > E ~ E CJ -~. '1.1. -0.0002. V. -. 2 % Cement. -. 3 % Cement 4 % Cement. -'IJd-'--W--t - - - - - - - - - -. fl.. -0.0004. o. 0.005. " " 0.01 0.015 0.02 Time (s). 0.025. 0.03 77 % solids. Figure 5.16 - Comparison of Waveforms Recordedfor Different Cement Contents 91.
(41)
Figure
+2
Related documents