Learning Network Analysis 2010/11
This bulletin provides data about post-16 learners (excluding learners at higher education institutions) domiciled in Wales. It is intended as a source of information to support national and local strategic planning and policy making within the post-16 education and training sector.
The information within this bulletin relates to Welsh-domiciled learners enrolled during the 2010/11 academic year at further education (FE) institutions, other training (work-based learning) providers, local authority community learning providers and school sixth forms Wales. The analysis also includes Welsh domiciled learners enrolled at further education institutions, other training providers and (included for the first time this year) school sixth forms located in England. The data has been sourced from the Lifelong Learning Wales Record (LLWR), Post-16 Pupil Level Annual Schools Census (PLASC), the Individualised Learner Record (ILR) and the National Pupil database (NPD).
Summary
Chart 1: Learners by local authority of domicile – 2008/09 to 2010/11
0 5,000 10,000 15,000 20,000 25,000 30,000 35,000
Isle o f Ang
lesey Gw yne dd Conw y Denbi ghs hire Flin tshir e Wrex ham Pow ys Cere digi on Pem broke shire Carm arthens hire Swa nsea Neat h P
ort T albot
Brid gend
The V ale of
Gla mo rgan Rhondd a C ynon Taf Me rthy
r Tydf il Caer phi lly Blaena u G went Torfa en Mo nm out hshi re Newp ort Car diff N u mb e r o f le a rn e rs 2008/09 2009/10 2010/11
• At 295,900, the total number of Welsh-domiciled learners was 1.1 per cent lower in 2010/11 than in 2009/10 and 4.2 per cent lower than in 2008/09. The number of learners aged 20 to 24 increased by 3.6 per cent between the years but there was a decrease in the number of learners within each of the other age groups. (Table 1)
• Despite the decline in total learner numbers individual local authorities exhibited differing trends. Merthyr Tydfil continued to show an increase in learners with growth of 19 per cent since 2008/09.
Statistician: Siobhan Evans Tel: 029 20926556 E-mail: [email protected]
Next update: May 2013 (provisional)
Twitter: www.twitter.com/statisticswales | www.twitter.com/ystadegaucymru
However, the majority of local authorities showed a decrease in the number of resident learners with Carmarthenshire showing a drop of 10 per cent relative to the 2009/10 figures. (Chart 1)
• The total number of learning activities undertaken decreased by less than 1 percent. There was a 13.4 per cent increase in learning activities within the ‘Retail and Commercial Enterprise’ subject area and smaller increases in the ‘Education and Training’ and ‘Construction, Planning and the Built Environment’ subject areas. Conversely, ‘Leisure, Travel and Tourism’ showed a 5.9 per cent decline in activities in addition to reduced numbers in the ‘Information and Communication Technology’ and ‘Health, Public Sector and Care’ sectors. (Table 3)
Learners
• In 2010/11 there were 295,900 learners domiciled in Wales and pursuing learning at the provider types covered by this analysis; FE Institutions, other work-based learning training providers, local authority community learning providers and maintained school sixth forms.
• 48 per cent of learners were aged under 25 at 31 August 2011 and 35 per cent were aged between 25 and 49 (Table 1).
• Further analysis of participation in post-16 education and training is published on a biannual basis and is due in October 2013, this involves analysis of learner numbers relative to population data, at both a national and local authority level. Similar analysis for the 2009/10 academic year can be found at the following link.
[image:2.595.49.552.425.744.2]Analysis of Participation in post-16 Education & Training in Wales: 2009/10
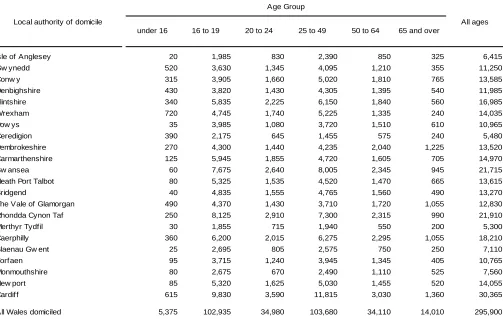
Table 1 – Number of learners by age group and local authority of domicile – 2010/11
under 16 16 to 19 20 to 24 25 to 49 50 to 64 65 and over
Isle of Anglesey 20 1,985 830 2,390 850 325 6,415
Gw ynedd 520 3,630 1,345 4,095 1,210 355 11,250
Conw y 315 3,905 1,660 5,020 1,810 765 13,585
Denbighshire 430 3,820 1,430 4,305 1,395 540 11,985
Flintshire 340 5,835 2,225 6,150 1,840 560 16,985
Wrexham 720 4,745 1,740 5,225 1,335 240 14,035
Pow ys 35 3,985 1,080 3,720 1,510 610 10,965
Ceredigion 390 2,175 645 1,455 575 240 5,480
Pembrokeshire 270 4,300 1,440 4,235 2,040 1,225 13,520
Carmarthenshire 125 5,945 1,855 4,720 1,605 705 14,970
Sw ansea 60 7,675 2,640 8,005 2,345 945 21,715
Neath Port Talbot 80 5,325 1,535 4,520 1,470 665 13,615
Bridgend 40 4,835 1,555 4,765 1,560 490 13,270
The Vale of Glamorgan 490 4,370 1,430 3,710 1,720 1,055 12,830
Rhondda Cynon Taf 250 8,125 2,910 7,300 2,315 990 21,910
Merthyr Tydf il 30 1,855 715 1,940 550 200 5,300
Caerphilly 360 6,200 2,015 6,275 2,295 1,055 18,210
Blaenau Gw ent 25 2,695 805 2,575 750 250 7,110
Torfaen 95 3,715 1,240 3,945 1,345 405 10,765
Monmouthshire 80 2,675 670 2,490 1,110 525 7,560
New port 85 5,320 1,625 5,030 1,455 520 14,055
Cardiff 615 9,830 3,590 11,815 3,030 1,360 30,365
All Wales domiciled 5,375 102,935 34,980 103,680 34,110 14,010 295,900
Sources: Lifelong Learning Wales Record, Post-16 Pupil Level Annual Schools Census, Individalised Learner Record, National Pupil Database
Local authority of domicile
Age Group
All ages
Notes:
• 64.1 per cent of learners were enrolled at Welsh FE institutions (including their training subsidiaries), 14.4 per cent were enrolled at other work-based learning training providers, 7.4 per cent were enrolled at local authority Community Learning providers, 9.9 per cent were enrolled at school sixth forms in Wales, and 4.2 per cent were enrolled at providers in England (Table 2).
• Of the 7,110 learners living in Blaenau Gwent 23 per cent were enrolled at work-based learning providers (other than FEIs) whilst in Flintshire the proportion of the learner cohort at other training providers was markedly lower, at 4 per cent (Table 2).
• Local authorities bordering England showed the highest number of learners enrolled at English providers. Over 15 percent of learners domiciled in Powys and in Monmouthshire crossed the border to learn, with Flintshire and Wrexham each showing more than 10 per cent of domiciled learners enrolled at providers in England (Table 2).
Table 2 – Number of learners by type of provider and local authority of domicile – 2010/11
Welsh Further Education Institutions
Other Training Providers
Local authority Community
Learning
School Sixth Forms in
Wales
English Further Education Colleges and
Training providers
School Sixth Forms in England
Isle of Anglesey 5,000 530 0 610 275 * 6,415
Gw ynedd 9,305 925 * 680 340 0 11,250
Conw y 10,960 1,035 0 1,215 375 0 13,585
Denbighshire 9,885 605 0 985 505 5 11,985
Flintshire 12,610 675 0 1,640 2,000 65 16,985
Wrexham 10,625 1,310 * 590 1,415 90 14,035
Pow ys 5,730 1,495 740 1,275 1,700 25 10,965
Ceredigion 2,800 1,105 515 925 130 * 5,480
Pembrokeshire 7,115 1,625 3,160 1,355 265 0 13,520
Carmarthenshire 10,175 2,270 715 1,560 245 0 14,970
Sw ansea 15,120 2,990 1,755 1,475 380 * 21,715
Neath Port Talbot 10,385 2,080 355 440 350 * 13,615
Bridgend 8,360 2,015 850 1,785 260 * 13,270
The Vale of Glamorgan 5,755 2,020 2,960 1,765 325 10 12,830
Rhondda Cynon Taf 12,565 4,285 1,380 3,160 510 * 21,910
Merthyr Tydf il 2,840 1,110 480 680 185 0 5,300
Caerphilly 11,895 3,280 1,205 1,500 330 * 18,210
Blaenau Gw ent 4,735 1,630 35 550 160 * 7,110
Torfaen 5,790 2,380 1,320 1,055 215 0 10,765
Monmouthshire 4,260 975 80 1,080 1,060 105 7,560
New port 8,370 3,020 340 1,940 385 * 14,055
Cardif f 15,435 5,270 5,880 3,165 570 45 30,365
All Wales domiciled 189,715 42,640 21,775 29,430 11,980 360 295,900
Sources: Lifelong Learning Wales Record, Post-16 Pupil Level Annual Schools Census, Individalised Learner Record, National Pupil Database Notes:
(a) There is no directly delivered community learning in the north Wales local authorities of Isle of Anglesey, Gw ynedd, Conw y, Denbighshire, Flintshire and Wrexham. Delivery is via subcontracted arrangements w ith FEIs.
All providers Local authority of domicile
Type of provider
Learning Activities
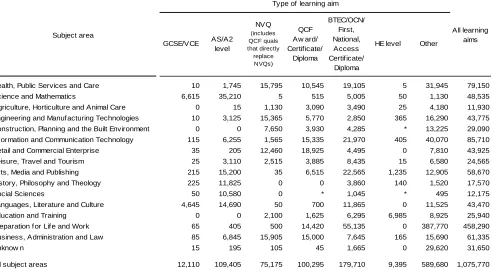
• There were 1,075,770 learning activities/aims undertaken during the 2010/11 academic year by learners domiciled in Wales and enrolled at the six categories of provider shown in Table 2.
• The highest number of learning activities (43 per cent) was found within the subject area
‘Preparation for Life and Work’. This high figure can be attributed to the fact that most key skill qualifications are categorised in this subject area and a learner may be enrolled on as many as six key skill courses. Nationally, the next most common subject areas were ‘Information and
Communication Technology’ and ‘Health, Public Services and Care both with around 8 per cent of the learning activity (Table 3).
[image:4.595.52.543.344.614.2]• The highest proportion (74 per cent) of the Higher Education (HE) level learning activity fell within the ‘Education and Training’ subject area (Table 3), this is primarily due to the fact that teacher training qualifications comprise much of the HE level learning. The number of learning aims at HE level as a percentage of the total number of aims rose from 0.6 per cent in 2009/10 to 0.9 per cent in 2010/11.
Table 3 – Number of learning activities by subject area and type of learning aim – 2010/11
GCSE/VCE AS/A2 level
NVQ (includes QCF quals that directly replace NVQs)
QCF Aw ard/ Certificate/
Diploma
BTEC/OCN/ First, National, Access Certificate/
Diploma
HE level Other
Health, Public Services and Care 10 1,745 15,795 10,545 19,105 5 31,945 79,150
Science and Mathematics 6,615 35,210 5 515 5,005 50 1,130 48,535
Agriculture, Horticulture and Animal Care 0 15 1,130 3,090 3,490 25 4,180 11,930 Engineering and Manuf acturing Technologies 10 3,125 15,365 5,770 2,850 365 16,290 43,775 Construction, Planning and the Built Environment 0 0 7,650 3,930 4,285 * 13,225 29,090 Inf ormation and Communication Technology 115 6,255 1,565 15,335 21,970 405 40,070 85,710 Retail and Commercial Enterprise 35 205 12,460 18,925 4,495 0 7,810 43,925 Leisure, Travel and Tourism 25 3,110 2,515 3,885 8,435 15 6,580 24,565 Arts, Media and Publishing 215 15,200 35 6,515 22,565 1,235 12,905 58,670 History, Philosophy and Theology 225 11,825 0 0 3,860 140 1,520 17,570
Social Sciences 50 10,580 0 * 1,045 * 495 12,175
Languages, Literature and Culture 4,645 14,690 50 700 11,865 0 11,525 43,470
Education and Training 0 0 2,100 1,625 6,295 6,985 8,925 25,940
Preparation f or Life and Work 65 405 500 14,420 55,135 0 387,770 458,290 Business, Administration and Law 85 6,845 15,905 15,000 7,645 165 15,690 61,335
Unknow n 15 195 105 45 1,665 0 29,620 31,650
All subject areas 12,110 109,405 75,175 100,295 179,710 9,395 589,680 1,075,770
Sources: Lifelong Learning Wales Record, Post-16 Pupil Level Annual Schools Census, Individalised Learner Record, National Pupil Database
Notes:
All learning aims Subject area
Type of learning aim
(a) StatsWales tables containing this and further information can be found at: Learning Network Analysis - StatsWales tables
Learning Programmes
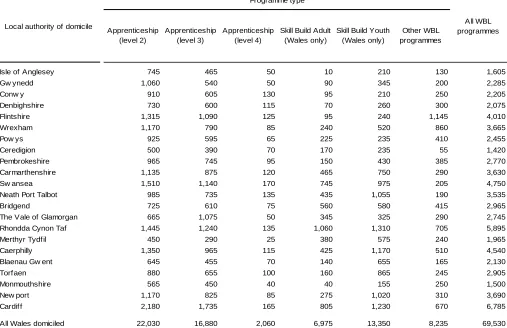
• Wales domiciled learners were enrolled on 69,530 learning programmes offering work-based learning provision provided by both FE institutions and other training providers (Table 4).
• Foundation Apprenticeships, and their equivalent level 2 qualification in England, accounted for 32 per cent of the work-based learning programmes. Level 3 Apprenticeships (previously called Modern Apprenticeships, in Wales) comprised 24 per cent (Table 4).
• Of the learning programmes undertaken by Isle of Anglesey domiciled learners 79 per cent were apprenticeship courses whilst only 39 per cent of work-based learning programmes undertaken by Merthyr Tydfil residents were at apprenticeship level (Table 4).
[image:5.595.45.552.362.690.2]• Skill Build Youth, a Wales specific qualification offered to those not in employment, made up 19 per cent of the total work-based learning provision. However, there was a marked difference between local authorities with Skill Build Youth programmes accounting for 30 per cent of learning programmes undertaken by both Torfaen and Neath Port Talbot domiciled work-based learners compared to only 6 per cent of programmes undertaken by Flintshire learners (Table 4).
Table 4 – Work-based learning provision by programme type and local authority of domicile
Apprenticeship (level 2)
Apprenticeship (level 3)
Apprenticeship (level 4)
Skill Build Adult (Wales only)
Skill Build Youth (Wales only)
Other WBL programmes
Isle of Anglesey 745 465 50 10 210 130 1,605
Gw ynedd 1,060 540 50 90 345 200 2,285
Conw y 910 605 130 95 210 250 2,205
Denbighshire 730 600 115 70 260 300 2,075
Flintshire 1,315 1,090 125 95 240 1,145 4,010
Wrexham 1,170 790 85 240 520 860 3,665
Pow ys 925 595 65 225 235 410 2,455
Ceredigion 500 390 70 170 235 55 1,420
Pembrokeshire 965 745 95 150 430 385 2,770
Carmarthenshire 1,135 875 120 465 750 290 3,630
Sw ansea 1,510 1,140 170 745 975 205 4,750
Neath Port Talbot 985 735 135 435 1,055 190 3,535
Bridgend 725 610 75 560 580 415 2,965
The Vale of Glamorgan 665 1,075 50 345 325 290 2,745
Rhondda Cynon Taf 1,445 1,240 135 1,060 1,310 705 5,895
Merthyr Tydf il 450 290 25 380 575 240 1,965
Caerphilly 1,350 965 115 425 1,170 510 4,540
Blaenau Gw ent 645 455 70 140 655 165 2,130
Torfaen 880 655 100 160 865 245 2,905
Monmouthshire 565 450 40 40 155 250 1,500
New port 1,170 825 85 275 1,020 310 3,690
Cardif f 2,180 1,735 165 805 1,230 670 6,785
All Wales domiciled 22,030 16,880 2,060 6,975 13,350 8,235 69,530
Sources: Lifelong Learning Wales Record, Post-16 Pupil Level Annual Schools Census, Individalised Learner Record, National Pupil Database
Programme type
All WBL programmes Local authority of domicile
Notes:
Notes
1. Data Sources
Four data sources were employed in this analysis.
• The Lifelong Learning Wales Record (LLWR) is data collected by the Department for Education and Skills (DfES) and is required to inform funding allocations, monitor performance and outcomes and to inform strategy development. The data provides the official source of statistics on post-16 learners in Wales (excluding Higher Education Institutions (HEIs) and school sixth forms). This bulletin uses data from the 2010/11 statistical freeze taken on February 23 2012.
Further information on LLWR including user support manuals can be found at: Welsh Government - Lifelong Learning Wales Record
Our statement of administrative sources, which also refers to this data source, can be found at: Statement of Administrative Sources
• The post-16 Pupil Level Annual Schools Census (PLASC) data collection currently takes place three times a year (September, January, June) from maintained secondary schools with Year 12, 13 and/or 14 pupils, in Wales. The frequency of the collection is now under review.
Data from the January 2011 census is used in this bulletin.
Further information on the PLASC data collection can be found at: Pupil Level Annual Schools Census
• In England, from 2008/09, the Information Authority took responsibility for the Individualised Learner Record (ILR) and the information collected within it, whilst the Data Service was established to process and disseminate that data. The data provides the official source of statistics on post-16 learners in England (excluding HEIs and school sixth forms).
Further information on the Information Authority and the ILR can be found at: Individualised Learner Record
• The National Pupils Database(NPD) covers all pupils in state (or partially state-funded) schools in England and is collected by the Department for Education. The NPD is a pupil level database which combines the examination results of pupils with information on pupil and school characteristics.
2. Definitions
2.1 Terminology
• The term ‘academic year’ is used throughout this bulletin to refer to the period 1 August to 31 July.
• The term ‘learning activity’ refers to a specific qualification or course pursued by a learner, for example, a GCSE or Key Skill. The term ‘learning programme’ refers to a group of related learning activities and has particular significance in the work-based learning sector where apprenticeship learning programmes consist of an NVQ and a number of associated learning activities.
2.2 Cohort of learners
• The cohort underpinning the Learning Network Analysis comprises post-16 learners domiciled in Wales or enrolled at a Welsh provider and engaged in learning during the year. However the cohort does not include learners at higher education institutions; and from 2007/08, the cohort excluded Welsh for Adults (WfA) FE learners registered at the five HEI-based WfA centres. Wales domiciled learners attending school sixth forms in England have been included for the first time in the
Learning Network Analysis.
• Learners with unidentified postcodes are excluded from all tables in the bulletin. As such, the figures detailed may differ from those reported in other publications. The coverage of learners with known postcodes was over 99 per cent and analysis has identified that the distribution of unknown or unidentified postcodes was not regionally biased. Tables showing the full cohort, including learners with unidentified postcodes, are available on the StatsWales dissemination site.
• Learners with known non-Welsh postcodes are also excluded from the tables in the bulletin. This will impact on learner numbers at some providers with a catchment area covering the
Wales/England border. For example, FE institutions in Wrexham (Yale College, Coleg Llysfasi), Flintshire (Deeside College) and Monmouthshire (Coleg Gwent). Tables showing the full cohort, including the 1.7 per cent of learners with postcodes outside Wales, are available on the StatsWales dissemination site.
• Learners enrolled at multiple providers during the course of an academic year have been included once at each provider with whom they are enrolled. This methodology ensures that all provision received by a learner throughout the year is represented, however, it does introduce an element of double-counting and differs to that used in other statistical publications, most notably the Statistical First Release SDR 51/2012 which provides counts of unique learners.
2.3 Provider type
• For the purposes of this bulletin the term ‘provider type’ is used to define the nature of the training provider as distinct from the type of learning provision.
Welsh Further Education Institutions – following several college mergers there were 21 Further Education Institutions (FEIs) in Wales during the 2010/11 academic year. Learning provision at these FEIs included further education, work-based learning and community learning
Other Training providers – there were in the region of 80 Welsh providers in this category during the 2010/11 academic year. They were responsible for work-based learning provision (in addition to that delivered by FEIs).
Local Authority Community Learning – 14 of the 22 local authorities in Wales provide directly delivered community learning.
School Sixth Formsin Wales – 166 maintained schools with sixth forms, in Wales, submitted data to the post-16 PLASC census in January 2011.
English providers – further education colleges and other training providers in England (with enrolments from Welsh domiciled learners) were included in this category.
School Sixth Forms in England – there were Welsh domiciled learners enrolled at 34 maintained school sixth forms in England.
2.4 Subject Areas
• The subject areas detailed in Table 3 are the 15 first-tier areas of learning in the Qualifications and Curriculum Development Agency’s (QCDA) sector subject framework.
Further detail can be found at : www.qcda.org.uk
3. Rounding
• All figures in this Statistical Bulletin are rounded to the nearest 5 and therefore there may be slight discrepancies between the sum of the constituent rows/columns and the independently rounded totals. An ‘*’ represents numbers greater than 0 but less than 5.
4. Key Quality Information
4.1 Relevance
The statistics presented in this bulletin are used both internally within the Welsh Government and externally by other individuals and organisations.
Within the Welsh Government they play a role in supporting decision making processes in relation to:
• Programme for Government – in particular to inform the areas of ‘Education’, where the aim is to “Help everyone reach their potential, reduce inequality and improve economic and social well-being”; one of the ‘Culture and Heritage in Wales’ actions is to “Strengthen the use of Welsh langauge in everyday life”; and in the area of ‘Growth’ one of the key actions is “Improving Welsh skills for employment”.
• The Transformation Agenda – “The Transformation policy, launched in September 2008, challenged all providers of post-compulsory education and training in Wales to set aside traditional, narrow, institutional arrangements and to plan provision collectively; direct more of the funding available to teaching and learning and learner support; and transform the network of providers.”
Transforming Education and Training Provision in Wales
•
The Learning and Skills (Wales) Measure 2009 – “ .. aims to provide wider learner choice, reduce
duplication of provision and encourage higher quality learning and teaching, but it applies to all
post-16 provision. These aims cannot be achieved by any single provider. Consequently providers are
expected to establish effective collaboration to underpin 14-19 entitlement and maximise the chances
of successful learner outcomes.”
Learning and Skills (Wales) Measure 2009
Some of the key users are:
• Ministers and the Members Research Service in the National Assembly for Wales;
• Policy officials in the Welsh Government including those involved with regional consortia; • Other government departments;
• Office for National Statistics;
• Students, researchers, and academics;
• Individual citizens, private companies, and the media.
In addition to the specific education policy agenda detailed above these statistics are used in a variety of ways. Some examples of these are:
• general background and research; • inclusion in reports and briefings; • advice to Ministers;
• ad-hoc analysis requested by external bodies.
4.2 Accuracy
• The LLWR data collection requires providers to record an expected end date and an actual end date for every learning activity. Prior to 2008/09 the actual end date was used when deriving learning activity, learning programme and learner counts. However, further investigation of the data showed that not all providers fulfil the requirement to submit an actual end date on completion of the
learning activity and hence the decision was taken in 2008/09 to modify the methodology used. To obtain more accurate counts an adjusted population was introduced which excludes those activities where the expected end date is two years earlier than the start of the reported academic year. This methodology has also been used retrospectively against 2006/07 and 2007/08 data for the purpose of year on year comparisons.
• Learner postcodes taken from the source data are mapped against information held on a postcode database in order to establish the country and local authority of domicile. The postcode database is updated regularly by the Welsh Government’s Knowledge and Analytical Services on receipt of the latest information supplied by the Office for National Statistics. The database available for this Learning Network Analysis bulletin contained all UK postcodes rather than only Wales’ postcodes as in previous years. This additional coverage enabled enhanced analysis to differentiate between learners with unknown/unidentifiable postcodes and those resident in England, Scotland or Northern Ireland.
• As detailed in 2.2, learners that were enrolled at multiple providers during the course of the academic year have been included once at each provider with whom they were enrolled. For example, learners pursuing learning at a further education institution in addition to being enrolled with a local authority community learning provider will be counted twice. This differs to the methodology used in other statistical publications.
• As previously indicated, from 2007/08 there was a change in the way in which data on FE learners on WfA courses was collected. The majority of these learners who would previously have been recorded on the LLWR are now reported to HESA by the five Welsh HE institutions acting as regional centres for WfA provision. WfA courses at the sixth regional centre, Coleg Gwent, are included in this bulletin as this data is still submitted via the LLWR.
4.3 Timeliness and Punctuality
Statistics for a given academic year are derived from a statistical freeze of data based on the LLWR at a date in February/March following the end of the academic year. The Learning Network Analysis
bulletin is then produced and published as soon as possible following the publication of the First Release in March/April (SDR 51/2012).
4.4 Accessibility and Clarity
This statistical bulletin is pre-announced and then published on the Statistics section of the Welsh
Government website. It is accompanied by more detailed tables on StatsWales where users can view and create tables then download as required.
4.5 Comparability
• Figures in this bulletin use the same data sources and underlying methodology as in last year’s bulletin but with the addition of data for school sixth forms in England;
Learning Network Analysis - 2009/10
• The tables based on DfES’ predecessor department were presented by geographic area and these can still be reproduced using the reports generated on StatsWales. These geographical areas remain as defined in 2008/09.
North Wales: Anglesey, Gwynedd, Conwy, Denbighshire, Flintshire, Wrexham
Mid Wales: Powys, Ceredigion
South West Wales: Pembrokeshire, Carmarthenshire, Swansea, Neath Port Talbot
South East Wales: Bridgend, Vale of Glamorgan, Rhondda Cynon Taf, Merthyr Tydfil, Caerphilly, Blaenau Gwent, Torfaen, Monmouthshire, Newport, Cardiff
• Demographic information on the post-16 learning sector in England, Scotland and Northern Ireland can be found at the following links:
England - The Data Service
Scotland - Scottish Funding Council
Northern Ireland - Department for Employment & Learning
Care should be taken when making direct comparisons between nations due to differences in definition and methodology.
5. Additional Information
5.1 StatsWales
• Tables associated with this bulletin and containing a greater amount of detail are available on the Welsh Government’s interactive data dissemination service StatsWales.
Learning Network Analysis - StatsWales tables
• These tables provide learner, learning programme and learning activity data at national, regional and local authority level as required. In addition, tables are available which also include recorded learners with unknown or unidentified postcodes.
• The scope of the analysis covers the diversity strands of ethnicity, disability and medium of delivery in addition to subject area and qualification type information.
5.2 Other Welsh Government post-16 education outputs using the data sources named in Note 1.
• Further Education, Work-based Learning and Community Learning in Wales, 2010/11 and December 2011 (early figures) – headline national trends in volumes of learning, published 28 March 2012. (LLWR)
Further Education, Work-based Learning and Community Learning in Wales 2010/11
• Analysis of Participation in Post-16 Education and Training 2009/10 – bulletin providing analysis of participation in learning at a national and regional level across the Further Education, Work Based Learning, Community Learning, school Sixth Form and Higher Education level sectors. Bulletin published October 2011. (LLWR, post-16 PLASC, HESA, ILR)
Analysis of Participation in Post-16 Education and Training 2009/10
• National Comparators 2010/11 – statistics on learner outcomes at FE and WBL providers, published 5 April 2012. (LLWR)
National Comparators for Further Education and Work-based Learning 2010/11
• Learner Outcome Measures for Adult Community Learning 2010/11, published 25 April 2012. (LLWR)