RESEARCH PAPER
04/19
1
M
ARCH2004
Social Indicators
This Research Paper summarises a wide range of social
statistics. Subjects covered include crime and justice,
defence, education, elections, health and population.
Regular updates of individual pages, together with
spreadsheets containing raw data, are available to
members and staff on the parliamentary intranet.
This edition includes:
Article: EU enlargement:
Basic Indicators for accession countries
Topical subject pages:
- Mathematics: study and teacher recruitment
- The MMR vaccine
Adam Mellows-Facer - Editor
S
OCIAL&
G
ENERALS
TATISTICSRecent Library Research Papers:
04/04
The
Human Tissue Bill
[Bill
9
of
2003-04]
08.01.04
04/05
Armed Forces (Pensions and Compensation) Bill
[Bill 10 of 2003-04]
08.01.04
04/06
Unemployment by Constituency, December 2003
14.01.03
04/07
The
Civil Contingencies Bill
[Bill 14 of 2003-04]
15.01.04
04/08
The
Higher Education Bill
[Bill
35
of
2003-04]
21.01.04
04/09
The
Fire and Rescue Services Bill
[Bill 38 of 2003-04]
22.01.04
04/10
The
Sustainable and Secure Buildings Bill
[Bill 15 of 2003-04]
29.01.04
04/11
Economic Indicators [includes article: Consumer Borrowing]
02.02.04
04/12
The
Scottish Parliament (Constituencies) Bill
[Bill 4 of 2003-04]
03.02.04
04/13
Carers (Equal Opportunities) Bill
[Bill 16 of 2003-04]
03.02.04
04/14
Unemployment by Constituency, January 2004
11.02.04
04/15
The
Gender Recognition Bill
[HL] [Bill 56 of 2003-04]
17.02.04
04/16
Burma
23.02.04
04/17 The
Gangmasters (Licensing)
Bill [Bill 17 of 2003-04]
25.02.04
04/18
Pensions Bill
[Bill
57
of
2003-04] 25.02.04
Research Papers are available as PDF files:
• to members of the general public on the Parliamentary web site,
URL:
http://www.parliament.uk
• within Parliament to users of the Parliamentary Intranet,
URL:
http://hcl1.hclibrary.parliament.u
k
Library Research Papers are compiled for the benefit of Members of Parliament and their
personal staff. Authors are available to discuss the contents of these papers with Members and
their staff but cannot advise members of the general public. Any comments on Research
Papers should be sent to the Research Publications Officer, Room 407, 1 Derby Gate, London,
SW1A 2DG or e-mailed to [email protected]
CONTENTS
I
Introduction to Social Indicators
i
II
Contacts for further information
ii
III
Article: EU enlargement: Basic indicators for accession countries
iii
IV
Topical subject pages
vi
A Mathematics: study and teacher recruitment
vii
B The MMR vaccine
viii
V
Regular subject pages
1 Agriculture
1
2
Crime and justice
3
3 Defence
9
4 Education
12
5 Elections
20
6
Environment and energy
26
7 Health
28
8 Housing
33
9 Local
government
37
10
Population and migration
39
11 Social
security
45
12 Transport
47
List of regular subject pages
Agriculture
Agricultural
incomes
and
subsidies
1
Agricultural
labour
and
output
2
Crime and justice
Police numbers
3
Police
funding
4
Crime
5
Crime:
international
comparisons
6
Drug misuse
7
Prison
population
8
Defence
Defence
employment
9
Defence
expenditure
10
Defence
exports
11
Education
Class sizes
12
Schools
13
Teachers
14
Examination results
15
Participation:
16-18
year
olds
16
Applicants and entrants to higher education
17
Participation
in
higher
education
18
Education
expenditure
19
Elections
General
Election
results
20
Other elections
21
Turnout
22
Voter characteristics
23
Opinion
polls
24
Environment and energy
Road fuel prices
25
Energy and CO
2emissions
26
Health
Waiting lists
27
Health
expenditure 28
Beds
and
activity
29
Community care
31
Housing
Dwellings
completed
32
House prices
33
Homelessness
34
Rough
sleeping
35
Local government
Local
government
finance 36
Council
tax 37
Population and migration
Population 38
Infant
deaths
and
life
expectancy
39
International
migration
40
Asylum seekers
41
Asylum
decisions
42
Ethnicity
and
religion
43
Social security
Social
security
benefits
and
expenditure
44
Pensions
and
pensioners’
incomes
45
Transport
Road
accident
casualties
46
Road traffic
47
Public
transport
48
Rail
performance
and
fares
49
Freight
50
Miscellaneous
Internet access
51
I
Introduction to Social Indicators
Social Indicators consists of a series of subject pages that cover a wide range of social
statistics. The pages are individual Standard Notes, available to MPs and staff on the
PDVN, and are updated when new statistics are available. The subject pages combined in
a printed Research Paper three times a year. Each edition of the Research Paper includes
an article and topical subject pages.
The Social Indicators intranet pages enable MPs and staff to download underlying data in
the form of spreadsheet files.
1These files often include more detailed statistics and
longer time series.
Subjects have been chosen from those that receive the most public attention and those that
we think are most useful to MPs. These include some international comparisons
alongside nationally based statistics. Every attempt has been made to match the
geographical coverage of these topics to the powers of the UK parliament. Where
possible, links are included on the intranet pages to statistics that cover the rest of the UK.
The coverage of Social Indicators is intended to be complementary to the Economic
Indicators Research Paper, which is produced by the Economic Policy and Statistics
section.
The range of topics included in Social Indicators and the content of the intranet pages is
regularly reviewed. If you have views on either, please contact the Head of Section,
Richard Cracknell (x4632) or the editor, Adam Mellows-Facer (x6969).
1
http://hcl1.hclibrary.parliament.uk/sections/stats/socialindicators/socialindicators.htm
ii
II
Contacts for further information
Members and staff who require further information on a particular subject should contact
the relevant statistician as detailed below. A comprehensive guide to the subject coverage
of Research Service specialists is available in
Who Does What in Research
.
Subject Statistician Ext Statistician Ext
Agriculture Matthew Whittaker 6789 Richard Cracknell 4632
Charities Gavin Berman 3851 Adam Mellows-Facer 6969
Civil Service Matthew Whittaker 6789 Adam Mellows-Facer 6969
Crime & Police Gavin Berman 3851 Ross Young 4313
Defence Gavin Berman 3851 David Knott 2454
Deprivation Richard Cracknell 4632 Adam Mellows-Facer 6969
Education David Knott 2454 Gavin Berman 3851
Elections Adam Mellows-Facer 6969 Ross Young 4313
Energy Matthew Whittaker 6789 Ross Young 4313
Environment Matthew Whittaker 6790 Ross Young 4313
Gambling/Lottery Gavin Berman 3851 Adam Mellows-Facer 6969
Health Services Adam Mellows-Facer 3851 David Knott 2454
Housing Gavin Berman 3851 Matthew Whittaker 6789
Immigration Ross Young 4313 Matthew Whittaker 6789
Local Government Finance Gavin Berman 3851 David Knott 2454
Media/Arts Gavin Berman 3851 Adam Mellows-Facer 6969
Monarchy Matthew Whittaker 6789 David Knott 2454
Parliament Richard Cracknell 4632 Ross Young 4313
Population Richard Cracknell 4632 Ross Young 4313
Religion Gavin Berman 3851 Adam Mellows-Facer 6969
Science Matthew Whittaker 6789 Ross Young 4313
Social Security Richard Cracknell 4632 Ross Young 4313
Social Services Matthew Whittaker 6789 Adam Mellows-Facer 6969
Sport Gavin Berman 3851 Adam Mellows-Facer 6969
Statistics Richard Cracknell 4632 David Knott 2454
ix
III EU
Enlargement:
Basic indicators for accession countries
On 1 May 2004, ten countries will accede to the European Union: Cyprus, the Czech Republic, Estonia, Hungary, Latvia, Lithuania, Malta, Poland, the Slovak Republic and Slovenia. Three further countries, Bulgaria, Romania and Turkey applied for EU membership. Bulgaria and Romania hope to join by 2007, while Turkey is not currently negotiating its membership.
Audiovisual Library European Commission
Land, population and GDP per head
Land area km2 Population 000s GDP per head in PPP
2002 2001 2001
Czech Republic 78,866 10,283 13,700 Estonia 45,227 1,364 9,240 Cyprus 9,251 762 17,180 Latvia 64,589 2,355 7,750 Lithuania 65,300 3,478 8,960 Hungary 93,030 10,188 12,250 Malta 316 393 .. Poland 312,685 38,638 9,410 Slovenia 20,273 1,992 16,210 Slovak Republic 49,035 5,397 11,200
Acc. Countries 738,572 74,850 10,700
Austria 83,858 8,130 25,740 Belgium 30,538 10,285 25,260 Denmark 43,094 5,359 26,660 Finland 338,150 5,188 24,170 France 549,087 59,191 23,870 Germany 357,031 82,350 24,000 Greece 131,957 10,582 15,020 Ireland 70,295 3,854 27,360 Italy 301,338 57,075 23,860 Luxembourg 2,586 442 44,160 Netherlands 35,518 16,046 26,670 Portugal 91,916 10,299 16,059 Spain 505,124 40,266 19,510 Sweden 449,974 8,896 23,700 United Kingdom 244,101 60,004 23,530
EU15 3,234,568 377,850 23,210
Bulgaria 110,910 7,910 5,710 Romania 238,391 22,408 5,560 Turkey 769,604 68,670 5,230
PPP= Purchasing Power Parity
ix
Population growth, infant mortality and life expectancy, 2001
Male Female
Czech Republic -0.3 4.0 72.1 78.5
Estonia -4.2 8.4 65.6 76.4
Cyprus +2.3 5.6 75.3 80.4
Latvia -7.8 11.0 64.5 75.6
Lithuania -3.3 8.6 67.5 77.7
Hungary -2.5 8.1 67.2 75.7
Malta +8.2 4.4 75.1 79.3
Poland -0.3 7.7 70.2 78.4
Slovenia +2.0 4.2 72.7 80.1
Slovak Republic -4.3 6.2 69.4 77.6
Acc. Countries -1.2 7.2 69.3 77.5
Austria +2.2 4.8 75.4 81.2
Belgium +4.3 5.0 74.6 80.8
Denmark +3.6 4.9 74.3 79.0
Finland +2.7 3.2 74.6 81.5
France +5.2 4.6 75.5 83.0
Germany +2.2 4.5 74.7 80.7
Greece +3.2 5.9 75.4 80.7
Ireland +14.7 5.8 73.0 78.5
Italy +3.0 4.3 76.7 82.9
Luxembourg +10.2 5.9 74.9 81.3
Netherlands +7.4 5.4 75.7 80.6
Portugal +7.1 5.0 73.5 80.3
Spain +7.1 3.9 75.6 82.9
Sweden +3.0 3.7 77.5 82.1
United Kingdom +3.7 5.5 75.7 80.4
EU15 +4.1 4.6 75.2 81.2
Bulgaria -4.8 14.4 68.5 75.1
Romania -2.0 18.4 67.7 78.8
Turkey +1.8 38.7 66.4 71.0
Life expectancy (years) Population growth per
1,000
Infant mortality per 1,000 live births
With the exception of Slovenia, the populations of the Eastern European accession countries fell in 2001. The combined populations of the accession countries fell by 0.12 percent while the population of EU15 rose by 0.41 percent.
There is considerable variation in infant mortality rates. Overall, the rate is higher in the accession countries than in the EU15, but in the Czech Republic, Malta and Slovenia it is lower than the EU15 average. On average, life expectancy is six years lower in men and four years lower in women in the accession countries than in the EU15.
Agriculture's contribution to the economy - 2001
0.6 0.9 1.2 1.5 1.9 2.3 2.4 2.7 2.7 2.8 2.9 3.1 3.4 3.4 3.5 3.6 3.8 4.0 4.2 4.3 4.6 4.7 5.8 7.0 7.1 11.3 13.7 14.6
0 2 4 6 8 10 12 14 16
Luxe m bo urg Unite d Kingdo m Germ any Be lgium Sweden Aus tria Ma lta Ita ly Ne therlands France De nm a rk S lo ve nia Spain F inla nd Irela nd P o rtuga l P o la nd C yprus Cze ch Re public Hungary Slo vak Re public Latvia Es to nia Gree ce Lithua nia Turke y Bulga ria Ro ma nia
% o f gro s s value a dded
ix Public support for enlargement
The chart below summarises the results of a recent survey of the opinions towards EU enlargement of residents of EU15 states:
Support for EU enlargement: Current Member States
% of respondents, Oct-Nov 2003
-80 -60 -40 -20 0 20 40 60 80
Gre Den S pa Ita Ire S we Fin P o r Net Lux B el Aut UK Ger Fra
Euro baro me ter Oc t-No v 2003 F o r Aga ins t Net (F o r minus Agains t)
Across the EU15, more people support enlargement than oppose it. On average 47 percent of EU15 citizens are in favour of enlargement and 36 percent against, with a further 18 percent who “don’t know”.
In nine Member States those who favour enlargement outweigh those against it. However, in Belgium, Austria, the UK, Germany, and France, a majority of those expressing an opinion are against enlargement.
The chart below summarises opinion towards EU membership in the accession countries:
Support for EU membership - Accession States
% of respondents, Oct 2003
0 20 40 60 80 100
C yprus
S lo va kia
Hungary
Lithua nia
M alta
P o land
S lo ve nia
La tvia
Czech Re p
Es to nia
Ro ma nia
Bulgaria
Turke y
Go o d Neither go o d no r bad/DK Bad
Euro baro m eter Oc t 2003 C andidate C o untry s urve y
ix Further information and links
The House of Commons Library EU enlargement subject page, available on the Parliamentary intranet, links to a variety of Standard Notes and Research Paper.
Of particular interest may be House of Commons Library Research Paper 03/48,
Enlargement and the European Union (Accessions) Bill
www.parliament.uk/commons/lib/research/rp2003/rp03-048.pdf
Appendix 1 contains a profile of the economic and political situation in accession states.
Foreign & Commonwealth Office site – includes country profiles
http://www.fco.gov.uk/servlet/Front?pagename=OpenMarket/Xcelerate/ShowPag e&c=Page&cid=1007029392925
European Commission enlargement site – includes detailed profiles http://www.europa.eu.int/comm/enlargement/index_en.html
EU Key indicators leaflet
http://europa.eu.int/comm/enlargement/docs/pdf/eurostatapril2003.pdf
European Parliament enlargement information
http://www.europarl.eu.int/enlargement/default_en.htm
Eurostat Statistical Yearbook of Candidate Countries (2003)
http://www.eu-datashop.de/download/DE/inhaltsv/thema1/candi.pdf
Eurobarometer (public opinion surveys by the European Commission in EU15 and candidate countries)
Mathematics: study and teacher recruitment
Update on request Contact: David Knott x2454 or Gavin Berman x3851
Mathematics degree applicants and acceptances: UK
Numbers
Mathematics % all Mathematics % all
applicants applicants acceptances acceptances
1996 3,839 0.92 4,141 1.52
1997 3,816 0.83 4,245 1.38
1998 3,887 0.87 4,138 1.37
1999 3,989 0.90 4,152 1.35
2000 3,925 0.89 4,049 1.30
2001 3,863 0.85 4,006 1.22
2002 3,325 0.72 3,840 1.11
Source: UCAS Annual Datasets, various years • Recruitment to mathematics initial teacher training courses has risen in each
year since 2000/01.
• The percentage shortfall between actual recruitment and places available decreased from 35 percent in 2000/01 to 16 percent in 2003/04.
• Acceptances to study mathematics at degree level have declined as a percentage of total acceptances in each year, from 1.4 percent in 1997 to 1.1 percent in 2002.
• Mathematics ranked 28th in terms of degree course acceptances by subject in 2002. Biology ranked 21st, chemistry 39th and physics 43rd. Computer science ranked the top subject by this measure.
Degree acceptances by subject: UK Top ten and science subjects, thousands, 2002
2.9 3.0
3.8 4.9
7.0 7.1 7.1
8.5 10.7
11.5 12.0
13.1 13.7
14.1
0 2 4 6 8 10 12 14 16
Physics Chemistry Mathematics Biology Teacher training Social studies/bus/law with languages Electronic and electrical engineering English Business studies Psychology Management studies Law Design studies Computer science
Recruitment to mathematics initial teacher training: England
Academic year
Actual Places % shortfall
1997/98 1,460 2,370 38
1998/99 1,120 2,270 51
1999/00 1,300 1,810 28
2000/01 1,290 1,980 35
2001/02 1,550 1,940 20
2002/03 1,670 1,940 14
2003/04p 1,950 2,315 16
p - provisional
Source: DfES School Workforce in England, various years
The MMR vaccine
Next update: On request Contact: Adam Mellows-Facer x6969 or David Knott x2454
• Latest Health Protection Agency data show that combined measles, mumps and rubella vaccine (MMR) uptake across the UK by second birthday was 79.8 percent between July and September 2003. An immunisation rate of at least 95 percent is required in order to achieve ‘herd immunity’.
• MMR immunisation rates in England have fallen by 10 percentage points since 1995/96 to 82 percent in 2002/03.
• There is considerable regional variation in uptake. 58 percent of children in Kensington and Chelsea Primary Care Trust area were immunised by their second birthday in 2002/03, compared to 92 percent in West Cumbria.
MMR immunisation rates: England 1991/92 - 2003/03 Proportion of children in appropriate cohort immunised by second birthday
89.9 91.6
90.8 91.0 91.9 91.5 90.8
88.3
87.6 87.4
84.1
81.8
76 78 80 82 84 86 88 90 92 94
91/92 92/93 93/94 94/95 95/96 96/97 97/98 98/99 99/00 00/01 01/02 02/03
MMR immunisation rates by region: 2002/03 Proportion of children in appropriate cohort immunised by second birthday
86.8
85.3
84.4
84.0
83.9
83.4
83.0
81.5
72.5
81.8
65 70 75 80 85 90
East Midlands
North East
Yorkshire & The Humber
West Midlands
North West
South West
East of England
South East
London
England
Highest and lowest MMR immunisation rates by PCT
England 2002/03, % immunised by second birthday
West Cumbria 92.5
Eastern Leicester 92.3
Staffordshire Moorlands 92.3
North East Oxfordshire 92.0
Hinckley and Bosworth 91.8
North Stoke 91.3
South Stoke 91.2
Charnwood and NW Leicestershire 91.0
Wandsworth 66.9
Lewisham 66.0
Bexley 64.5
Guildford and Waverley 64.1
Hammersmith and Fulham 63.6
Lambeth 63.2
Greenwich 58.9
Kensington and Chelsea 57.9
Agricultural incomes and subsidies
Next Update: March 2004 Contact: Richard Cracknell x4632 or Matthew Whittaker x6789
• Provisional estimates suggest that, in 2003, total income from farming (TIFF) continued to recover from its all-time low in 2000, increasing 28 per cent year-on-year.
• TIFF per full time person equivalent is estimated to have risen by 32 per cent in real terms in 2003, reaching £15,500, as the long-term downward trend in the number of farmers continued.
• The largest increases in TIFF in recent years were in the early 1990s. TIFF increased by over a third in 1993 alone. In 1995, TIFF in the UK was £6.5 billion at today’s prices.
• Total spending under the CAP and on national grants and subsidies is forecast at £3.1 billion in 2002/03. Around one-third is under the Arable Area Payments Scheme. Around 85 percent of total spending is EU-funded.
Public expenditure under CAP and national schemes
2002/03 forecast - £ million and proportion of total
Other (inc capital grants) 12 0%
Arable area payments scheme
1,037 34%
Subsidies on production (inc agri-environment)
485 16%
CAP Market support 700 22%
Livestock subsidies 885 28%
Real farm incomes in the UK: 1990 - 2003
At 2003 prices
Total income from farming (TIFF)
TIFF per whole-time person equivalent
£ billion £ per head
1990 2.9 11.3
1997 3.4 14.3
1998 2.5 10.4
1999 2.4 10.7
2000 1.8 8.2
2001 2.1 9.5
2002 2.5 11.7
2003 3.2 15.5
Total income from farming 1973 to 2003
percentage change on previous year
-50% -40% -30% -20% -10% +0% +10% +20% +30% +40% +50%
1973 1975 1977 1979 1981 1983 1985 1987 1989 1991 1993 1995 1997 1999 2001 2003
Agricultural labour and output
Next update: March 2004 Contact: Richard Cracknell x4632 or Matthew Whittaker x6789
• The total labour force in UK agriculture has decreased in each year since 1984. In the year to June 2003 there was a fall of 18,000, or 3 percent.
• The volume of agricultural production has been fairly stable since the mid-1980s. However, within this total there have been very different trends. Production of wheat, oilseeds, sugar beet and poultry has increased since 1985, while barley, fruit, vegetables, cattle, pigs, sheep and milk have all declined.
• In 2002 output grew for cereals, industrial crops (oilseeds, hops etc), horticulture and livestock (particularly cattle and sheep in the wake of foot and mouth disease). There were falls for fruit, potatoes and other crops.
Labour force in agriculture: UK, 1990-2003
Thousands, at June
Workers
Farmers, partners, directors and spouses
Total labour force
1990 282 374 656
1997 243 368 611
1998 245 363 608
1999 230 356 586
2000 204 353 557
2001 198 352 550
2001 202 367 568
2002 194 357 550
2003 171 349 533
Notes: Results from 1998 are not consistent with previous years
Source: DEFRA, Agricultural and Horticultural Census: 2 June 2003
Results for 2001 including the effect of improvements in data for England are not comparable with previous years
UK agricultural output by sector
percentage change 2001 to 2002
-30.3%
-2.9% -2.6%
+1.0%
+10.1%
+21.1% +9.5%
-40% -30% -20% -10% +0% +10% +20% +30% +40%
Other crops Potatoes Fruit Forage plants Industrial crops Cereals Total
UK labour force in agriculture: annual changes, 000s
-1.0
-10.0 -7.0
-8.0
-14.0 -2.0
-14.0 -6.0
-2.0
-8.0 -6.0
-4.0 -5.0
-3.0
-22.0
-29.0 -7.0
-17.9 -17.6
-30 -25 -20 -15 -10 -5 0
Police numbers
Next update: Spring 2004 Contact: Gavin Berman 3851 or Ross Young x4313
• At the end of August 2003 police strength stood at 136,386, the highest ever number of full time equivalent officers.
• Police forces recruited 11,104 officers over the 12 months to March 2003, 9 percent more than the previous year.
• The proportion of women in the police service in England and Wales has increased steadily from 7 percent in March 1977 to 19 percent by March 2003.
• On 31 March 2003, there were 3,868 minority ethnic officers in the 43 police forces of England and Wales. Ethnic minority strength as a proportion of total police service strength has increased from 1.0 percent in 1989 to 2.9 percent by March 2003.
Six month changes in police officer strength
England and Wales 1997-2003
35
-296
-48 -135
-583 -702
-1,224 416
1,096 1,549
2,372
1,945 1,818
-1,500 -1,000 -500 0 500 1,000 1,500 2,000 2,500 3,000
Mar 97 Sep 97 Mar 98 Sep 98 Mar 99 Sep 99 Mar 00 Sep 00 Mar 01 Sep 01 Mar 02 Sep 02 Mar 03
Police officer strength, England and Wales 1979 - 2003
Full time equivalents including secondments at 31st March
100,000 105,000 110,000 115,000 120,000 125,000 130,000 135,000 140,000
1979 1981 1983 1985 1987 1989 1991 1993 1995 1997 1999 2001 2003
Total police officer strength, England and Wales 1997-2003
Full time equivalents at 31 March
Total
excluding Total
secondments Number % Number % strength
1997 125,051 18,781 15.0% 2,150 1.7% 127,158
1998 124,756 19,606 15.7% 2,483 2.0% 126,814
1999 123,841 19,885 16.1% 2,520 2.0% 126,096
2000 121,956 20,155 16.5% 2,734 2.2% 124,170
2001 123,476 21,174 17.1% 2,955 2.4% 125,682
2002 127,267 22,784 17.9% 3,362 2.6% 129,603
2003 131,426 25,139 19.1% 3,868 2.9% 133,366
Source: Home Office Statistical Bulletin, Police Service Strength, England & Wales,
Female Ethnic minority
Of which:
Police funding
Next update: Spring 2004 Contact: Gavin Berman x3851 or Ross Young x4313
• External provision for police forces in England and Wales consists of all Home Office police grants, Revenue Support Grant (RSG) and Business Rates (NNDR).
• Gross revenue expenditure, in real terms, increased every year between 1996/97 and 2003/04, except 2002/03.
• In 2001/02 80 percent of police forces’ gross revenue expenditure was financed through government. In 2003/04 this proportion is expected to fall to less than 70 percent. This was due to a large fall in real Home Office police grants.
• The amount of police expenditure financed through council tax has doubled, in real terms, between 1996/97 and 2003/04.
• Council tax now accounts for 20 percent of police force expenditure finance, compared to 12 percent in 2001/02.
Revenue Home Gross
Business support Office Council Net Generated revenue
rates grant grants Tax req'ment income expend.
1996/97 1,205 1,650 3,796 932 7,583 272 7,854
1997/98 1,125 1,652 3,777 1,028 7,582 331 7,913
1998/99 1,086 1,626 3,925 1,103 7,740 259 7,998
1999/00 1,158 1,583 3,890 1,176 7,806 371 8,177
2000/01 1,190 1,238 4,411 1,127 7,965 552 8,518
2001/02 1,022 1,064 5,094 1,095 8,275 696 8,971
2002/03 1,268 1,439 3,888 1,581 8,175 709 8,885
2003/04 740 1,903 4,070 1,942 8,655 956 9,611
Note: Adjusted using April 2003 GDP deflator Source: CIPFA, Police statistics
Police funding and expenditure, England and Wales 1996/97 to 2003/04
2001/02 prices, £ million
Proportion of expenditure financed through external provision
84.7%
82.8% 83.0%
81.1% 80.3%
74.2%
69.8% 80.0%
60% 65% 70% 75% 80% 85% 90%
1996/97 1997/98 1998/99 1999/00 2000/01 2001/02 2002/03 2003/04
Proportion of expenditure financed through council tax
11.9%
13.0% 13.8%
14.4%
13.2%
12.2%
17.8%
20.2%
0% 5% 10% 15% 20% 25%
Crime
Next update: July 2004 Contact: Gavin Berman x3851 or Ross Young x4313
• There are two main measures of crime: the number of crimes recorded by the police and crimes measured under the British Crime Survey (BCS).
• The BCS measures crimes against adults (16 and over) living in private households in England and Wales. The 2002/03 BCS estimate for such crimes was 12.3 million, a decrease of 2 percent on 2001/02.
• 5.9 million offences were recorded by the police in the year to March 2003, a 7% increase over the previous years figure. After estimating for the effects of the recently implemented National Crime Recording Standard the total number of offences recorded fell by 3 percent.
• It is estimated that total crimes recorded in 2002/03 were 10 percent higher than they would have been under pre-NCRS recording. Recorded Violence against the Person (VATP) crime was estimated to be 23 percent higher and burglary from a dwelling 3 percent higher than otherwise would have been the case. Drug offence figures are unaffected. The figures in the chart below have been adjusted for the NCRS effect.
Trends in recorded crime by offence
Index 1997/98 = 100
VATP
Burglary (dwelling)
Drug offences
Total all offences
60 70 80 90 100 110 120 130
1997/98 1998/99 1999/00 2000/01 2001/02 2002/03
% change in BCS crime 1981 - 2002/03
+8%
+12% +13%
+23%
+3%
-14%
-10% -10%
-6% -2%
-20% -15% -10% -5% 0% 5% 10% 15% 20% 25%
1981-83 1983-87 1987-91 1991-93 1993-95 1995-97 1997-99 1999-00 00-01/02 02/03
Annual % change in police recorded crime: 1982 - 2002/03
+10%
-0% +8%
+3% +7%
+1%
-5% +4%
+17% +16%
+6%
-1%
-5% -3%
-1%
-9% -1%
+4%
-2% +7% +7%
-15% -10% -5% 0% 5% 10% 15% 20%
1982 1984 1986 1988 1990 1992 1994 1996 98/99 00/01 02/03
Crime: international comparisons
Next update: Autumn 2004 Contact: Gavin Berman x3851 or Ross Young x4313
• Due to difference in recording practices absolute comparisons between recorded crime levels in different countries may be misleading. However, the definition of homicide is similar in most countries.
• The police in England and Wales recorded 1.6 homicides per 100,000 population in 1999-2001. In Scotland 2.2 homicides per 100,000 population were recorded, compared to 2.7 in Northern Ireland.
• The United States has the highest homicide rate of major developed countries, 5.6 per 100,000 in 1999-2001. In South Africa the rate in 1998-2000 was 55.9 homicides per 100,000 population.
• The homicide rate in London is above that in Paris and Berlin but well below that in New York.
• Contact crimes are robbery, assaults with force and sexual assaults.
Homicides per 100,000 population, 1999-2001 Excludes 11 September 2001 attacks
5.6 3.1
2.9 2.8 2.8 2.6 2.3 2.2 2.0 1.9 1.8 1.8 1.5 1.4 1.2 0.6
8.7 8.1 1.6
1.2
0 2 4 6 8 10
Belfast Amsterd. Brussels Vienna Stockholm London Berlin Helsinki Paris Dublin Madrid Copenhag Lisbon Edinburgh Rome Athens
Wash.DC New York San Fran. Sydney Tokyo
Homicides per 100,000 population, 1999-2001
5.6
2.9 2.7
2.2
1.9 1.8 1.8 1.7
1.6 1.5 1.5 1.4 1.4
1.2 1.2 1.2 1.1 1.1 1.1 1.0
0 1 2 3 4 5 6
USA Fin NI Sco Aus Bel Can Fra E&W Net Ita Ire Gre Aut Por Ger Spa Swe Jap Den
Victimisation rate
% victim of contact crime once or more in 1999
4.1
3.6
3.4 3.4 3.2
2.8
2.4 2.3
2.2 2.2 2.1
2.0 1.9 1.8
1.5 1.4
0.4
0 1 2 3 4 5
Aus E&W Sco Can Fin Pol NI Den Fra Swe Swi Net USA Bel Spa Por Jap
Drug misuse
Next update: October 2004 Contact: Ross Young x4313 or Gavin Berman x3851
• In 2002/03 82,000 highest ever recorded number of drug mis-users presented for treatment for the first time in England, an increase of 7 percent on 2001/02.
• The number of drug users starting agency episodes in 2002/03 was more than double the total recorded in 1993/94.
• 18 percent of drug mis-users who were in treatment during 2002/03 successfully completed their treatment. 40 percent were still in at the end of March 2003.
• Between 1990 and 2000 the number of seizures of controlled substances doubled from 61,000 to 124,000. Cannabis was the controlled substance seized most frequently, accounting for 73 percent of all seizures in 2000, compared to heroin (13 percent) and ecstasy (8 percent).
• The Home Office has not published data relating to drug seizures for periods later than 2000 (last published in 2002). A review of statistical outputs is currently in progress, primarily to ensure that UK statistics are harmonised with those relating to seizures and drug offending published across the EU.
Seizures of drugs, 1997-2000
UK, 000s
24.8 28.8
30.9 34.1 120.0
127.7
108.3
96.1
0 20 40 60 80 100 120 140
1997 1998 1999 2000
Class A Class B
Users starting agency episodes
England, 000s
50.8
45.9
57.1
62.4 66.3
77.3
82.4
0 10 20 30 40 50 60 70 80 90 100
1996/97 1997/98 1998/99 1999/00 2000/01 2001/02 2002/03
Treatment outcomes, 2002/03
England
Retained 39%
Dropped out 36% Successfully
completed 18%
Other completion 6%
Prison 1%
Prison population
Next update: Spring 2004 Contact: Gavin Berman x3851 or Ross Young x4313
• The prison population reached an all-time high of 74,594 on 20 February 2004, an increase of 3.6 percent over the year.
• That total is 7,800 above the certified normal
accommodation of the prison estate and 500 below the maximum safe operational capacity.
• The prison population in post-war England and Wales has been rising steadily. Over the past decade, however, this increase has become more marked. Between 1992 and 2002 the average prison population increased by 55 percent.
• In the UK there were 126 prisoners per 100,000 population in 2001, the second highest rate in Western Europe, after Portugal. The US, which has almost 2 million prisoners, has the highest rate in the developed world (689) while Japan (50) has the lowest.
Prison population, England and Wales, 1901-2002
0 10,000 20,000 30,000 40,000 50,000 60,000 70,000
1901 1906 1911 1916 1921 1926 1931 1936 1941 1946 1951 1956 1961 1966 1971 1976 1981 1986 1991 1996 2001
Prison population 1980-2002 by sex of prisoner
England and Wales, average of monthly totals
Total
1980 40,748 96.4% 1,516 3.6% 42,264
1990 43,378 96.4% 1,597 3.6% 44,975
1997 58,439 95.6% 2,675 4.4% 61,114
1998 62,194 95.2% 3,105 4.8% 65,299
1999 61,523 95.0% 3,247 5.0% 64,770
2000 61,252 94.8% 3,350 5.2% 64,602
2001 62,560 94.4% 3,741 5.6% 66,301
2002 66,562 93.9% 4,299 6.1% 70,861
Sources: Prison statistics, England & Wales 2000 Prison population brief, England & Wales
Females Males
Prison population - Rate per 100,000 population, 2001
689 673
411
128 126 116
96 94 87 85 83 79 77 77 76 60 58
50
0 100 200 300 400 500 600 700 800
Defence employment
Next Update: March 2004 Contact: Gavin Berman x3851 or David Knott x2454
• There have been large-scale reductions in the size of UK regular and reserve force since 1990. These follow from the restructuring set out in Britain’s Defence for the 90s and the Defence Costs Study.
• The Strategic Defence Review (SDR), presented to Parliament in July 1998, proposed that the establishment of the regular Army should increase to 111,300.
• The SDR set targets of full manning of the RAF by 2000, of the Navy by 2002 and of the Army by 2004. At 1st January 2004 the trained strength of the RAF was 850 below requirement. The strength of the Navy was 1,000 below requirement and the Army was 2,900 below requirement
• Between 1 April 1997 and 1 January 2004, the number of UK regular forces fell by 2 percent. Naval service employment fell by 9 percent, and RAF by 6 percent, but Army employment has risen by 4 percent.
• Since 1980 both naval service and RAF employment has fallen by about 40 percent and Army employment by 30 percent.
Excludes locally entered personnel and Gurkhas
Navy Army RAF Officers Other Ranks
1997 45,100 108,800 56,900 32,700 178,200 1998 44,470 109,830 55,840 32,620 177,510 1999 43,700 109,720 55,210 32,240 176,400 2000 42,850 110,050 54,720 32,520 175,100 2001 42,420 109,530 53,700 32,630 173,020 2002 41,630 110,050 53,000 32,750 171,940 2003 41,550 112,130 53,240 33,160 173,770
1 Jan 2004 40,990 112,700 53,220 33,250 173,660
Sources: MoD Statistical Bulletin TSP1, January 2004 & previous editions
Total Regular Forces
UK regular armed forces manpower at 1st April
Annual % change in UK armed forces manpower at April
-5.0%
-0.3%
-0.7% -0.5%
-0.9%
-0.5%
+1.1%
-6% -5% -4% -3% -2% -1% 0% 1% 2%
1997 1998 1999 2000 2001 2002 2003
% change in armed forces personnel 1990-2003
+9% +7%
+1%
-23%
-29% -30% -31% -31%
-34% -35%
-48% -49% -49% -56%
-61%
-25%
-70% -60% -50% -40% -30% -20% -10% +10% +20%
Lux Tur Gre Por Can Den UK USA Ita Fra Ger Spa Net Nor Bel NATO
Defence expenditure
Next update: Summer 2004 Contact: Gavin Berman x3851 or David Knott x2454
• Defence expenditure is planned to be 2.3 percent of GDP in the current financial year, remaining at this level until 2005/06. It has been on a downward trend since 1984/85 when the figure was 5.3 percent.
• Planned real terms defence expenditure is almost 30 percent below the figure in 1984/85.
• Defence expenditure other than that on personnel and equipment has increased as a share of the total since 1997/98. This series is no longer published by the Ministry of Defence.
• Military expenditure as a proportion of GDP has fallen since the 1980s in all NATO member countries except Turkey.
• Between 1985 and 1989, average defence expenditure in NATO member countries was 4.6 percent of GDP. By 2003 this had fallen to 2.7 percent
Miltary expenditure 2003 (% of GDP) est. By NATO definition
4.8
4.2
3.5
2.6 2.4
2.2 2.1
2.0 2.0 1.9 1.9
1.6 1.6 1.4
1.3 1.2 1.2
0.9 2.0
2.7
0 1 2 3 4 5 6
Tur Gre US Fra UK Chz Por Pol Nor Hun Ita Net Den Ger Bel Spa Can Lux NATO
EU NATO
Total
Real annual % change in UK defence budget
-8% -6% -4% -2% +0% +2% +4% +6% +8%
1980-81 1982-83 1984-85 1986-87 1988-89 1990-91 1992-93 1994-95 1996-97 1998-99 2000-01 2002-03 2004-05
Principal headings of the defence budget: 1990/91 - 2000/01
Percentage of total expenditure
Expenditure on personnel
Expenditure on equipment
Other expenditure
1990/91 39.5% 39.6% 20.9%
1991/92 40.5% 39.7% 19.8%
1992/93 44.2% 36.7% 19.1%
1993/94 42.0% 39.3% 18.7%
1994/95 41.3% 39.2% 19.5%
1995/96 39.6% 39.7% 20.7%
1996/97 39.2% 41.3% 19.5%
1997/98 39.6% 43.0% 17.4%
1998/99 38.1% 44.0% 18.0%
1999/00 37.8% 43.0% 19.2%
2000/01 37.2% 42.4% 20.3%
2001/02 n/a n/a n/a
Defence exports
Next Update: October 2004 Contact: Gavin Berman 3851 or David Knott x2454
Constant 2001 US$m / percentage of total in italics
US 19,044 39.0 19,097 44.8 19,877 46.5 13,871 38.8 9,987 37.0 10,241 40.3
UK 7,893 16.1 4,300 10.1 5,530 12.9 7,007 19.6 4,716 17.5 4,700 18.5
Russia 3,018 6.2 2,490 5.8 3,429 8.0 4,312 12.1 4,402 16.3 3,100 12.2
France 7,777 15.9 8,261 19.4 4,646 10.9 2,695 7.5 1,886 7.0 1,800 7.1
Germany 1,393 2.9 1,697 4.0 2,433 5.7 1,401 3.9 629 2.3 500 2.0
Others 9,750 19.9 6,789 15.9 6,858 16.0 6,470 18.1 5,345 19.8 5,100 20.0
Total 48,875 42,634 42,773 35,756 26,965 25,441
Source: International Institute for Strategic Studies, The Military Balance 2003/2004, table 37 Value of arms deliveries and market share
2001
1998 1999 2000
1997 2002
• The global value of arms deliveries fell slightly from US$ 27.0bn in 2001 to US$ 25.4bn in 2002. There has been a downwards trend in evidence since the peak of almost US$ 49bn in 1997. These figures are in constant 2002 US$.
• In 1987 the USSR accounted for over one third of the value of arms deliveries. By contrast, Russia accounted for just 5.7 percent in 1998. The Russian share of the market fell from 16.3 percent in 2001 to 12.2 percent in 2002.
• The US share of the world market was 40.3 percent in 2002, compared with 27.0 percent in 1987. The UK was the second largest exporter with 18.5 percent of the market.
Annual % change in real global value of arms deliveries
12.5%
-12.8%
0.3%
-16.4%
-24.6%
-5.7%
-30% -25% -20% -15% -10% -5% 0% 5% 10% 15%
1997 1998 1999 2000 2001 2002
Arms deliveries market share, %
Russia (USSR) USA
UK
0 5 10 15 20 25 30 35 40 45 50
1987 1988 1989 1990 1991 1992 1993 1994 1995 1996 1997 1998 1999 2000 2001 2002
Class sizes
Next update: May 2004 Contact: David Knott x2454 or Gavin Berman x3851
• The average primary class size is 26 pupils, down from 28 in 1998, but still higher than the average of 24 in 1985.
• The percentage of primary pupils in large classes (>30) declined from 33 percent in 1997 to 16 percent in 2003.
• The average secondary class size has been steady at 22 pupils per class in recent years. The average class size fell during the 1980s before rising to current levels in the 1990s.
• A similar trend is evident for the percentage of secondary pupils in large classes (>30). The proportion of pupils in large classes rose from 6.3 percent in 1991 to 11.7 percent in 2001, but has been steady in the last two years.
Class sizes in primary schools in England
0% 5% 10% 15% 20% 25% 30% 35% 40%
1979 1981 1983 1985 1987 1989 1991 1993 1995 1997 1999 2001 2003
% of pupils in large classes
20.0 21.0 22.0 23.0 24.0 25.0 26.0 27.0 28.0 29.0 Average class size
% of pupils in large classes Average class size
Class sizes in secondary schools in England
0% 2% 4% 6% 8% 10% 12% 14% 16% 18%
1979 1981 1983 1985 1987 1989 1991 1993 1995 1997 1999 2001 2003
% of pupils in large classes
18.5 19.0 19.5 20.0 20.5 21.0 21.5 22.0 22.5 Average class size
% of pupils in large classes Average class size Single teacher class sizes in maintained schools
England, January each year
Primary Secondary
Average class size
% of pupils in classes of over 30
Average class size
% of pupils in classes
of over 30
1979 25.9 35.3% 21.0 15.9%
1997 27.5 33.4% 21.7 8.7%
1998 27.7 34.8% 21.7 9.9%
1999 27.5 31.5% 21.9 10.8%
2000 27.1 26.5% 22.0 11.3%
2001 26.7 21.1% 22.0 11.7%
2002 26.3 17.8% 21.9 11.8%
2003 (p) 26.3 16.3% 21.9 11.7%
Sources: DfES SFR 09/03 Class sizes in maintained schools in England
Schools
Next update: February 2005 Contact: David Knott x2454 or Gavin Berman x3851
• The number of primary schools has been declining steadily since the mid-1970s, with a 4,300 fall since 1975/76.
• The number of secondary schools has been falling for a longer period of time. Their number fell by 1,700 or around 29 percent between 1970/71 and 2002/03.
• The average size of primary schools in the UK increased slightly between 1997 and 2002, from 223 pupils to 224.
• There was a much larger increase at secondary level, from 840 to 922 pupils, with the total number of pupils increasing to 3.95m in the same period.
• In the 2002/03 there were also 3,394 nursery, 1,471 special and 2,380 non-maintained (largely independent) schools in the UK.
Public sector primary and secondary schools
UK, 1970/71 - 2002/03
Primary Secondary Total
1970/71 26,799 6,010 32,809
1980/81 26,504 5,542 32,046
1990/91 24,135 4,790 28,925
1997/98 23,230 4,434 27,664
1998/99 23,125 4,418 27,543
1999/00 23,036 4,405 27,441
2000/01 22,902 4,337 27,239
2001/02 22,800 4,306 27,106
2002/03p 22,638 4,284 26,922
p - provisional
Source: National statistics, Annual Astract of Statistics, various
Primary schools: number and average size
UK, 1993-2003
22,000 22,200 22,400 22,600 22,800 23,000 23,200 23,400 23,600 23,800 24,000
1993 1994 1995 1996 1997 1998 1999 2000 2001 2002 2003
Schools
200 205 210 215 220 225
Average pupil numbers (Jan)
Secondary schools: number and average size
UK, 1993-2003
4,100 4,200 4,300 4,400 4,500 4,600 4,700
1993 1994 1995 1996 1997 1998 1999 2000 2001 2002 2003
Schools
700 750 800 850 900 950
Average pupil numbers (Jan)
Teachers
Next update: March 2005 Contact: David Knott x2454 or Gavin Berman x3851
• The number of primary school teachers in the UK fell by 1.2 percent to 228,800 in 2003, following rises in four consecutive years. The total fell by 36,000 between 1979 and 1985 before rising steadily throughout the late 1980s and early 1990s.
• Secondary teacher numbers rose by 0.9 percent to 243,300 in 2003, the fifth consecutive year of increases. The total is now back to 1989 levels following a fall of over 50,000 during the 1980s and early 1990s.
• Underlying demographic changes are the main determinant of pupil numbers and hence the demand for teachers. The number of pupils per teacher shows teacher numbers in the context of this demand.
• In primary schools the number of pupils per teacher has declined 0.8 points since 1997. It fell during the 1980s and increased by a similar amount between 1990 and 1998.
• The trend was similar in secondary schools, but the increase since 1990 has been greater. Small decreases in 2001 and 2002 were the first for a decade.
Change in pupil : teacher ratios in UK primary schools
-0.6 -0.5 -0.4 -0.3 -0.2 -0.1 0.0 0.1 0.2 0.3 0.4
1979 1981 1983 1985 1987 1989 1991 1993 1995 1997 1999 2001 2003 (prov) More teachers/
fewer pupils More pupils/ fewer teachers
Full-time equivalent teachers in UK primary and secondaryschools
Teachers ('000s) Pupils per teacher
Primary Secondary Primary Secondary
1979 241.2 281.8 22.9 16.5
1990 219.0 236.6 21.7 14.8
1997 227.0 228.9 22.8 16.2
1998 225.4 228.7 23.1 16.4
1999 226.7 230.4 22.9 16.5
2000 228.0 232.9 22.7 16.6
2001 229.6 237.0 22.3 16.5
2002 231.5 241.2 22.0 16.4
2003 228.8 243.3 22.0 16.4
Note:
Source: National Statistics, Annual Abstract 2004
Figures are for January each year, apart from Wales up to 1998 and Scotland where the data are for September
Excludes pupils and teachers in sixth form colleges in England and Wales from 1994 onwards.
Change in pupil : teacher ratios in UK secondary schools
-0.4 -0.3 -0.2 -0.1 0.0 0.1 0.2 0.3 0.4
1979 1981 1983 1985 1987 1989 1991 1993 1995 1997 1999 2001 2003 (prov) More teachers/
Examination results
Next update: August 2004 Contact: David Knott x2454 or Gavin Berman x3851
• The percentage of pupils achieving level 4 or above at Key Stage 2 (KS2) rose sharply between 1997 and 2000 in KS2 subjects. From 2001 onwards, results have reached a plateau at 75% for English, 72-3% Mathematics, and 86-7% in Science.
• The percentage of pupils achieving 5 or more GCSEs grades A*-C rose one percentage point to reach a new high at 52.6 percent in 2002/03.
• The percentage of pupils passing at least one exam declined slightly for the first time since 1997/98.
• The percentage of school leavers possessing no passes at GCSE remained constant at 5.4 percent in 2002/03. This is 1.2 percentage points below the level recorded in 1997/98.
• Increased staying-on rates mean that the proportion of 17 year olds with A levels, or their equivalent, has increased dramatically. The percentage with 3 or more A levels almost doubled between 1991/92 and 2002/03.
• The percentage of students with 3 or more A grades rose, irrespective of school type between 1997/98 and 2002/03. However, while the proportion of pupils at selective schools gaining 3 or more A grades increased nearly 50%, at comprehensive schools the rise was only 17%.
GCSE performance
England 1991/92 to 2002/03
5 or more grades A* to C
5 or more
grades A* to G no passes
1991/92 38.3 82.2 8.4
1997/98 46.3 87.5 6.6
1998/99 47.9 88.5 6.0
1999/00 49.2 88.9 5.6
2000/01 50.0 88.9 5.5
2001/02 51.6 88.9 5.4
2002/03 52.6 88.6 5.4
Includes GNVQ equivalencies from 1996/97
Sources: DfES, GCSE/GNVQ examination results England 2001/02
DfES, Autumn Packages 2003
% of 15 year old pupils achieving
A-level and equivalent achievements in schools and colleges
England 1991/92 to 2002/03
1+ 3+ Comp Selective
1991/92 92.7 57.4 .. ..
1997/98 96.9 69.0 4.7 12.7
1998/99 96.0 67.1 4.8 13.7
1999/00 96.2 67.7 5.0 14.1
2000/01 96.7 68.4 4.9 15.5
2001/02 98.3 79.3 5.3 18.6
2002/03 98.4 79.1 5.5 18.6
Data are for schools only
Source: DfES, GCE/VCE A/AS Examination Results for Young People in England 2002/2003 (revised)
% of examinees with A-level or equivalent passes
% achieving at least three A grades
Percentage of pupils achieving Key Stage 2, level 4+
England, all schools 1997-2003
English Mathematics Science
1997 63 62 69
1998 65 59 69
1999 71 69 78
2000 75 72 85
2001 75 71 87
2002 75 73 86
2003 75 73 87
Source: NC Assessments 2003 (Prov),DfES Autumn Package
Participation: 16-18 year olds
Next update: July 2004 Contact: David Knott x2454 or Gavin Berman x3851
16 to 18 year olds in education or training, percentages by age England, 1985-2002
16 year olds
17 year olds
18 year olds
30 40 50 60 70 80 90 100
1985 1986 1987 1988 1989 1990 1991 1992 1993 1994 1994 1995 1996 1997 1998 1999 2000 2001 2001 2002
16 17 18 16-18 16 17 18 16-18
1997 69.4 57.4 37.7 54.9 85.8 78.5 60.2 74.9
1998 69.8 57.8 37.2 54.8 85.7 79.3 59.9 74.8
1999 71.3 58.7 37.3 55.7 86.3 79.6 60.3 75.4
2000 71.3 58.9 37.1 55.8 86.6 79.3 60.0 75.4
2001 70.8 58.4 37.1 55.7 85.7 78.2 60.2 74.9
2002 72.8 59.1 37.2 56.5 86.8 78.3 59.6 75.0
Ages at 31 August
Source: DfES, Participation in education, training and employment by 16-18 year olds in England 2001 and 2002
All education and training Full time education
16, 17 and 18 year olds in education and training
England, percentages
• The percentage of the 16-18 age group continuing in full-time education increased rapidly, for all ages, between 1985 and the early 1990s and has changed little since.
• Increases were especially large for 17 and 18 year olds. The percentage of 17 year olds still in full-time education increased from 32 percent to 59 percent, the proportion of 18 year olds more than doubled.
• Changes to the collection of data on further education means there are series discontinuities in both 1994 and 2001. Figures in the chart incorporate both points, data in the table uses only the revised method.
• By August 2002 an estimated 25 percent of 16-18 year olds were not in any education or training.
• The proportion of students in EU countries enrolled in public secondary education is highest in Ireland. The government-dependent private sector is largest in the Netherlands.
• Portugal has the largest proportion of upper secondary students in the independent sector in the EU.
Distribution of students in upper secondary education, EU,
2000
0% 10% 20% 30% 40% 50% 60% 70% 80% 90% 100%
Ire Den Swe Gre Ita Ger Aut Fin Lux Por Spa Fra Bel UK Net
Applicants and entrants to higher education
Next update: March 2004 Contact: David Knott x2454 or Gavin Berman x3851
• The total number of home applications via the Universities and Colleges Admissions Service (UCAS) has risen in each of the last three years, exceeding 400,000 for the first time in 2002.
• The total number of accepted applicants has risen in each of the last four years. 83 percent of home applicants were accepted in 2002, compared to 69 percent in 1994.
• 1997, the year before the introduction of tuition fees for most students, saw sharp rises in both applications and acceptances.
• Overseas applications comprised 13 percent of total applications and 10 percent of acceptances in 2002.
• UCAS processes applications for full-time and sandwich undergraduate courses only. As they are disproportionately likely to study part-time, a significant number of mature students are excluded from these statistics.
Applicants through UCAS, 1994-2002
number change number change
1994 365,323 .. 251,292 .. 69
1995 369,701 +1.2% 265,536 +5.7% 72
1996 364,885 -1.3% 268,289 +1.0% 74
1997 398,327 +9.2% 303,318 +13.1% 76
1998 389,588 -2.2% 298,220 -1.7% 77
1999 388,691 -0.2% 303,065 +1.6% 78
2000 389,091 +0.1% 308,718 +1.9% 79
2001 399,645 +2.7% 325,472 +5.4% 81
2002 401,854 +0.6% 331,725 +1.9% 83
Source: UCAS annual datasets
Accepted Home applicants
% accepted
Applications and acceptances to higher education institutions
UK, 2002
Age UK Overseas Total UK Overseas Total
<21 312,457 35,513 347,970 264,714 21,680 286,394 21-24 42,894 16,592 59,486 32,867 10,300 43,167 >25 46,503 7,406 53,909 34,144 4,410 38,554
All 401,854 59,551 461,405 331,725 36,390 368,115
Source: UCAS annual datasets
Applications Acceptances
Home applications and acceptances 1994-2002
Home applicants
Accepted
200,000 250,000 300,000 350,000 400,000 450,000
1994 1995 1996 1997 1998 1999 2000 2001 2002
Participation in higher education
Next update: June 2004 Contact: David Knott x2454 or Gavin Berman x3851
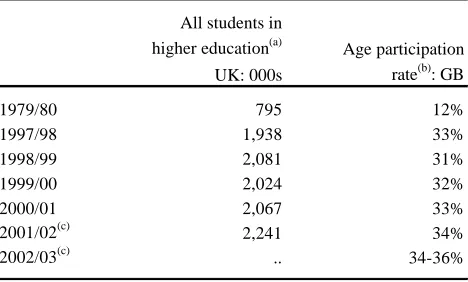
• Both the number of students in higher education and the participation rate have increased significantly since 1979/80.
• The age participation rate of young people has increased from about one-in-eight in 1979/80 to one-in-three at present.
• The total number of students increased by approximately 170,000 in 2001/02. There are now almost 2.25 million students in higher education in the UK.
• The five HE institutions with the highest (above 40 percent) entry rates from social classes IIIM, IV and V that were statistically significantly above their area benchmark are all ‘new’ universities, colleges or institutes.
• The five HE universities with the lowest (below 15 percent) entry rates from social classes IIIM, IV and V that were statistically significantly below their area benchmark comprise: Oxford; Cambridge; Bristol; Exeter and Durham.
% Age participation rate Great Britain, 1989/90 - 2001/02
10% 15% 20% 25% 30% 35% 40%
1989/90 1991/92 1993/94 1995/96 1997/98 1999/00 2001/02
Participation in higher education, 1979/80 to 2002/03
All students in
higher education(a) Age participation
UK: 000s rate(b): GB
1979/80 795 12%
1997/98 1,938 33%
1998/99 2,081 31%
1999/00 2,024 32%
2000/01 2,067 33%
2001/02(c) 2,241 34%
2002/03(c) .. 34-36%
(a) Includes overseas and OU.
(b) Home entrants to HE aged under 21 as a % of avg no of 18-19 yrs (c) Projected participation rate
Source: Table 3.6 Education Statistics for the UK 2002
Social classes IIIM, IV and V:
Top/bottom 5 HE institutions by % entry 2001/02
0 5 10 15 20 25 30 35 40 45 50
Wolverhampton
North London
Edge Hill College
London Guildhall
East London
Durham
Exeter
Bristol
Cambridge
Oxford
[image:31.842.69.303.331.472.2]Education expenditure
Next update: June 2004 Contact: David Knott x2454 or Gavin Berman x3851
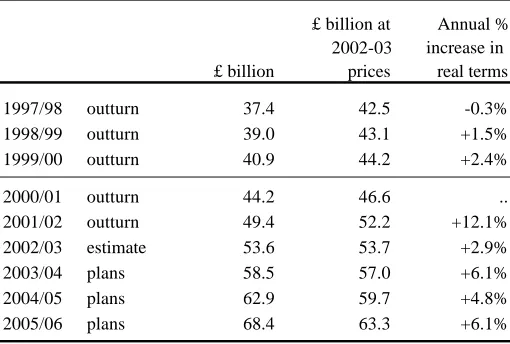
• By 2005-06 education expenditure is planned to reach 5.6 percent of GDP, the highest level in the last 25 years.
• Substantial increases in education spending as a proportion of GDP occurred in the early 1990s and from 1999/00 onwards.
• Spending has increased in real terms in most years since 1979-80. The only periods where it fell for two or more consecutive years were in the mid-1980s and mid-1990s.
• Expenditure plans since the 2000 Spending Review have been presented on a resource basis. The figures shown here are on a resource basis from 2000/01 onwards.
• The OECD ranked the UK 9th out of 14 EU countries in terms of education expenditure as a percentage of GDP in 2000.
Education expenditure as a % of GDP: EU 2000
0 1 2 3 4 5 6 7 8
Gre Ire Net Spa Ita UK Ger Bel Fin Por Aut Fra Swe Den
Public
Private
Real % change in UK public education expenditure
Series break -4
-2 0 2 4 6 8 10 12 14
80/81 82/83 84/85 86/87 88/89 90/91 92/93 94/95 96/97 98/99 00/01 02/03 04/05
Total public expenditure on education in the UK
£ billion at Annual %
2002-03 increase in
£ billion prices real terms
1997/98 outturn 37.4 42.5 -0.3%
1998/99 outturn 39.0 43.1 +1.5%
1999/00 outturn 40.9 44.2 +2.4%
2000/01 outturn 44.2 46.6 ..
2001/02 outturn 49.4 52.2 +12.1%
2002/03 estimate 53.6 53.7 +2.9%
2003/04 plans 58.5 57.0 +6.1%
2004/05 plans 62.9 59.7 +4.8%
2005/06 plans 68.4 63.3 +6.1%
UK figures are subject to the decisions of devolved administrations. Sources: Table 3.2, PESA 2003-04, Cm 5901 and earlier editions
HM Treasury, Budget 2002; CSR 2002
[image:32.842.76.331.287.459.2]General Election results
Contact: Adam Mellows-Facer x6969 or Ross Young x4313 • Since 1945 both the Conservatives and Labour have been the largest party, in terms of
seats won, on eight occasions.
• The Conservatives’ best result since 1945 in terms of seats was 1983 when they won 397. Their highest share of the vote was in 1955 when they polled 49.6 percent.
• Labour’s 418 seats won in 1997 is their highest ever while their highest share since 1945 was 48.8 percent in 1951, an election that they lost.
• In the 2001 General Election the Liberal Democrats increased their number of seats by six to 52, the highest post war total by the party or its predecessors.
Share of the vote: UK: 1945-2001
0% 10% 20% 30% 40% 50% 60%
1945 1950 1951 1955 1959 1964 1966 1970 Feb '74 Oct '74 1979 1983 1987 1992 1997 2001
Labour
Conservative
LibDem
Other
PC/SNP
General Election results: 1979-2001: UK
Con Lab Lib(a) PC/SNP Other Total
Share of vote (%)
1979 43.9% 36.9% 13.8% 2.0% 3.4% 100%
1983 42.4% 27.6% 25.4% 1.5% 3.1% 100%
1987 42.2% 30.8% 22.6% 1.7% 2.7% 100%
1992 41.9% 34.4% 17.8% 2.3% 3.5% 100%
1997 30.7% 43.2% 16.8% 2.5% 6.8% 100%
2001 31.7% 40.7% 18.3% 2.5% 6.9% 100%
Seats won
1979 339 268 11 4 13 635
1983 397 209 23 4 17 650
1987 375 229 22 6 18 650
1992 336 271 20 7 17 651
1997 165 418 46 10 20 659
2001 166 412 52 9 20 659
Votes (millions)
1979 13.7 11.5 4.3 0.6 1.1 31.2
1983 13.0 8.5 7.8 0.5 1.0 30.7
1987 13.7 10.0 7.3 0.5 0.9 32.5
1992 14.1 11.6 6.0 0.8 1.2 33.6
1997 9.6 13.5 5.2 0.8 2.1 31.3
2001 8.4 10.7 4.8 0.7 1.8 26.4
Local, Scottish Parliament, Welsh Assembly and European Parliament elections
Next update: June 2004 Contact: Adam Mellows-Facer x6969 or Ross Young x4313
• The Conservatives now have more councillors in Great Britain than Labour, for the first time since 1991. They were briefly the third party during the mid-1990s.
• Labour’s total has fallen by almost 4,000 since 1996, while the Liberal Democrats are some 500 councillors below their 1996 peak.
• 59 English districts ran local election pilot schemes on 1 May 2003 to test new voting and counting methods, covering approximately 6.5 million voters. The schemes included mobile voting and voting by internet, SMS text and digital television.
• Labour won 30 of the 60 seats at the 2003 Welsh Assembly elections, after increasing their share to 38 percent. Plaid Cymru were second, despite their share of the vote falling by 9 percentage points.
• Labour remained the largest party in the Scottish Parliament after the 2003 elections, although their share of the vote fell by 4 percentage points. The SNP were second, despite a 6 percentage point fall in their share of the vote.
• The Conservatives won 36 of the 87 UK seats at the 1999 European Parliament elections to become the largest British party following an 11 percent swing from Labour relative to 1994. The next elections are due in June 2004.
Councillors in Great Britain: 1979-2003
After May local elections
0 2,000 4,000 6,000 8,000 10,000 12,000 14,000
1979 1981 1983 1985 1987 1989 1991 1993 1995 1997 1999 2001 2003
Councillors
Labour Conservative
Lib Dem
Other
PC/SNP
European Parliament election results: 1979-1999: United Kingdom
Con Lab Lib PC/SNP Other Total
Share of vote (%)
1979 48.4% 31.6% 12.6% 2.4% 4.9% 100%
1984 38.8% 34.8% 18.5% 2.5% 5.4% 100%
1989 33.5% 38.7% 5.9% 3.3% 18.5% 100%
1994 26.9% 42.6% 16.1% 4.1% 10.2% 100%
1999 33.5% 26.3% 11.9% 4.6% 23.8% 100%
Seats won
1979 60 17 0 1 3 81
1984 45 32 0 1 3 81
1989 32 45 0 1 3 81
1994 18 62 2 2 3 87
1999 36 29 10 4 8 87
Source: Parliamentary Research Services, British electoral facts 1832-1999
Forthcoming elections
2004
Greater London Authority (Assembly and Mayor of London)
District and unitary councils in England that elect by thirds or by halves Metropolitan borough councils in England
Local councils in Wales European Parliament 2005
County councils in England Local councils in Northern Ireland 2006
District and unitary councils in England that elect by thirds or by halves Metropolitan borough councils in England
London borough councils
Turnout
Source: International Institute for Democracy and Electoral Assistance, www.idea.int
Next update: Late 2004 Contact: Adam Mellows-Facer x6969 or Ross Young x4313
• Turnout at the 2001 General Election was 59.4 percent, the lowest since the introduction of universal suffrage.
• Comparing turnout at the last parliamentary election, the UK was 13th of the EU15.
• Turnout at the 1999 European Parliament election in the UK was 24 percent, the lowest in the EU.
Turnout at most recent elections
Percentages of registered electorate
Election Year Turnout %
General 2001 59.4
European Parliament 1999 24.0
Scottish Parliament 2003 49.4
Welsh Assembly 2003 38.2
Northern Ireland Assembly 2003 63.1
English local 2003 33.7
London boroughs 2002 33.1
Metropolitan boroughs 2003 32.1
Unitary councils 2003 34.6
Shire district councils 2003 34.3
Scottish unitary councils 2003 49.2
Welsh unitary councils 1999 49.7
Northern Ireland district councils 2001 66.0
Notes: Data for 2003 local elections not yet available.
Sources: Rallings and Thrasher, British electoral facts 1832-1999
Rallings and Thrasher, Local elections handbook series Turnout at the Scottish, Welsh and Northern Ireland local elections was boosted by Scottish Parliament, Welsh Assembly and General elections respectively being held on the same days.
% Turnout at General Elections 1945-2001
Percentage of registered electorate
83.9 82.6
76.8 78.7 77.1 75.8
72.0 78.8
72.8 76.0 72.7 75.3
77.7 71.4
59.4 72.8
0 20 40 60 80 100
1945 1950 1951 1955 1959 1964 1966 1970 F1974 O1974 1979 1983 1987 1992 1997 2001
% Turnout at last parliamentary election: EU and G7
Percentage of estimated voting age population
89
85 84 83
78 78
75 74 73 73
70 65
59 58 57
55 50
47
0 20 40 60 80 100
Opinion polls
Next update: March 2004 Contact: Adam Mellows-Facer x6969 or Ross Young x4313
• Labour’s share of the intended vote has fallen since the 2001 General Election. The Conservatives have gained some ground in recent months, while the Liberal Democrats appear steady at around 20 percent.
• Since November 2002, MORI have used only those certain to vote in calculating their headline figures. Their February poll showed a Labour lead over the Conservatives of one percentage point by this measure. YouGov’s January poll shows the Conservatives leading by five percentage points.
• The NHS and hospitals have taken over from defence, foreign affairs and international terrorism as the issue most likely to be identified as the most, or as another important, issue facing Britain as identified by MORI’s regular poll.
Monthly voting intention: ICM All naming a party, actual election results used
Con, 34% Lab, 39% LibDem, 20% Other, 7% 0% 10% 20% 30% 40% 50% 60% 70% May 97 Nov 97 May 98 Nov 98 May 99 Nov 99 May 00 Nov 00 May 01 Nov 01 May 02 Nov 02 May 03 Nov 03
Monthly voting intention: MORI All naming a party, actual election results used
Con, 32% Lab, 39% LibDem, 20% Other, 9% 0% 10% 20% 30% 40% 50% 60% 70% May 97 Nov 97 May 98 Nov 98 May 99 Nov 99 May 00 Nov 00 May 01 Nov 01 May 02 Nov 02 May 03 Nov 03
MORI: Issues facing Britain: February 2004
Issues polling over 5%
Most or other important issue%
National Health Service/hospitals 37
Race relations/immigration/immigrants 35
Education/schools 33
Defence/foreign affairs/international terrorism 28
Crime/law & order/violence/vandalism 26
Pensions/social security 13
Taxation 10
Economy/economic situation 9
Unemployment/factory closure/lack of industry 8
Common Market/EU/Europe/EMU 7
Drug abuse 6
Transport/public transport 6
1,029 adults interviewed face-to-face, 12-16 February 2004 Source: MORI, Political Attitudes in Great Britain, www.mori.co.uk
Voter characteristics
Contact: Adam Mellows-Facer x6969 or Ross Young x4632 Source: MORI election aggregate in Worcester and Mortimore, Explaining
Labour's second landslide, Politico's 2001
• Older people, those in the higher social classes and home owners were disproportionately likely to vote at the 2001 General Election.
• Turnout amongst non-whites was 47 percent, compared to 60 percent amongst white people.
• The voting preferences of men and women were very similar.
• Labour secured at least 30 percent of the vote from all the groups considered in the chart to the right.
• Conservative support was strongly skewed towards older age groups, the higher social classes and home owners.
• The highest Liberal Democrat share of the vote came amongst the 18-24 age group, AB social classes and private renters.
• Almost three-quarters of non-whites voted Labour. The Liberal Democrats were second amongst this group with 13 percent
2001 General Election: estimated %pt Labour lead over Conservatives by voter characteristic
9 10 9 14 27 17 9 -2 -1 -9 2 20 31 13 14 5 31 13 15 -7 9 22 -11 11 -7 16 42 12 8 61 29 4
-20 -10 0 10 20 30 40 50 60 70
All Gender Men Women Age group Social class AB C1 C2 DE Work status Full time Part-time Not working Unemployed Male FT Female FT Self-employed Private sect