Further Analysis of the
Returns to Academic
and Vocational Qualifications
Steven McIntosh
Centre for Economic Performance
London School of Economics
Research Report RR370
Research Report
No 370
Further Analysis of the
Returns to Academic
and Vocational Qualifications
Steven McIntosh
1Centre for Economic Performance
London School of Economics
1
Centre for Economic Performance, London School of Economics, Houghton Street, London, WC2A
2AE. Email:
The data for this study were supplied by the ESRC Data Archive at the University of Essex.
The views expressed in this report are the authors' and do not necessarily reflect those of the Department for Education and Skills. © Queen’s Printer 2002. Published with the permission of DfES on behalf of the Controller of Her Majesty's Stationery Office. Applications for reproduction should be made in writing to The Crown Copyright Unit, Her Majesty's Stationery Office, St Clements House, 2-16 Colegate, Norwich NR3 1BQ.
1
Contents
Page
Executive Summary
2
1. Introduction
5
2. Data and Methodology
9
3. Results
(i) The returns to qualifications over time
15
(ii) The returns to qualifications in the public and private sectors
21
(iii) Pseudo cohort analysis
23
(iv) The returns to qualifications by highest school qualification obtained
28
4. Conclusions
33
Tables 1-22
36
2
Executive Summary
This report uses data from the Labour Force Survey (LFS) to disaggregate the
estimated returns to detailed qualifications along a number of dimensions, in
particular focussing on changes in returns over time, by public and private sector, by
age cohort and by highest school qualification. The report uses data from all the
years of the LFS for which information on wages have been collected, 1993-2001,
although prior to 1996, the education section of the survey only asks about the three
highest qualifications that respondents possess, rather than all qualifications, which
means that in some cases there will be an inconsistency at this point when
considering the full time series from 1993 to 2001. We use information on all
qualifications held by individuals, rather than just their highest qualifications, so
that the returns to each qualification are estimated on the basis of the earnings of all
individuals who acquire them, rather than just individuals who acquire that
qualification and progress no further. As a result of using the ‘all qualifications’
specification, the interpretation of the estimated coefficient on any particular
qualification is the estimated difference in earnings between someone who holds
that qualification and someone who does not, holding all other education
achievements constant. The estimated returns should be viewed as cumulative
across qualifications, and so can be summed to obtain the total returns to a
combination of qualifications.
The key findings of the analysis are as follows
2:
•
The returns to the key academic qualifications are very similar for men and
women, being around 26% for a first degree, 16% for 2 or more A levels,
and 28% for 5 or more good (grade C or above) GCSEs.
•
With respect to vocational qualifications, men and women earn positive
returns to HNC/HND and ONC/OND qualifications, although these are
slightly higher for men (14% and 11% respectively) than for women (8% for
each). Returns to vocational qualifications differ according to the type of
qualifications typically undertaken by men and women. Thus men earn
positive returns to craft-based qualifications, such as Advanced Craft City
2
The numbers given here for the estimated returns are typically the mid-values of the range of estimated
3
and Guilds (7%) and Craft City and Guilds (6%), while women earn positive
returns (in some years) to higher level RSA qualifications, of up to 10%.
Both sexes benefit from professional, teaching and nursing qualifications,
although women benefit to a greater extent.
•
There has been virtually no change in the estimated returns to most
qualifications over the time period considered. An exception seems to be
GCSE qualifications at grades D and below, the returns to which seem to
have fallen away to zero by 2001.
•
Comparing the returns in the private and public sectors, for men the higher
academic qualifications yield a greater return in the private sector than in the
public sector. For women there is little difference in the returns to degrees
and A levels across the sectors. The reverse, however, is true for GCSEs, the
returns to which are similar across sectors for men, but greater in the private
sector for women.
•
Considering the returns to vocational qualifications across sectors, the
returns to teaching and nursing qualifications are, as expected, higher in the
public sector, where they are more likely to be used. Other higher level
vocational qualifications attract higher returns in the private sector than in
the public sector, this time for both men and women. Lower level vocational
qualifications only attract statistically significant returns in the private
sector.
•
The analysis by age group (pseudo cohort analysis) suggests that the returns
to most qualifications do not vary to any significant extent over the working
lifetimes of individuals. The exceptions are rising returns to first degrees,
and to a lesser extent A levels, until individuals are aged in their early
thirties, for both men and women. In addition, for women only, the returns
to teaching and nursing qualifications appear to rise continuously throughout
their working lives.
4
qualifications. An HNC/HND qualification yields no benefit for this group,
suggesting that it is a substitute for, rather than a complement to, holding 2
or more A levels.
5
1. Introduction
This report is a follow-up report to that of Dearden et al (2000, Skills Task Force
Report 20), which examined the wage returns to a detailed list of academic and
vocational qualifications in Britain in the 1990s, using data from three sources, the
National Child Development Study (NCDS), the International Adult Literacy Survey
(IALS) and the 1998 Labour Force Survey (LFS). That report went further than the
traditional returns to education literature by estimating the wage return to each of a long
list of separate qualifications, rather than simply estimating an average return to a year
of education. Hence, the returns are allowed to differ according to the qualification
being undertaken. However, the resulting estimates of the returns to each qualification
were still estimates of the average return across all individuals obtaining that
qualification, and there might be substantial variance in the actual return when we
disaggregate by certain characteristics. In addition, the estimates in the earlier report
were for single points in time. This report therefore extends the earlier work in a
number of directions.
First, we consider how the returns have changed over time, rather than simply
considering a single point in time. Since the LFS is the only one of the three surveys
utilised in the previous report to be a regular annual survey, only data from that source
will be used in this report. Wage data has been collected in the LFS since 1993, and so
this report will consider all years from 1993 to 2001.
A second extension is to disaggregate by sector, estimating the returns to the various
qualifications separately for the private and public sectors. Given the continued use, by
and large, of rigid pay scales and the continued dominance of trade unions in the public
sector, compared to the decline of unionism in the private sector and the increasing use
of individual pay determination, this distinction could be of importance.
6
whether to invest in their human capital by studying for a qualification. Strictly
speaking, this decision should be based upon a calculation of the additional earnings
that the individuals will accrue over the course of their working lives relative to the
current costs of studying for the qualification. If we only have a single estimate of the
returns to each qualification (averaged across all ages) then all we can do is assume that
the return is the same at all ages, that is that the age-earnings profile for those with a
degree, for example, is a constant mark-up on the profile for people without a degree.
With a single cross-section of data, it is difficult to do otherwise.
One possibility would be to interact the variables indicating possession of a
qualification with age (or alternatively, estimate separate wage equations for individuals
of different ages, or for individuals in different age bands, if the sample size is not large
enough to consider each possible age separately). Thus, with a single cross-section of
data, we could estimate the returns to a degree, for example, for individuals in their
twenties, individuals in their thirties and so on, and so build up a picture of how the
returns vary with age.
7
that with a single cross-section of data, we have no way of knowing how much of the
difference is due to cohort effects and how much is due to age effects. Thus it is
impossible to predict exactly how a new graduate’s earnings will progress over his or
her working life, that is to accurately know the age effects.
A solution to this problem could be found if we had data on a cohort of individuals, and
followed them throughout their working lives. Thus we could estimate wage equations
for each year of their lives, with the cohort getting one year older in each case, and so
trace out how the returns to each qualification vary with age. Such estimates would be
purged of any cohort effects, since by definition we are dealing with a single cohort of
individuals. The problem is, in this case, that time is no longer fixed. Thus we could
estimate, if we had the data, the returns to various qualifications for a cohort of
individuals who reached the working age of 16 in, for example, 1950, and reached the
retirement age of 65 in 1999. These estimates would be free of cohort effects.
However, they would be specific to the time period considered. It is extremely doubtful
whether governments would want to base public policy, or whether private individuals
would want to base human capital decisions, on the estimated returns to qualifications
that were gained, on the whole, fifty years ago. It is certain that conditions, both in the
education sector and the labour market, will have changed hugely, making such
estimates a very poor indicator of the likely returns over the 50 years to come for an
individual just making their human capital decisions.
What can be done, therefore? In this report, we consider cohorts of individuals over
short, overlapping periods of time. In actual fact, we do not have true cohorts, since the
LFS is not panel data set, surveying the same individuals year after year
3. Thus we
create ‘pseudo cohorts’ of LFS respondents. For example, we form one pseudo cohort
of all those respondents aged 21-25 at the beginning of 1993, and analyse their returns
3
The LFS does have a panel element in terms of the quarterly surveys, with each respondent being
8
to the various qualifications in the 1993 survey. We then take the 1994 survey, but look
at all those aged 22-26 at the beginning of the year, and estimate their returns.
Although the estimates will be based on different individuals, as the LFS will have
sampled a new group of respondents, in both cases they will be representative of a
single cohort of individuals (those born between 1
stJanuary 1967 and 31
stDecember
1971), and so the coefficients will be unbiased estimates of the wage returns for the
individuals in this cohort in each year. In this way, using data until 2001, we can show
how the returns to each qualification vary with age as this cohort ages from 21-25 to
29-33. We cannot follow this cohort any further, because we only have nine years of LFS
data that contain wage information, but of course we do not want to follow a single
cohort for their full working lives, as the estimates derived will be relying on data up to
50 years old, as discussed above.
To obtain estimates of the returns to qualifications later in life, we can start off a new
pseudo cohort, aged 26-30 in 1993, and estimate their wage returns until they are aged
34-38 in 2001. Of course, we have now introduced a second cohort, and so any change
in the estimated returns could be due to a cohort effect, and not due to the pure age
effect, of this group being older, that we wish to estimate. Note, however, that the
estimated age-returns profiles for the two cohorts overlap. Thus, for example, we
obtain an estimate of the returns to the various qualifications for 26-30 year olds from
the first cohort in 1998 and from the second cohort in 1993. Since the ages are
identical, any differences in the estimated returns will be due to a pure cohort effect
4.
We then estimate wage equations over the period 1993-2001 for further successive
cohorts, specifically initially aged 31-35, 36-40, 41-45, 46-50 and (for males only)
51-55 in 1993. The nine-year-long estimated age-returns profiles for each cohort will
overlap the profile for the cohort before and the profile for the cohort after in each case,
allowing us to derive a continuous age-returns profile for the entire working age range,
with the overlaps allowing us to calculate the changes due to cohort effects resulting
4
In actual fact, the difference in the estimated returns could be due to a cohort effect or to a time effect,
9
from using different cohorts of individuals, all the while using recent data from the last
ten years, rather then more outdated data
5.
A final extension in this report is to disaggregate the population according to the level
of qualifications obtained at school. As mentioned above, the typical estimate of a
return to a qualification is an average return, averaged across all individuals who obtain
that qualification. For this estimate to be of use, it is being implicitly assumed that the
return is the same for all individuals who obtain the qualification. This of course may
not be true, and so here we differentiate between individuals according to the highest
level of qualification that they obtained at school, estimating the returns to the various
qualifications for each group in turn. This particular disaggregation was chosen to
allow us to get a feel for the returns to qualifications for the marginal student (that is,
the last student to decide to undertake a qualification) rather than the average student.
This is important for government policy, if access to certain qualifications is being
considered for expansion or additional encouragement. In order to evaluate such an
expansion policy, we wish to know the returns to the additional students who are
tempted onto the expanded course, and not the returns to the students who would
already have followed such a course. For example, if a government aim is to get more
individuals with no school qualifications onto vocational courses, then the estimates
provided in this analysis will indicate the returns that such marginal individuals can
expect to gain.
2.
Data and Methodology
As described in the Introduction above, this report uses data from the Labour Force
Surveys of 1993-2001. The LFS is a quarterly survey of a representative sample of
households in the UK. We append the data from the four quarters in each year into
annual data sets. Respondents to the LFS are actually surveyed for five successive
cohorts, one-fifth being refreshed in each quarter. From 1993 to 1996 inclusive,
respondents were only asked to report their wage levels the final time that they were
5
This is actually the ideal, which was hoped to be the outcome of this study. As Section 3 will show, the
10
surveyed (that is, in wave 5). From 1997 onwards, respondents have reported their
wages in both waves 1 and 5. In all years, we only kept observations with reported
wage data. Thus, in any one annual data set, constructed from the four quarterly
surveys in that year, no individual can be in the constructed data set twice, even post
1997, since a respondent’s wave 1 and wave 5 appearances in the survey cannot be in
the same calendar year. All analyses were performed for full-time employees only,
resulting in usable sample sizes of approximately 15000 in the years 1993-1996 and in
2001 for men (approximately 9000 for women, since fewer women work full-time), and
of approximately 30000 in the years 1997-2000 for men (19000 for women)
6.
In an analysis of this type, we would like information on all qualifications held by an
individual. Many other analyses simply concentrate on the highest qualification level
achieved. This is perfectly adequate if all we wish to know is the average return to
reaching a certain level, say NVQ level 3, regardless of how that level was reached and
which actual qualifications were obtained. In this analysis, however, it was desired to
know the returns to a detailed list of actual qualifications. In this case, assigning to
each individual in our data set only their highest qualification would give us a distorted
picture of the returns to each qualification. Suppose that we wish to know the returns,
specifically, to an ONC/OND. If we estimate this return based on the individuals in our
data set for whom an ONC/OND is their highest qualification, then this would not give
a true reflection of the returns to this qualification. Other individuals will also have
obtained an ONC/OND qualification, but may have gone on to obtain another, higher
level qualification, and so will not be included in the calculation of the return to this
qualification. If the returns to an ONC/OND are independent of all future qualifications
obtained then this does not matter. However, if the characteristics of those individuals
who obtain an ONC/OND but nothing higher differ from the characteristics of all
individuals who obtain an ONC/OND, which sounds at the very least plausible and
actually quite possible, then we will not calculate the true return to an ONC/OND,
averaged across all individuals who obtain such a qualification. In addition, there is the
problem when just considering an individual’s highest qualification, of which exactly is
that individual’s highest qualification. If individuals hold more than one qualification at
6
The sample sizes were smaller in 2001 than in the preceding years because, although wage information
11
the same level, it can become quite a subjective decision which qualification is actually
assigned as their highest. This problem of course does not exist when we consider all
qualifications held by individuals.
Unfortunately, the LFS has only asked respondents to report all qualifications held since
1996. In the first three years considered here (1993-1995), respondents are only asked
to list their three highest qualifications. The analysis has still been conducted as if we
know all qualifications held by all individuals in these years, but of course this may not
be the case, and this should be borne in mind when the results are considered. If any
individuals hold more than three qualifications, then we will not know all of the
qualifications that they hold. What effect will this have on the estimated returns? In the
case of higher level qualifications, the estimated returns are likely to be biased upwards.
This is because individuals who hold high level qualifications are more likely to have
obtained more than three qualifications, as they have progressed through the education
system, the lower ones of which will therefore not be observed. In this case, the
estimated returns to the observed, higher qualifications will be conflated with the
returns to the unobserved, lower qualifications, thus giving us an over-estimate of the
true return to the higher level qualification. There may also be another, more subtle,
bias on the estimated returns to the lower level qualifications in the early years of the
period considered. The individuals whom we observe with low level qualifications are
more likely to be those individuals who have not gone on to obtain higher level
qualifications, otherwise we would not have observed these qualifications amongst such
individuals’ highest three qualifications. If the individuals who do not go on to acquire
higher qualifications differ in some unobserved way, for example lower ability, from
those who do progress higher, then the estimated coefficients on these low level
qualifications would be downwardly biased estimates of the true returns to these
qualifications
7. If either of these biases are thought to be apparent in the estimated
returns to particular qualifications, then only the returns for the years 1996-2001, for
which all qualifications are available, will be discussed.
Table 1 shows the proportion of the population in each year to hold each of the
qualifications. We can see that for certain lower level qualifications there is indeed
7
This is analogous to the bias inherent in the estimated returns to the various qualifications when we only
12
quite a sizeable change between 1995 and 1996, when the change to the LFS
questionnaire is made. Thus for example, 45% of respondents report holding some
GCSEs at grade C or above in 1995, compared to 52% in 1996. Similarly, on a smaller
scale, 5% of respondents report holding a low level City and Guilds ‘other’
qualification in 1995, compared to 9% in 1996. These figures suggest that the number
of individuals with certain lower level qualifications is being under-represented in the
years 1993-1995, because a certain number possess at least three other qualifications at
a higher level.
In actual fact, it is not the case that all qualifications are known even in the years
1996-2001. The LFS asks respondents to report all qualifications that they hold within
certain categories, for example whether they hold a degree, a City and Guilds
qualification, an RSA qualification, or an NVQ/GNVQ, and then, if respondents report
holding qualifications in these categories, asking them supplementary questions in
which they reveal only their highest qualification within this category. Thus for
example, if respondents report holding a degree, they are then asked which is their
highest degree: a higher degree, a first degree or a professional qualification at degree
level. Similarly, if respondents report holding a City and Guilds qualification, they are
then asked what is the highest level of City and Guilds qualification that they hold:
Advanced Craft, Craft or other. In order to assign all qualifications to individuals in
such circumstances, we need to make certain assumptions.
13
all first degree-holders, though. Thus the estimated returns to a first degree may also be
slightly biased upwards, since we will also be observing the returns to a professional
qualification amongst some graduates.
In addition we assume that all individuals who hold a higher level RSA qualification, or
an Advanced Craft or Craft level City and Guilds qualification, but do not hold any
GCSEs at grade C or above or equivalent, also hold the respective lower RSA or City
and Guilds qualifications, as these would have been necessary entrance qualifications to
the higher levels if no good GCSEs were held.
The remaining category of qualifications where we only know the highest qualification
within the category (NVQ/GNVQ) is difficult. The NVQ qualification in particular is
often viewed more as a verification of skills, rather than a course of skills to be learned
and tested. Thus, if an individual holds an NVQ qualification at a certain level, say
level 3, there is a case for allocating to that individual all NVQ levels below this level.
If they have the skills to obtain a level 3 NVQ qualification, then they would be able to
obtain level 2 and level 1 NVQ qualifications as well, whether or not they actually hold
the certificates (which of course we do not know, as we only observe the highest NVQ
qualification in the LFS). However, doing so would open up a whole new set of
questions. Other individuals with no NVQ qualifications, for example those who have
followed a purely academic route, would also presumably be capable of acquiring
low-level NVQ certificates, perhaps after some short training period, so following the same
argument, should they not be allocated these qualifications as well? Then we would
have to estimate for each such person up to what level they could obtain NVQ
qualifications. Then, we could say that they should be capable of obtaining other,
non-NVQ, qualifications as well, and start allocating other qualifications. For these reasons,
we decided not to make any assumptions about other NVQ qualifications held, and so
the only NVQ/GNVQ qualification allocated to individuals is their highest
8.
8
This is likely to explain the findings in the following section, where negative returns to NVQ1 and
14
Summarising the above discussion, in order to consider all qualifications held by
individuals, we allocate first degrees to those individuals with higher degrees, and low
level City and Guilds or RSA qualifications to individuals with higher qualifications in
these categories but no GCSEs at grade C or above. In the case of individuals holding
both a degree and a professional qualification, we only observe (what the respondent
considers to be) the highest of the two qualifications, while for NVQ/GNVQ
qualifications we again only observe the highest level obtained. For all other
qualifications, we should be able to identify whether or not they are held, regardless of
other qualifications held, in the post-1996 period at least, and so we are confident that
we are indeed picking up all individuals holding such qualifications.
One ‘qualification’ that is treated slightly differently in the LFS is an apprenticeship.
There is a question in the survey, completely separate from the qualifications question,
asking whether the respondent has completed a trade apprenticeship. Often amongst
those that have, however, they will have received a formal qualification, such as a City
and Guilds qualification, and so their achievement would essentially be measured twice
if we allocated all who answered ‘yes’ on the apprenticeship question to the
apprenticeship variable. We therefore consider in this analysis those respondents who
have completed an apprenticeship, but on the qualifications question indicate that they
have no formal qualifications. If an individual obtained a qualification through their
apprenticeship, this is therefore indicated in the appropriate qualification variable, and
not in the apprenticeship variable.
15
acquire, and also in part determine their earnings. Unless such characteristics are
controlled for, hence allowing education choice conditional on these characteristics to
be viewed as exogenous, then the estimated coefficients will be biased. It is unlikely
that equations based on the LFS, with its limited availability of control variables, will
successfully control for all variables that affect both education choice and earnings.
Two obvious omissions are natural ability and family background. It is likely that
omission of these variables will bias upwards the estimated coefficients on the
qualification variables. However, there are other causes of bias inherent in using OLS,
such as measurement error and a failure to include a likelihood of being in employment,
that are likely to bias downwards the qualification coefficients. It was shown in the
earlier report (Dearden et al, 2000) that controlling for all of those potential biases,
which was possible using the much richer NCDS data set, actually gives coefficient
estimates very similar to those obtained when none of these allowances are made.
Intuitively, the various biases cancel out, leaving the OLS estimates as reasonable
indicators of the true returns to the various qualifications. We will therefore appeal to
this result again here, and take the OLS estimates presented below to be good estimates.
It is to these estimates that we now turn.
3.
Results
(i) The Returns to Qualifications Over Time
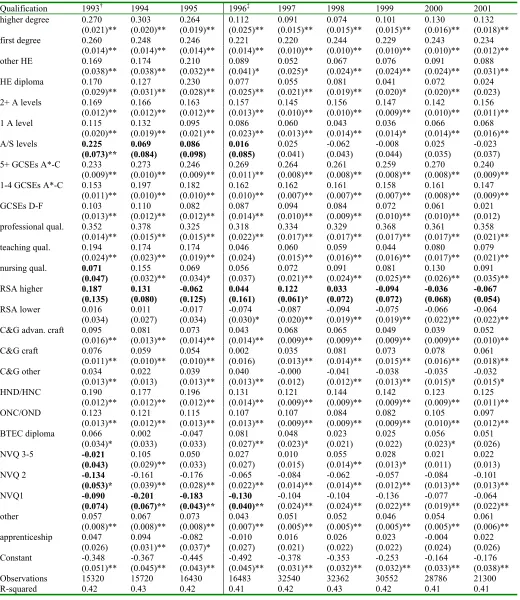
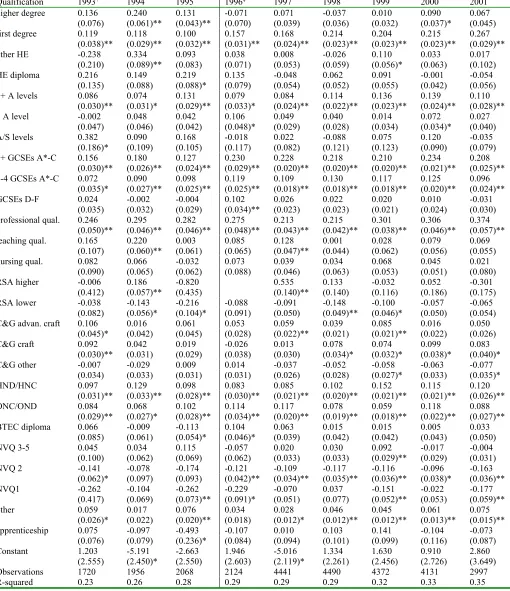
Table 2 begins the results section by listing the estimated returns to all detailed
qualifications for each of the years for which pay data is available in the LFS. All of
the estimated returns control for a quadratic in age, ethnicity, region, workplace size
and (except for 1993) public or private sector status. These variables generally attracted
statistically significant coefficients of the expected sign.
16
more than three qualifications), and so the estimated returns to the qualifications that we
do observe will be conflated with the returns to the qualifications that we do not
observe. Obviously, this will be more a problem for individuals who have reached the
higher qualifications levels and who are therefore more likely to have acquired more
than three qualifications. Looking at the results in Table 2, we can see that this is the
case, with the estimated returns to higher degrees being a particular problem. The most
likely route towards acquiring a higher degree will be the academic route of GCSEs, A
levels, first degree and higher degree, in which case the GCSE qualifications would not
be recorded amongst virtually all such respondents prior to 1996, and so the estimated
returns to a higher degree would be biased upwards by including the returns to GCSEs
as well. This is exactly what we observe in Table 2, with the estimated returns from a
higher degree falling by about 15 percentage points between 1995 and 1996. For many
of the lower level qualifications, however, such a bias will not be involved, because
most respondents with those qualifications will not have three or more other
qualifications at a lower level. In addition, there is little evidence of a reverse bias on
the returns to these qualifications. The previous section described how, prior to 1996,
we only observe low level qualifications being held by individuals with no higher
qualifications (otherwise the low qualifications would not feature amongst their three
highest qualifications), while from 1996 onwards we observe all individuals holding
low level qualifications. Thus, prior to 1996, the estimated coefficients on these low
level qualifications may have been downwardly biased. As stated, however, there is no
evidence for the estimated returns to low level qualifications being consistently lower
pre-1996 compared to post-1996, and so there is no evidence of this bias. It would
therefore appear that the returns to these low level qualifications do not depend on
further qualifications obtained. For the lower level qualifications, we can therefore
consider the whole period from 1993 to 2001 as a continuous time series, with any
negative ability bias that does exist being no stronger prior to 1996 (when the low
qualification holders observed are more likely to be those without higher level
qualifications) than post 1996 (when we observe all low level qualification holders).
Male Returns to Academic Qualifications
17
degree are about 24-28%
9, the returns to acquiring 2 or more A levels are 15-17%, and
the returns to acquiring 5 or more good (grade C or above) GCSEs are about 26-31%.
Since we measure and include all qualifications held by individuals, the dummy
variables indicating the acquirement of each qualification are not mutually exclusive.
Hence, in each case, the interpretation of the coefficient is the earnings of someone
holding the qualification in question, compared to an individual who does not. As
always with regression equations, the comparison is made ceteris paribus, that is
holding all other variables included in the analysis constant, which of course includes
the other qualifications held. Thus, for example, the coefficient on the degree variable
indicates that graduates earn 24-28% more than non-graduates, holding constant other
qualifications obtained across this comparison
10. In a similar way, the estimated returns
to a low qualification, for example a City and Guilds ‘other’ qualification will be
measured relative to all individuals who do not hold such a qualification. The
comparison group therefore will include amongst their number graduates who have no
vocational qualifications. Of course, this fact is controlled for via the inclusion of the
degree variable, and so it is a fair comparison. We would be comparing an individual
with a City and Guilds ‘other’ qualification to an individual without such a qualification
holding constant all other qualifications obtained across the comparison
11. Note that in
the ‘all qualifications’ specifications used throughout this report, the returns are
cumulative, so an individual acquiring all three of the academic qualifications described
above could expect to increase his or her earnings by the cumulative sum of the
estimated returns (ie somewhere in the order of 70%).
It is interesting that the distinctions, not made in the earlier report (Dearden et al, 2000)
due to the limitations of the other data sets used, between obtaining 2 or more A levels
or only 1, and between obtaining 5 or more good GCSEs or less than 5, are important to
9
Calculated as e
β- 1, where
β
is the estimated coefficient in the log wage equation, as listed in the tables.
10
Essentially we are saying that, regardless of other qualifications obtained, a degree will increase
earnings by 24-28%. This ignores the possibility that there are interactions amongst the qualifications, so
that, for example, a degree might be more valuable to someone without A levels than someone with A
levels (or indeed vice versa). It is not possible to investigate all possible interactions between
qualifications, as cell sizes would quickly diminish when considering less popular combinations of
qualifications. Section 3 (iv) below will consider how the returns to post-school qualifications vary
according to school qualifications obtained, however.
11
There remains the possibility that the ‘treatment’ group with the qualification differ from the ‘control’
18
the estimated returns. The estimated returns to a single A level are only 4-9%
(compared to 15-17% for 2 or more), while the estimated returns to obtaining less than
5 good GCSEs is only 16-17% (compared to 26-31% for 5 or more). These distinctions
have been used in classifications of qualifications to NVQ levels, for example,
individuals with only 1 A level are often classified to NVQ level 2 rather than level 3,
while individuals with less than 5 good GCSEs are often classified to NVQ level 1
rather than level 2. The results presented here suggest that such distinctions are
appropriate.
Of the remaining academic qualifications, the two higher education, sub-degree
categories, other HE and HE diploma
12, attract returns of around 5-10% and 2-8%
respectively, and therefore do not appear as valuable in the labour market as the more
typical academic qualifications. At the other end of the scale, low grade GCSEs (grades
D-F) also yield only 6-11% returns, which may, if the figure for 2001 is to be believed,
have fallen to zero by the end of the period.
Male Returns to Vocational Qualifications
Turning now to the vocational qualifications, the largest returns are received, as
expected, by graduate level professional qualifications (such as in law or accountancy),
which raise wages by 36-45% for men
13. Below this, however, the returns to vocational
qualifications are not as high, and in particular are not as high as the academic
qualifications at the notionally same NVQ level
14. At NVQ level 4, teaching
qualifications receive a return of about 5-8%, nursing qualifications 6-14% and
HNC/HNDs 13-15% for men
15, while at level 3, Advanced Craft City and Guilds
qualifications receive a return of around 4-10% and ONC/ONDs 8-13%. Craft level
City and Guilds qualifications also seem to earn a significantly positive return for men
12
Note that the returns to these two qualifications also appear to be heavily biased upwards prior to 1996,
as there is a substantial fall in their estimated returns from 1996 onwards. It would appear that both of
these qualifications are typically preceded by at least 3 other qualifications.
13
However, recall the discussion in the previous section which predicted that the coefficient on the
professional qualifications variable would be biased upwards, since individuals with such qualifications
are not given the opportunity to also record any degrees that they hold. The observed returns to
professional qualifications are therefore likely to be conflated with the returns to degrees.
14
Though consideration should be given to the amount of time required to obtain these qualifications, as
was done in Dearden et al (2000), to derive a truer rate of return to the various qualifications. When this
is done, the gap between the rates of return to academic and vocational qualifications closes. Such an
analysis will not be repeated here, however.
15
Note that the estimated returns to some of these qualifications appear to be biased upwards prior to
19
of around 4-8%, but all other low level vocational qualifications do not appear to attract
any statistically significant positive return
16. Indeed, many of the estimated returns are
negative. It should not be concluded that an individual acquiring such qualifications
would actually suffer a wage penalty, however. It is instead likely that our wage
equations are not controlling for important characteristics of individuals that influence
wage outcomes. Thus, the type of individual who applies for and acquires a low level
vocational qualification is likely to be the type of individual with low earning power in
the labour market, causing the observed negative correlation. This does not mean,
however, that such individuals are penalised for acquiring such qualifications.
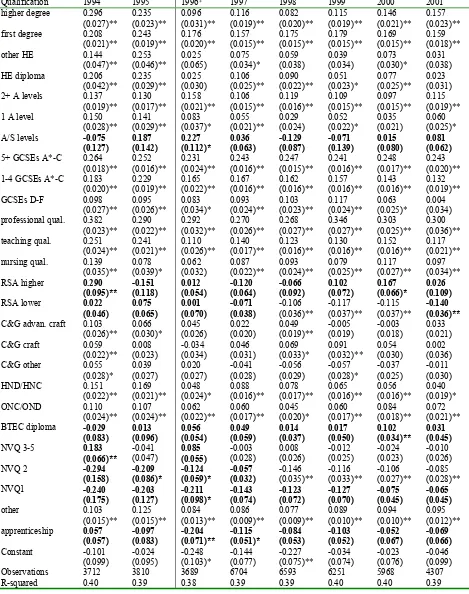
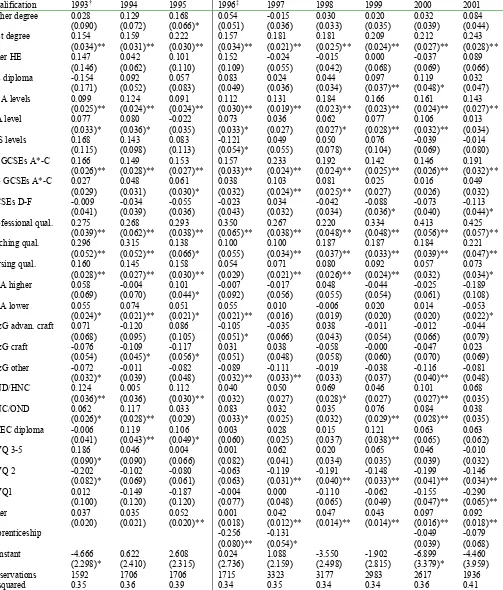
Female Returns
The results for women are contained in Table 3. The range of estimated returns to the
key academic qualifications are virtually identical to those estimated for males (25-27%
for first degrees, 14-16% for 2 or more A levels and 25-30% for 5 or more GCSEs).
Thus, there appears to be little evidence for better returns to academic qualifications for
women. With respect to vocational qualifications, the more beneficial qualifications
for women to obtain differ from those for men. In addition to professional
qualifications again, the vocational qualifications with the highest return for women are
teaching (27-32%) and nursing (15-18%) qualifications. HND/HNCs earn a 7-9%
return for women (lower than the equivalent return for men) while ONC/ONDs earn a
5-11% return. There is some evidence for a positive return to higher level RSA
qualifications in some years, but no evidence for a positive return to more craft-based
qualifications such as City and Guilds qualifications for women. The differences
therefore reflect gender differences in the type of vocational qualifications studied, with
men benefiting more from craft-based qualifications, while women see higher returns to
teaching, nursing and, to a lesser extent, higher RSA qualifications
17. As for men,
however, other low level vocational qualifications fail to attract statistically significant
positive returns for women.
16
Note however that other work has found positive effects of these lower level vocational qualifications
on employment probabilities. For example, our earlier work in Dearden et al (2000) found that NVQ
qualifications at both level 1 and level 2 have statistically significant positive effects on the probability of
employment for women.
17
As a consequence of this gender division, we also observe higher standard errors for
20
Variation in Returns Over Time
Turning now to one of the key questions of interest in this study, how have the returns
to the various qualifications varied over time? The answer is, remarkably little. If we
compare the estimated returns to each of the qualifications in 2001, they are very
similar to those obtained in 1996 (or in 1993, if a comparison with the earlier years
appears valid, for example for the lower level qualifications). Many 2001 coefficients
are within 1 or 2 percentage points of their 1996 or 1993 equivalents. For example,
consider the key academic qualifications. The estimated coefficient on the degree
variable for men is 0.234 in 2001 and 0.221 in 1996 (0.239 and 0.234 respectively for
women). Similarly, with respect to 2+ A levels, the estimated coefficient for men is
0.156 in 2001, 0.157 in 1996 and 0.169 in 1993 (0.146, 0.135 and 0.149 respectively for
women). For obtaining 5 or more GCSEs at grade C or above, the estimated coefficient
for men is 0.240 in 2001, 0.269 in 1996 and 0.233 in 1993 (0.221, 0.232 and 0.252
respectively for women). The pattern is similar for the key vocational qualifications
(which, recall, differ according to gender). The estimated coefficient on the HNC/HND
variable in the male equations is 0.125 in 2001 and 0.131 in 1996. Similarly for
ONC/ONDs, the estimated coefficient changes only from 0.107 to 0.097 between 1996
and 2001. For women, the estimated coefficients on the teaching and nursing
qualifications are 0.251 and 0.165 respectively in 2001, compared to 0.267 and 0.154
respectively in 1996.
21
insignificance by the end of the 1990s, after attracting a small positive return in the
earlier part of the decade.
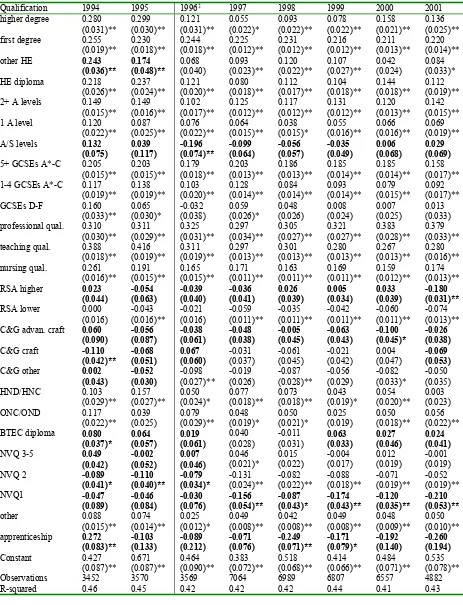
(ii) The Returns to Qualifications in the Public and Private Sectors
A second area of interest for this research project is how the estimated returns to the
various qualifications differ between the public and private sectors. The results are
detailed in Tables 4 and 6 for men and in Tables 5 and 7 for women.
Academic Qualifications in the Two Sectors
We consider the situation for males first. The fact observed above in the overall results,
that the estimated returns have not varied much over time during the 1990s, is on the
whole also apparent when the results are disaggregated into public and private sectors,
and so the comparison that follows will focus mainly on the difference across sectors in
the level of estimated returns in 2001. The first point to be made when comparing
Tables 4 and 6 is that the returns to the higher level academic qualifications are greater
in the private sector than in the public sector
18. Individuals with such qualifications will
therefore receive a better return on their investment in human capital in the private
sector. Thus, for example, holding a first degree raises wages by 29% in the private
sector in 2001, compared to just 17% in the public sector. Similarly other HE
qualifications below degree level increase wages by 3% and 13% in the public and
private sectors respectively, while the equivalent effects for holding 2 or more A levels
are 12% and 18% respectively. The differences in the first degree and A level returns
are statistically significant. The same findings are not observed for women, however,
for whom the returns to higher level academic qualifications are more similar in the two
sectors (25% and 30% returns to a first degree in the public and private sectors
respectively, and 15% and 16% returns to two or more A levels in the public and private
sectors, respectively, neither difference being statistically significant).
For lower academic qualifications, the situation is reversed. Thus, although women
with five good GCSEs earn a 27% return to these qualifications in the private sector, in
18
Interpreting these sectoral differences is not easy. For example the returns to degrees are estimated to
22
the public sector their return is only 17% in 2001. For males, on the other hand, the
return to five good GCSEs is very similar in the two sectors; 28% in the public sector
and 26% in the private sector (in 2001, the private sector return having been about 30%
in most of the earlier years). Finally on the academic side, it was noted above that the
returns to low (grades D-F) GCSEs have declined to zero for both males and females by
2001. The results in Tables 4-7 show that this is the case in both the public and the
private sectors; in neither do the low level GCSEs appear to have any market value by
2001.
Vocational Qualifications in the Two Sectors
Turning now to vocational qualifications, one anticipated result was that teaching and
nursing qualifications would yield higher returns in the public sector than in the private
sector, because of the occupations to which they lead. Most individuals working in the
public sector with a teaching or nursing qualification are actually working in these
professions. While some individuals working in the private sector with these
qualifications are still working in private education or private health institutions, the
majority are working in unrelated occupations, however, presumably having turned
their backs on teaching and nursing, and are therefore not specifically using the training
that they received. We would not therefore expect the holding of nursing and teaching
qualifications to have much effect on the wages unearned in these unrelated private
sector occupations. This is indeed the case, the holding of teaching and nursing
qualifications having no impact on the earnings of those men working in the private
sector, while increasing the wages of men working in the public sector by 12% and 10%
respectively. Similarly, the hourly wages of women working in the public sector are
increased by 32% and 19% on average through the holding of teaching and nursing
qualifications respectively. Nursing qualifications also seem to boost the earnings of
women working in the private sector, by 13%, although the impact of teaching
qualifications for women in the private sector is statistically insignificant.
23
sectors for women). The findings are similar for the craft-based City and Guilds
qualifications, none of which earn significantly positive returns for either men or
women in the public sector. In the private sector, Advanced Craft and Craft level City
and Guilds qualifications yield significantly positive returns for men, and Craft level
City and Guilds only for women. Of the remaining vocational qualifications, it was
observed above in the aggregate data that none attracted positive and statistically
significant coefficients. In the sectoral analysis, this conclusion is modified slightly, in
that NVQ levels 3-5 qualifications appear to yield small but significant returns in some
years for both men and women working in the private sector, though no benefit is
accrued working in the public sector.
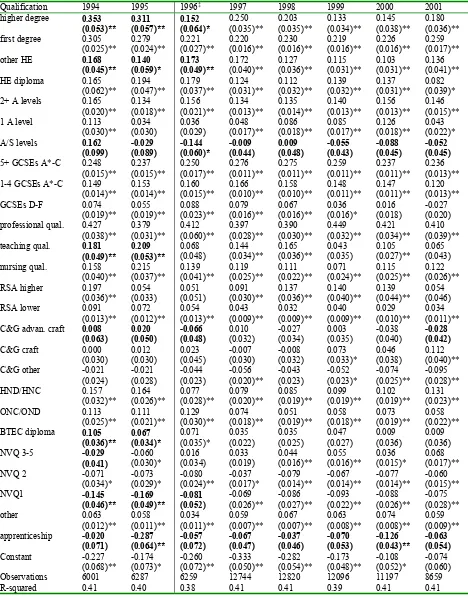
(iii) Pseudo Cohort Analysis
Tables 8 through to 20 contain the results for the estimated returns to all of the
qualifications, for the various pseudo cohorts in the LFS (those initially aged 21-25,
26-30, 31-35, 36-40, 41-45, 46-50 and 51-55 in January 1993). The initial plan behind the
pseudo cohort analysis was to use the estimated returns to build a picture of the lifetime
age-earnings profiles of individuals with the various qualifications, by following one
cohort over the years 1993 to 2001, and then overlapping the estimated returns for the
subsequent cohort, and so on, as described above in the Introduction. However, in the
case of most qualifications, the estimated coefficients do not display a smooth pattern,
and so their usefulness for the proposed task is doubtful.
24
estimated coefficient is approximately four standard errors wide, this means that the
confidence intervals for the coefficients on the academic qualifications are at least 10
percentage points wide, while those for the coefficients on the vocational qualifications
are at least 12 percentage points wide, and often larger. It is therefore perhaps to be
expected that as we take repeated point estimates within these confidence intervals (as
we are doing for each of the individual years) then there might not be a stable pattern of
results
19.
Nevertheless, the results of the pseudo cohort analysis are not entirely without use. A
few observations can be made. First, comparing the returns to the various qualifications
across the various cohorts, there does not seem to be a very large difference in the
average estimated returns (abstracting from the annual fluctuations in the estimated
returns across years for a single cohort). The estimated returns to each of the
qualifications, described above for the full sample, therefore seem to hold, at least to a
first degree of approximation, in each of the cohorts that we observe. Thus it does not
seem to be the case that returns rise or fall as individuals get older.
There are some exceptions to this general rule, however. For example, consider first
degrees. For males, the results in Table 8 show that for the youngest cohort (those aged
21-25 on January 1
st1993, the returns to a degree increase each year from around 12%
in 1993 to around 31% in 2001
20. We know that these changes cannot be cohort effects,
because we are considering a single (pseudo) cohort, so the reason for the increase in
the returns to a first degree over the decade could be either a time effect or an age
19
We attempted to reduce this problem by grouping the various qualifications together, thus increasing
cell sizes and reducing standard errors and hence the range of the confidence intervals within which the
point estimates are obtained. The groups of qualifications used were some kind of degree (higher and
first degrees), some other HE qualification (other HE and HE diploma), A levels or equivalent (2+ A
levels, 1 A level or A/S levels), GCSEs at some grade (5+ GCSEs A*-C, 1-4 GCSEs A*-C, GCSEs D-F),
professional qualifications, vocational level 4 qualifications (teaching qualifications, nursing
qualifications, HNC/HND), vocational level 3 qualifications (RSA Higher. C&G Advanced Craft,
ONC/OND NVQ3-5), vocational level 2 qualifications (C&G Craft, NVQ2), vocational level 1
qualifications (RSA lower, C&G ‘other’, BTEC diploma, NVQ1) and other qualifications. The results
are set out in Tables A8-A20 in the Appendix. Despite the use of these larger qualifications groups, the
results are still not consistent enough to trace out a stable age-earnings profile. The general pattern of the
results in these tables is broadly consistent with that of the main set of results for the list of detailed
qualifications, and so the former will not be discussed further here.
20
For the aggregate results discussed above, the 1993-1995 first degree results were not used, because of
25
effect. Given that the aggregate results for the full population in Table 2 suggested that
the returns to a first degree have been roughly constant over the period considered, it
seems reasonable to suggest that the results observed for the (initially) 21-25 year old
cohort in Table 8 are age effects, and that the returns to holding a first degree amongst
these men do increase as they age from 21-25 years old in 1993 to 29-33 years old in
2001. This increase in the returns to a first degree seems to end when men move into
their early thirties however. If we consult the results for the older cohorts in the
subsequent tables, we see that the returns to a first degree stay reasonably constant in
the 20-30% range. Of course, there is now the potential that we are confusing age and
cohort effects, as we are considering different (pseudo) cohorts of men, and it may be
that our youngest cohort differ in some way from the oldest cohort, such that the degree
returns will continue rising when they are aged in their thirties, and throughout their
working lives, whereas the degree returns for the older cohorts remain constant with
age. While such a possibility cannot be ruled out on the basis of the evidence presented
here, it is very difficult to think of a reason why the youngest cohort should have these
different characteristics, and it would appear that more faith could be put in the age
effects explanation. It is therefore concluded that the returns to a degree for men rise
with age throughout their twenties, before reaching a plateau and staying roughly
constant throughout the remainder of their working lives
21. For women the results are
very similar. Considering only the years 1996-2001
22, there was an increase in the
returns to a degree in each year for those initially aged 21-25, as shown in Table 9,
increasing from 17% in 1996 to 28% in 2001
23. For the older female cohorts in the
subsequent tables, however, the returns to a first degree are fairly constant, showing the
usual yearly fluctuation evident in all of these pseudo cohort analyses around an
average of about 25-28%.
21
The exception is the oldest cohort of men, initially aged 51-55 in 1993, for whom the results in Table
20 clearly show that the returns to a degree are well over 30% in each of the years studied except 2001.
While it is possible that the returns to a degree do undertake a sudden rise at the end of mens’ working
lives, after years of staying relatively constant, the possibility of cohort effects seems more likely in this
case, such that individuals who were born between 1937 and 1941 and obtained degrees are quite
different from subsequent generations of graduates. Certainly it would be unwise for current graduates to
expect a boost to their income late in their working lives, on the basis that individuals born 40 years
before them received such an increase.
22
The 1993-1995 results are not discussed here for women, because there is a steep fall in the estimated
returns to a degree for initially 21-25 year old women between 1995 and 1996, suggesting the importance
of the usual upwards bias in the coefficients for the early years of the period.
23
This is very similar to the increase in the returns to a degree for young men over the same period, as
26
There is also some evidence of a similar, if less dramatic, effect for another key
academic qualification; namely 2+ A levels. For example, the male cohort who are
initially aged 21-25 at the beginning of 1993 earn a 9% return to possessing two or
more A levels, which increases up to 15% by 2000 (although the variation in returns
across years sees the point estimate fall to 12% in 2001). For all subsequent male
cohorts, however, these returns fluctuate across the years studied around a mean level
somewhere in the range 17-20%. Similarly, the returns to two or more A levels begin at
10% for the initially 21-25 year old female cohort in 1993, rising to 17% by 2001 (again
falling to 15% in 2001). In all subsequent female cohorts, however, we do not observe
further increases in the returns to two or more A levels with age, which average just
under 20% across the various years of the study in each cohort.
There is little evidence of such an increase with age in the returns to obtaining five or
more good GCSEs, at least for males. These returns generally average in the mid to
high twenties range for each of the cohorts for men. There is some evidence that they
average above 30% in the cohorts who are initially 41-45 and 46-50 years old. It is
difficult to explain why the returns to GCSEs should suddenly take a turn for the better
at this age, however, and it seems more likely that we are witnessing cohort effects
rather than age effects here. For women, there is some evidence for rising returns to
five or more good GCSEs in the early years of their careers. These returns range from
15% to 26% during the period of study for the cohort initially aged 21-25, although not
showing a monotonic increase during the period, as generally witnessed for degrees and
A levels. For the cohort initially aged 26-30, this range is from 19% to 33%, and from
27% to 35% for those aged 31-35 in 1993. After this, the returns to five or more good
GCSEs level out for women, and average just less than 30% for each of the subsequent
cohorts.
27
increase in the returns to HNC/HNDs for men with age, at least until we reach the final
cohort (initially aged 51-55), for whom there does seem to be some evidence of
statistically higher returns. We have seen a similar phenomenon amongst this cohort for
the academic qualifications, however, and it is more tempting to assign this to a cohort
effect than to any age effect.
No other vocational qualifications appear to show any age effect in terms of rising
returns. Searching for cohort effects rather than age effects, a possible hypothesis could
have been that we may observe higher returns to the craft-based qualifications, such as
the City and Guilds qualifications or apprenticeships, amongst the older cohorts, who
have obtained good jobs in earlier years through these qualifications, and are still
gaining the higher returns in the 1990s, while such qualifications may not be valued as
highly amongst the younger cohorts as they search for appropriate jobs and career
paths. There is no evidence of such an effect, however, with the returns to Advanced
Craft and Craft City and Guilds qualifications displaying a similar average level
(somewhat less than 10%) for all cohorts of men in each case, while there are no
statistically significant positive coefficients for ‘City and Guilds other’ or
‘apprenticeship without qualifications’ in any of the years for any of the cohorts
24.
A similar picture emerges for women, with few vocational qualifications revealing any
clear patterns of returns with respect to age. The exceptions to this rule for women are
the teaching and nursing qualifications. The returns to these qualifications definitely
seem to increase with age. Thus amongst the female cohort initially aged 21-25, the
returns to a teaching qualification average out at 18% for the six years from 1996 to
2001, with the returns to a nursing qualification similarly average out at 7%. The
following cohort receives little if any improvement on these returns. However, by the
time we reach the cohort initially aged 31-35 in 1993, there appear to be definite
increases in the estimated returns to nursing qualifications (averaging out at 17% across
the six years), and smaller increases in the returns to teaching qualifications (averaging
at 21%). In the following cohort (initially aged 36-40 on January 1
st1993), the returns
to teaching qualifications also show this definite step up in returns (ranging from 24%
to 33% between 1996 and 2001). The increase in returns then continues into the final
24
With the exception of a single statistically significant estimated return of 10% to an apprenticeship
28
cohorts of women, those aged initially 41-45 receiving returns of over 30% to teaching
qualifications and over 15% to nursing qualifications in every year studied. The final
cohort of women (initially aged 46-50) receive returns to nursing qualifications above
23% in every year studied. Thus, there appears to be a general increase in the estimated
returns to these professional vocational qualifications for women, who dominate these
professions. Of course this conclusion is based on our cohort analysis, and so it is
possible that we are observing cohort effects rather than age effects, and that teaching
and nursing qualifications newly gained will not display this pattern of rising returns
with age for future cohorts. However, in this case, the age effect interpretation seems
entirely reasonable, given the public sector nature of these professions, with the
attendant use of salary pay scales that are navigated mainly according to tenure. In
addition, promotions to the more senior, administrative, and better-paid posts in these
professions are almost always awarded on the basis of age and seniority. Thus it
appears that women with teaching and nursing qualifications working in these
professions have to wait to receive the highest returns to these qualifications, but
eventually they do increasingly earn more than women without these qualifications.
(iv) The Returns to Academic and Vocational Qualifications by Highest School
Qualification Obtained
29
whose highest school qualifications was 1 A level (or its equivalent)
25and finally those
whose highest school qualifications were at least 2 A levels (or their equivalent). The
idea behind the analysis is to estimate the returns to qualifications for the marginal
student (ie the last student to obtain a qualification) rather than for the average student.
It seems reasonable to assume that the marginal student will come from the lower
school qualification groups (no qualifications and GCSEs at grades D-F), at least for the
lower level post-school qualifications, and so more attention will be focused on these
groups in the discussion. Of course, extra students onto each qualification will come
from each of the school qualifications groups identified. However, the problem for us
is that we cannot identify which individuals were just indifferent between taking a
qualification or not, and which individuals were always going to study for that
qualification. Very few characteristics of individuals are available in the LFS, with
which we could make such an identification of education choice. The level of
qualifications obtained at school will, however, play a part in future decisions about
which qualifications to undertake, and so we use this as our definition of marginal
students, the assumption being that individuals with low qualification achievements at
school are, on average, less likely to study for further qualifications post-school.
We saw in the previous section that results can become quite erratic over time when we
reduce cell sizes, and so there is a risk that the same will happen with the marginal
student analysis, as we divide the population into level of highest qualification at
school. Therefore, since the results at the beginning of Section 3 suggested that the
returns to qualifications have been very stable over the period considered in this report,
we decided to pool the observations from the years for which we have consistently
measured qualifications information, namely 1996-2001, and estimate a single equation
for each level of school achievement across these years.
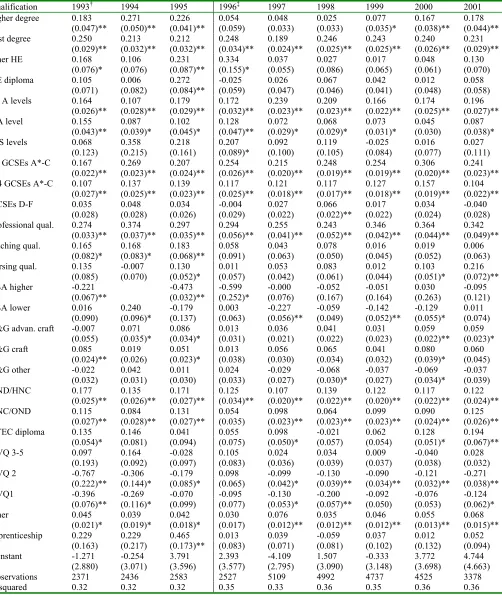
26The results are contained in
Tables 21 and 22 for males and females respectively.
Male Returns by Highest School Qualification
25
Included in this group were the few respondents for whom A-S levels were the highest school
qualification obtained.
26
This approach was not adopted in the cohort analysis above, because the original motive for that
30
Considering first men, we examine first the estimated returns to a degree. These returns
are huge (54%) for the group with no school qualifications. This should not come as a
surprise. Any individual who did not even achieve a single GCSE qualification at
grades D-F, but nevertheless goes on to achieve a degree, is going to very much stand
out amongst their group of peers with a similar lack of school level qualifications, and
so we would expect them to earn very much more. For those with no school
qualifications, the rewards to obtaining Higher Education qualifications will be very
high compared to what their situation would otherwise be. However, not too much
should be made of this result, as the number of individuals who obtain no qualifications
at school, and yet go on to obtain a degree, is very small.
27It might have been expected
that a similar situation would occur for the group with the lowest level of school
qualifications (GCSEs at grades D-F), but this does not seem to be the case, with the
estimated returns to a degree for this group being the lowest of all the groups
considered, at 13%. Considering the returns to a degree amongst the remaining four
groups, who hold at least one GCSE at grades A*-C, these are remarkably similar,
ranging only between 14% (1 A level) and 20% (2+ A levels). The return to a degree
therefore seems to be largely independent of the level of school qualification held, as
long as some school qualifications are held.
The same conclusion is not reached with respect to most of the other higher level
qualifications, however. For example, the returns to a higher degree appear to be less
for the 2+ A level groups than for the lower achievers at school. Similarly, other
Higher Education qualifications below degree level (other HE and HE diploma) both
fail to attract statistically significant returns for either of the A level groups, while they
are of benefit to individuals who obtain at best GCSEs or below at school. Indeed, the
only other qualifications to yield statistically significant returns to the 2+ A levels group
are professional qualifications (32%), teaching qualifications (2%) and ‘other’
qualifications (4%). The group who obtained at best only 1 A level at school in
addition receive some benefit from HNC/HNDs and BTEC diplomas. It does not seem
27
In addition, given the exceptional nature of this circumstance, we might worry about measurement
31
to be worthwhile for individuals who have reached A level standard at school taking
any further qualifications other than degrees or professional qualifications
28.
It might seem surprising that an HNC/HND qualification yields no positive return to
individuals with 2 or more A levels. After all, an HNC/HND is notionally a level 4
qualification, while holding two or more A levels puts an individual at level 3.
However, as we have seen, an HNC/HND adds nothing to the market value of
individuals who have achieved two or more A levels. The main benefit of such
qualifications would therefore appear to be for those with at best lower level school
qualifications. As we move down the spectrum of school level qualifications, the value
of an HNC/HND qualification grows, as expected being very high for the group with no
school level qualifications, for the same reasons as discussed above.
Considering the lower level qualifications, and their benefit to individuals with lower
level school qualifications, those males with at best five or more good GCSEs obtained
at school earn an 8% return to an ONC/OND. A BTEC diploma and an NVQ
qualification at levels 3-5 also yield positive and statistically significant returns of about
4% each to this group. Going down further to the group of males with at best 1-4 good
GCSEs from school, they receive slightly higher returns to each of these qualifications,
specifically 14% to an ONC/OND, 5% to a BTEC diploma and 5% to an NVQ3-5
qualification.
Of key interest are the returns to vocational qualifications at levels 2 and 3 for the group
with no, or very low, school qualifications, since these are likely to be the marginal
students it is hoped to attract onto such courses. Therefore we do not consider the high
returns to a degree that were observed above for this group, because of the unusualness
of this situation, and instead focus on the benefits of obtaining lower level vocational
qualifications for this group who have struggled in school. The results reveal that for
males with no school qualifications at all, an ONC/OND qualification raises wages by
28
In actual fact we observe negative coefficients on all lower level vocational qualifications for the group
32
16%, a City and Guilds Advanced Craft or Craft qualification both by 6% and a low
level City and Guilds qualification by 2%, while an NVQ qualification at levels 3-5
raises their wages by 8%. In addition, an apprenticeship without qualifications attracts a
statistically significant positive return amongst the no school qualifications group, of
6%. It is still the case, however, that NVQ level 1 or 2 qualifications do not earn a
statistically significant positive return, even amongst this group with no school level
qualifications.
Female Returns by Highest School Qualification
Finally considering the returns to groups of women by highest school qualification,
these are on the whole similar to the results discussed above for men. Thus,