RESEARCH PAPER
03/40
6 MAY 2003
Social Indicators
This research paper summarises a wide range of social
statistics. Subjects covered include crime and justice,
defence, education, elections, health and population.
Regular updates of individual pages, together with
spreadsheets containing raw data, are available to
members and staff on the parliamentary intranet.
This edition’s includes:
Article: Higher education applications
Topical subject pages:
- Severe Acute Respiratory Syndrome (SARS)
- London congestion charge
Adam Mellows-Facer - Editor
SOCIAL & GENERAL STATISTICS
Library Research Papers are compiled for the benefit of Members of Parliament and their
personal staff. Authors are available to discuss the contents of these papers with Members and
their staff but cannot advise members of the general public. Any comments on Research
Papers should be sent to the Research Publications Officer, Room 407, 1 Derby Gate, London,
SW1A 2DG or e-mailed to [email protected]
ISSN 1368-8456
Recent Library Research Papers include:
03/25
The
Waste and Emissions Trading Bill
[Bill 66 of 2002-03]
19.03.03
03/26
Unemployment by Constituency,
February
2003-03-20
19.03.03
03/27
The
Licensing Bill [HL]
[Bill
73
of
2002-03]
20.03.03
03/28
Ballistic
Missile
Defence
26.03.03
03/29
The
Sustainable Energy Bill
[Bill
20
of
2002-03] 26.03.03
03/30
The
Crime (International Cooperation) Bill [HL]
28.03.03
[Bill 78 of 2002-03]
03/31
The
Crime (International Cooperation) Bill [HL]:
'Hot Surveillance'
28.03.03
[Bill 78 of 2002-03]
03/32
Parliamentary Questions, Debate Contributions and Participation in
31.03.03
Commons
Divisions
03/33
Economic Indicators [includes article: Changes to National Insurance
01.04.03
Contributions, April 2003]
03/34
The
Anti-Social Behaviour Bill
[Bill
83
of
2002-03]
04.04.03
03/35
Direct
taxes:
rates
and
allowances
2003-04-11
10.04.03
03/36
Unemployment
by
Constituency,
March
2003
17.04.03
03/37
Economic Indicators [includes article: The current WTO trade round]
01.05.03
03/38
NHS Foundation Trusts in the Health and Social Care
01.05.03
(Community Health and Standards) Bill [Bill 70 of 2002-03]
03/39
Social
Care 02.05.03
Research Papers are available as PDF files:
• to members of the general public on the Parliamentary web site,
URL:
http://www.parliament.uk
CONTENTS
I
Introduction to Social Indicators
i
II
Contacts for further information
ii
III
Article: Higher education applications update
iii
IV Topical subject pages v
A Severe Acute Respiratory Syndrome (SARS)
B London congestion charge
V
Regular subject pages
1 Agriculture
1
2
Crime and justice
3
3 Defence
9
4 Education
12
5 Elections 20
6 Environment and energy 2
5
7 Health
27
8 Housing 3
2
9 Local
government
36
10 Population and migration 3
8
11 Social
security 4
4
12 Transport 4
6
List of regular subject pages
Agriculture
1.1
Agricultural
incomes
and
subsidies
1
1.2
Agricultural
labour
and
output
2
Crime and justice
2.1
Police
numbers
3
2.2
Police
funding
4
2.3
Crime
5
2.4
Crime:
international
comparisons
6
2.5
Drug misuse
7
2.6
Prison
population
8
Defence
3.1
Defence
employment
9
3.2
Defence
expenditure
10
3.3
Defence
exports 11
Education
4.1
Class sizes
12
4.2
Schools 13
4.3
Teachers
14
4.4
Examination results
15
4.5
Participation:
16-18
year
olds
16
4.6
Applicants and entrants to higher education
17
4.7
Participation
in
higher
education
18
4.8
Education
expenditure 19
Elections
5.1
General
election
results 20
5.2
Other
elections 21
5.3
Turnout 22
5.4
Voter characteristics
23
5.5
Opinion
polls
24
Environment and energy
6.1
Road
fuel
prices
25
6.2
Energy and CO
2emissions
26
Health
7.1
Waiting lists
27
7.2
Health
expenditure
28
7.3
Beds
and
activity
29
7.5
Community care
31
Housing
8.1
Dwellings
completed
32
8.2
House prices
33
8.3
Homeless
34
8.4
Rough
sleeping 35
Local government
9.1
Local
government
finance
36
9.2
Council
tax
37
Population and migration
10.1
Population
38
10.2
Infant
deaths
and
life
expectancy
39
10.3
International
migration 40
10.4
Asylum
seekers 41
10.5
Asylum
decisions
42
10.6
Ethnicity
and
religion
43
Social security
11.1
Social
security
benefits
and
expenditure
44
11.2
Pensions
and
pensioners’
incomes
45
Transport
12.1
Road
accident
casualties
46
12.2
Road
traffic
47
12.3
Public
transport 48
12.4
Rail
performance
and
fares
49
12.5
Freight
50
Miscellaneous
13.1
Internet
access
51
i
I
Introduction to Social Indicators
Social Indicators is produced three times a year following the Christmas, Easter and
Summer recesses by the Social & General Statistics section. The paper includes a series
of subject pages that cover a wide range of social statistics. Each edition of the paper also
includes topical articles and subject pages. The coverage is intended to be
complementary to the Economic Indicators research paper, which is produced by the
Economic Policy and Statistics section.
The Social Indicators intranet pages are now available to Members and staff who are
connected to the PDVN.
1These will include statistics on the same topics as the research
paper. However, these pages have a number of additional features:
•
Subject pages will be updated when new statistics are released.
•
Users will be able to download the underlying data, which frequently includes a
longer time series and/or additional information.
•
Links to publications/websites on the internet and other Library publications
specifically related to the topic.
Subjects have been chosen from those that receive the most public attention and those that
we think are most useful to Members. These include some international comparisons
alongside nationally based statistics. Every attempt has been made to match the
geographical coverage of these topics to the powers of the UK parliament. Where
possible, links are included on the intranet pages to statistics that cover the rest of the UK.
The range of topics included in Social Indicators and the content of the intranet pages will
be regularly reviewed. If you have views on either, please contact the Head of Section,
Richard Cracknell (x4632) or the editor, Adam Mellows-Facer (x6969).
i
II
Contacts for further information
Members and staff who require further information on a particular subject should contact
the relevant statistician as detailed below. A comprehensive guide to the subject coverage
of Research Service specialists is available in
Who Does What in Research
.
Subject
Statistician
Tel.
Alternative
Tel.
Agriculture
Richard Cracknell
4632
Charities
Ross Young
4313
Civil service
Richard Cracknell
4632
Adam Mellows-Facer 6969
Crime and justice
Gavin Berman
3851
Ross Young
4313
Defence
Gavin Berman
3851
David Knott
2454
Deprivation
Adam Mellows-Facer 6969
Education
David Knott
2454
Gavin Berman
3851
Elections
Adam Mellows-Facer 6969
Ross Young
4313
Energy
Ross Young
4313
Environment
Ross Young
4313
Gambling/lottery
Gavin Berman
3851
Health
Adam Mellows-Facer 6969
David Knott
2454
Housing
Gavin Berman
3851
Adam Mellows-Facer 6969
Immigration
Ross Young
4313
David Knott
2454
Local government finance
Gavin Berman
3851
David Knott
2454
Media/arts
Gavin Berman
3851
Monarchy
Richard Cracknell
4632
Parliament
Richard Cracknell
4632
Adam Mellows-Facer 6969
Population
Richard Cracknell
4632
Adam Mellows-Facer 6969
Religion
Gavin Berman
3851
Adam Mellows-Facer 6969
Science
Ross Young
4313
Social security
Richard Cracknell
4632
Adam Mellows-Facer 6969
Sport
Gavin Berman
3851
Statistics
Richard Cracknell
4632
iii
III
Higher education applications update
[image:8.595.126.348.225.287.2]The Universities and Colleges Admissions Services (UCAS) provide data on admissions several times each year. Whilst subject page 4.6 assesses information provided in the annual dataset, the following article briefly considers the latest UCAS applications snapshot, showing figures for applications to UK full-time undergraduate courses at 24th March 2003.
Table 1: Applications by Gender
UK at 24 March
Women Men Total
2002 206,234 172,652 378,886 2003 215,763 177,987 393,750
% change 4.6% 3.1% 3.9%
[image:8.595.450.769.263.487.2]Source: UCAS press release 25 April 2003
[image:8.595.127.347.424.490.2]Table 1 shows that by 24 March, 393,750 applications had been received for courses starting in autumn 2003. There are 14,864 (3.9%) more applicants than the same point last year. Applications from females rose 4.6%, half as rapidly again as applications from males (up 3.1%). Females comprise now 54% of all university entrant hopefuls.
Table 2: UK students' applications by age
UK at 24 March
2002 286,505 26,038 27,978
2003 292,743 28,105 29,855
% change 2.2% 7.9% 6.7%
Source: UCAS press release 25 April 2003
<21 21 to 24 25 +
Table 2 shows that each of the three age bands (under 21, 21-24 and 25 and over), have witnessed increased numbers of applications from UK students. The largest rises occurred in the 21-24 and 25+ age groups, where 7.9% and 6.7% respective increases were recorded. The increase for the under 21 group, which accounts for over 80% of applications, was more modest at 2.2%.
Overseas applications have risen faster than those within the UK. They comprised just over 12% (43,000) of the total number of applications at 24 March, having risen by more than 10% in each of the three standard age classifications.
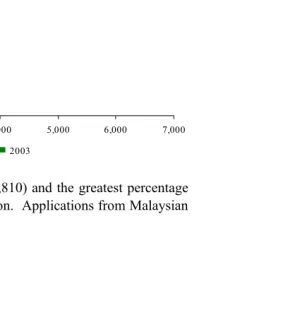
The following graph shows overseas applicants’ country of origin.
Top ten countries for overseas applications
at 24 March
0 1,000 2,000 3,000 4,000 5,000 6,000 7,000 Chi
Ire
HK
Ma l
Ger
Sin
Gre
Ind
Fra
USA
2002 2003
iv students have risen 33% on the previous year. Within the EU, Ireland has both the most applications (5,364) and the highest percentage increase (24.8%). In only two countries within the top ten did entries fall relative to the same point last year - Greece and the USA witnessed 18% and 1% respective declines.
Table 3 shows that in terms of inter-UK movement, there been falls in home country students applying for courses in other UK constituent countries.
Table 3: Inter-UK applications
at 24 March 2003
England Wales Scotland
Northern Ireland
England
2002 279,725 36,698 23,285 722
2003 287,371 36,436 22,231 792
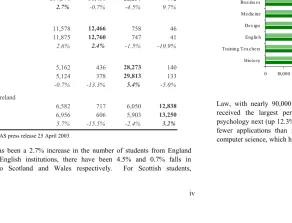
% change 2.7% -0.7% -4.5% 9.7%
Wales
2002 11,578 12,466 758 46
2003 11,875 12,760 747 41
% change 2.6% 2.4% -1.5% -10.9%
Scotland
2002 5,162 436 28,273 140
2003 5,124 378 29,813 133
% change -0.7% -13.3% 5.4% -5.0%
Northern Ireland
2002 6,582 717 6,050 12,838
2003 6,956 606 5,903 13,250
% change 5.7% -15.5% -2.4% 3.2%
Source: UCAS press release 25 April 2003
Country of institution Home country of
applicant
While there has been a 2.7% increase in the number of students from England applying for English institutions, there have been 4.5% and 0.7% falls in applications to Scotland and Wales respectively. For Scottish students,
applications fell 0.7% to English, 13.3% to Welsh, and 5.0% to institutions in Northern Ireland. Home country applications to Scottish institutions rose 5.4%. Broadly similar trends are evident for home country applications from Wales and Northern Ireland.
The following chart shows the ten subject areas that received the most applications in the period to March 2003.
Top ten subject applications
at 24 March
0 10,000 20,000 30,000 40,000 50,000 60,000 70,000 80,000 90,000 100,000 La w
P s yc ho lo gy
C o m pute r S cie nce
Ma nage me nt
B us ine s s
Me dic ine
De s ign
Englis h
Tra ining Te a che rs
His to ry
2002 2003
Law, with nearly 90,000 applications is the most popular choice. Medicine received the largest percentage increase in applications (up 23.2%), with psychology next (up 12.3%). Four of the ten most popular subject areas received fewer applications than in the previous year. The decline was largest for computer science, which has received almost 12% fewer applications this year.
[image:9.595.93.386.197.465.2]A. Severe Acute Respiratory Syndrome (SARS)
Update on request Contact: Adam Mellows-Facer, x6969
• A cumulative total of 5,865 probable SARS cases had been reported to the WHO by 1 May 2003. 391 of those cases have resulted in deaths, while 2,563 have recovered.
• Probable cases have been reported in 28 different countries. Local chains of transmission exist in 7 countries, including the UK.
• The totals given are dependent on local reporting techniques and accuracy. The large jump in cases and deaths on 26 March is attributed to an updated report of cases in Guangdong Province, China, and the inclusion of cases of atypical pneumonia in China now recognised as SARS.
• The 3,638 cases to 1 May in China (excluding Hong Kong) mean it now accounts for more probable cases than the rest of the world combined.
Cumulative reported probable SARS cases
From 1 Nov 2002 to 1 May 2003
Cases Deaths
Local chain of transmission?
China 3,638 170 Yes
Hong Kong 1,600 162 Yes
Singapore 201 25 Yes
Canada 147 20 Yes
Taiwan 89 3 Yes
Vietnam 63 5 None
USA 54 0 Yes
UK 6 0 Yes
Others 67 6 None
Total 5,865 391
Note: The status of a reported case may change over time Source: World Health Organisation, www.who.int
Cumulative reported probable SARS cases: to 1 May 2003
0 1,000 2,000 3,000 4,000 5,000 6,000 7,000
17/03 20/03 23/03 26/03 29/03 01/04 04/04 07/04 10/04 13/04 16/04 19/04 22/04 25/04 28/04 01/05
Cumulative reported SARS deaths: to 1 May 2003
0 50 100 150 200 250 300 350 400 450
B. London congestion charge
Update on request Contact: Adam Mellows-Facer, x6969
• The Central London congestion charge was introduced on 17 February 2003. Some limited statistics are available.
• Around 500,000 payments are now made per week. Weekly totals have risen slightly, although it should be noted that the first week of the charge was during school half-term holidays, when one would expect traffic levels to be lower.
• It was estimated that under 15,000 penalty charge notices (PCNs) would be issued in the sixth week, less than half the total in the first week of the charge. Transport for London estimate that they now issue 20,000 PCNs per week, and attribute the rise to system improvements.
• Transport for London estimate that traffic levels within the zone during charging hours have stabilised at around 80 percent of pre-charge levels.
• Significant increases in bus use and speeds have been reported. Five million passengers use London buses each weekday. • In mid-March, approximately 130,000 vehicles were registered
for discounts or exemptions, incorporating over 100,000 “Blue Badge” holders and 22,000 residents.
London congestion charge: the first six weeks
000s, estimates
Week commencing Payments
Penalty charge notices issued
17 Feb 2003 462 34
24 Feb 2003 487 30
3 Mar 2003 488 25
10 Mar 2003 494 20
17 Mar 2003 490 15
24 Mar 2003 496 15
Source: Transport for London
Congestion charge payments: the first six weeks 000s
80 85 90 95 100 105
M T W T F M T W T F M T W T F M T W T F M T W T F M T W T F
Week 1 Week 2 Week 3 Week 4 Week 5 Week 6
Congestion charge payment method: the first four weeks
Retail 36%
Call centre 28% Internet
16% Text message
15%
Voice recognition 4%
1.1 Agricultural incomes and subsidies
Next Update: November 2003 Contact: Richard Cracknell, x4632
• Total income from farming (TIFF) in 2002 continued to recover from its all-time low in 2000.
• In spite of the rise, the 2002 figure means that apart from 2000 and 2001, TIFF remains lower than any other year on the current series, which goes back to 1973. Strictly consistent data are not available, but TIFF in 2000 was probably as low or lower than at any time since the depression in the late 1930s.
• The largest increases in TIFF in recent years were in the early 1990s. TIFF increased by over a third in 1993 alone. IN 1995, TIFF in the UK was £6.2 billion at today’s prices.
• Total spending under the CAP and on national grants and subsidies is forecast at £3.1 billion in 2002/03. Around one-third is under the Arable Area Payments Scheme. Around 85 percent of total spending is EU-funded.
Public expenditure under CAP and national schemes
2002/03 forecast - £ million and % of total
Other (inc capital grants) 12 0%
Arable area payments scheme
1,037 34%
Subsidies on production (inc agri-environment)
485 16%
CAP Market support 700 22%
Livestock subsidies 885 28%
Real farm incomes in the UK: 1990 - 2002
At 2002 prices
Total income from farming (TIFF)
TIFF per whole-time person equivalent
£ billion £ per head
1990 2.8 10.9
1997 3.3 14.0
1998 2.4 10.0
1999 2.4 10.3
2000 1.8 8.0
2001 2.1 9.4
2002 2.3 10.7
Source: DEFRA Statistics News Release 28 Nov 2002
Total income from farming 1973 to 2002
% change on previous year
-50% -40% -30% -20% -10% 0% 10% 20% 30% 40% 50%
1.2 Agricultural labour and output
Next update: November 2003 Contact: Richard Cracknell, x4632
• The total labour force in UK agriculture has decreased in each year since 1984. In the year to June 2002 there was a fall of 18,000, or 3 percent.
• The volume of agricultural production has been fairly stable since the mid-1980s. However, within this total there have been very different trends. Production of wheat, oilseeds, sugar beet and poultry has increased since 1985, while barley, fruit, vegetables, cattle, pigs, sheep and milk have all declined.
• In 2002 output grew for cereals, industrial crops (oilseeds, hops etc), horticulture and livestock (particularly cattle and sheep in the wake of foot and mouth disease). There were falls for fruit potatoes and other crops.
Labour force in agriculture: UK, 1990-2002
Thousands, at June
Workers
Farmers, partners, directors and spouses
Total labour force
1990 282 374 656
1997 243 368 611
1998 245 363 608
1999 230 356 586
2000 204 353 557
2001 198 352 550
2001 202 367 568
2002 194 357 550
Notes: Results from 1998 are not consistent with previous years
Source: DEFRA, Agriculture in the UK 2002
Results for 2001 including the effect of improvements in data for England are not comparable with previous years
UK agricultural output by sector
% change 2001 to 2002
-30.3%
-2.9% -2.6%
+1.0%
+10.1%
+21.1% +9.5%
-40% -30% -20% -10% +0% +10% +20% +30% +40%
Other crops Potatoes Fruit Forage plants Industrial crops Cereals Total
UK labour force in agriculture: annual changes, 000s
- 30 - 25 - 20 - 15 - 10 - 5 0
2.1 Police numbers
Next update: Autumn 2003 Contact: Gavin Berman, x3851
• In September 2002 police strength stood at over 131,500, the highest ever number of full time equivalent officers. This is an increase of 3.4 percent on September 2001.
• Police forces recruited 10,215 officers over the 12 months to March 2002, 38 percent more than the previous year and the most since 1975.
• The proportion of women in the police service in England and Wales has increased steadily from 7 percent in March 1977 to 18 percent by March 2002.
• On 31 March 2002, there were 3,362 minority ethnic officers in the 43 police forces of England and Wales. This is an increase of 14 percent on the previous year. Ethnic minority strength as a proportion of total police service strength has increased from 1.0 percent in 1989 to 2.6 percent by March 2002.
Six month changes in police officer strength
England and Wales 1997-2002
35
-296 -48 -135
-583 -702
-1,224 416
1,096 1,549
2,372 1,945
-1,500 -1,000 -500 0 500 1,000 1,500 2,000 2,500 3,000
Mar 97 Sep 97 Mar 98 Sep 98 Mar 99 Sep 99 Mar 00 Sep 00 Mar 01 Sep 01 Mar 02 Sep 02
Police officer strength, England and Wales 1979 - 2002
Full time equivalents including secondments at 31st March
100,000 105,000 110,000 115,000 120,000 125,000 130,000 135,000
1979 1981 1983 1985 1987 1989 1991 1993 1995 1997 1999 2001 Sep 02
Total police officer strength, England and Wales 1997-2002
Full time equivalents at 31 March
Total
excluding Total
secondments Number % Number % strength
1997 125,051 18,781 15.0% 2,150 1.7% 127,158
1998 124,756 19,606 15.7% 2,483 2.0% 126,814
1999 123,841 19,885 16.1% 2,520 2.0% 126,096
2000 121,956 20,155 16.5% 2,734 2.2% 124,170
2001 123,476 21,174 17.1% 2,955 2.4% 125,682
2002 127,267 22,784 17.9% 3,362 2.6% 129,603
Sep '02 129,494 n/a n/a n/a n/a 131,548
Source: Home Office Statistical Bulletin, Police Service Strength, England & Wales, Female Ethnic minority
2.2 Police funding
Next update: Autumn 2003 Contact: Gavin Berman, x3851
• External provision for police forces in England and Wales consists of all Home Office police grants, Revenue Support Grant (RSG) and Business Rates (NNDR).
• Gross revenue expenditure, in real terms, increased every year between 1996/97 and 2001/02. However, it has fallen in 2002/03.
• In 2001/02 80 percent of police forces’ gross revenue expenditure was financed through government. In 2002/03 this proportion had fallen to less than 75 percent. This was due to a real fall of almost a quarter in Home Office police grants.
• The amount of police expenditure financed through council tax has increased by 44 percent in the twelve months to 2002/03.
• Council tax now accounts for 12 percent of police force expenditure finance, compared to 12 percent in 2001/02.
Business rates
Revenue support grant
Home Office grants
Council Tax
Net req'ment
Generated income
Gross revenue expend.
1996/97 1,205 1,650 3,796 932 7,583 272 7,854
1997/98 1,125 1,652 3,777 1,028 7,582 331 7,913
1998/99 1,086 1,626 3,925 1,103 7,740 259 7,998
1999/00 1,158 1,583 3,890 1,176 7,806 371 8,177
2000/01 1,190 1,238 4,411 1,127 7,965 552 8,518
2001/02 1,022 1,064 5,094 1,095 8,275 696 8,971
2002/03 1,268 1,439 3,888 1,581 8,175 709 8,885
Note: Adjusted using April 2003 GDP deflator Source: CIPFA, Police statistics
Police funding and expenditure, England and Wales 1996/97 to 2002/03
2001/02 prices, £ million
Proportion of expenditure financed through external provision
84.7%
82.8% 83.0%
81.1%
80.3%
74.2% 80.0%
68% 70% 72% 74% 76% 78% 80% 82% 84% 86%
1996/97 1997/98 1998/99 1999/00 2000/01 2001/02 2002/03
Proportion of expenditure financed through council tax
11.9%
13.0% 13.8%
14.4%
13.2%
12.2%
17.8%
0% 2% 4% 6% 8% 10% 12% 14% 16% 18% 20%
2.3 Crime
Next update: July 2003 Contact: Gavin Berman, x3851
• There are two main measures of crime: the number of police recorded crimes and crimes measured under the British Crime Survey (BCS). • The BCS measures crimes against adults (16 and over) living in private
households in England and Wales.
• The latest quarterly recorded crime figures suggest that, after accounting for the effects of the recently implemented National Crime Recording Standard, total recorded crime in Q4 2002 was 7 percent lower than the corresponding quarter in 2001.
• The BCS estimate for crimes against adults living in private households is just over 13 million, a decrease of 2 percent on the 2000 estimate.
• 5.5 million offences were recorded by the police in the 12 months to March 2002, a rise of 7 percent over the previous 12 months. It is estimated that at least five of these percentage points are due to changes in police recording practices.
Trends in recorded crime by offence
Index 1997/98 = 100
Violent crime
Burglary
Drug offences Total all offences
60 70 80 90 100 110 120 130
1997/98 1998/99 1999/00 2000/01 2001/02
% change in BCS crime 1981 - 2001/02
7.6%
11.9% 13.6%
22.7%
4.7%
-13.5%
-10.1%
-11.7%
-2.3%
-20% -15% -10% -5% 0% 5% 10% 15% 20% 25%
1981-83 1983-87 1987-91 1991-93 1993-95 1995-97 1997-99 1999-00 00-01/02
Annual % change in police recorded crime: 1982 - 2001/02
10%
0% 8%
3% 7%
1%
-5% 4%
17% 16%
6%
-1%
-5% -3% -1%
-9% -1%
4%
-2% 7%
-15% -10% -5% 0% 5% 10% 15% 20%
2.4 Crime: international comparisons
Next update: Summer 2003 Contact: Gavin Berman, x3851
• Due to difference in recording practices absolute comparisons between recorded crime levels in different countries may be misleading. However, the definition of homicide is similar in most countries. • The police in England and Wales recorded 1.6 homicides per 100,000
population in 2000. In Scotland 2.1 homicides per 100,000 population were recorded. In Northern Ireland the figure reached 2.8.
• In Russia the homicide rate was 21 per 100,000, while in South Africa it reached 50 per 100,000.
• Over the period 1996-2000, the average rise in violent crime was 14 percent for the EU. The highest rises were in Spain (38 percent), France (36 percent) and the Netherlands (35 percent). The only fall was in Ireland (49 percent) Outside the EU there was a 72 percent rise in Japan. The rise of 15 percent in England and Wales was similar to that of the USA (16 percent).
• Contact crimes are robbery, assaults with force and sexual assaults.
Violent crime per 100,000 population, 2000
1,313
982 981 840
662
584 571 505
399
298 295
228 198
129 87 83 51
-200 400 600 800 1,000 1,200 1,400
UK Lux Can Swe Fin Bel Net USA Fra Spa Den Ger Por Ita Ire Gre Jap
Homicides per 100,000 population, 2000
5.5
3.0 2.9
2.0
1.8 1.7 1.7 1.5
1.5 1.4 1.4 1.4 1.3
1.2 1.1 1.1 1.0
0.2
0 1 2 3 4 5 6
USA Spa Fin Swe Can Fra UK Bel Ire Gre Ita Net Por Ger Jap Den Aut Lux Victimisation rate
% victim of contact crime once or more in 1999
4.1
3.6
3.4 3.4 3.2
2.8
2.4 2.3
2.2 2.2 2.1
2.0 1.9 1.8
1.5 1.4
0.4
0 1 1 2 2 3 3 4 4 5
2.5 Drug misuse
Next update: October 2003 Contact: Ross Young, x4313
• In the six months to March 2001 over 40,000 drugs users started agency episodes in Great Britain, a marginal decrease of 0.6 percent on the previous six month period. There were increases in England and Wales but a 10 percent decrease in Scotland.
• The number of drugs users starting agency episodes in the six months to March 2001 is almost double the figure recorded in the six-month period to September 1993.
• Over this period the number of drugs users starting agency episodes doubled in both England and Scotland, while in Wales the increase was 62 percent.
• The number of users starting agency episodes in Great Britain reached a peak of 40,616 in the six months to September 2000.
• Between 1990 and 2000 the number of seizures of controlled substances doubled from 60,859 to 124,345. Cannabis was the controlled substance seized most frequently, accounting for 73 percent of all seizures in 2000, compared to heroin (13 percent) and ecstasy (8 percent).
Users starting agency episodes in Great Britain
6 months to
end of England Wales Scotland Great Britain
Mar 1997 25,925 1,157 4,618 31,684
Mar 1998 23,916 1,068 4,781 29,765
Mar 1999 28,499 1,412 4,891 34,802
Mar 2000 31,815 1,913 5,327 39,055
Mar 2001 33,234 1,954 4,993 40,181
Source: Department of Health Statistical Bulletin 2002/7 Statistics from the Regional Drug Misuse Database
% change in users starting agency episodes, Great Britain
7% 10%
7% 10%
3% 5% 5%
-14% 9% 17% 0% 8% 4% 3% -1% -20% -15% -10% -5% 0% 5% 10% 15% 20% Mar 1994 Sep 1994 Mar 1995 Sep 1995 Mar 1996 Sep 1996 Mar 1997 Sep 1997 Mar 1998 Sep 1998 Mar 1999 Sep 1999 Mar 2000 Sep 2000 Mar 2001
Seizures of drugs, 1997-2000, UK
24,791 28,801 30,917 34,097 120,031 127,693 108,332 96,081 0 20,000 40,000 60,000 80,000 100,000 120,000 140,000
1997 1998 1999 2000
2.6 Prison population
Next update: May 2003 Contact: Gavin Berman, x3851
• The prison population has increased steadily since the beginning of 2001 and reached record levels at the end of October before falling slightly in November.
• The average prison population in November 2002 was almost 6 percent higher than it had been 12 months earlier. • The prison population in post-war England and Wales has
been rising steadily. Over the past decade, however, this increase has become more marked. Between 1991 and 2001 the average prison population increased by almost 45 percent.
• In England and Wales there were 121 prisoners per 100,000 population in 2000, the highest rate in Western Europe, along with Portugal. The US has the highest rate in the world (almost 700) while Cyprus (43) and Japan (47) have the lowest.
Prison population, England and Wales, 1901-2001
0 10,000 20,000 30,000 40,000 50,000 60,000 70,000
1901 1906 1911 1916 1921 1926 1931 1936 1941 1946 1951 1956 1961 1966 1971 1976 1981 1986 1991 1996 2001
Prison population 1980-2002, by sex of prisoner
England and Wales
Total
1980 40,748 96.4% 1,516 3.6% 42,264
1990 43,378 96.4% 1,597 3.6% 44,975
1997 58,439 95.6% 2,675 4.4% 61,114
1998 62,194 95.2% 3,105 4.8% 65,299
1999 61,523 95.0% 3,247 5.0% 64,770
2000 61,252 94.8% 3,350 5.2% 64,602
2001 62,560 94.4% 3,741 5.6% 66,301
2002 66,655 93.9% 4,319 6.1% 70,974
Note: 2002 is average of first 11 months Sources: Prison statistics, England & Wales 2000
Prison population brief, England & Wales Females Males
Prison population - Rate per 100,000 population, 2000
685
385
124 121 114
97 94 92 87 84 83 80 76 76 61 56 47
0 100 200 300 400 500 600 700 800
3.1 Defence employment
Next Update: May 2003 Contact: Gavin Berman, x3851
• There have been large-scale reductions in the size of UK regular and reserve force since 1990. These follow from the restructuring set out in Britain’s Defence for the 90s and the Defence Costs Study.
• The Strategic Defence Review (SDR), presented to Parliament in July 1998, proposed that the establishment of the regular Army should increase to 111,300. • The SDR set targets of full manning of the RAF by 2000, of the Navy by 2002
and of the Army by 2004. At 1st January 2003 the trained strength of the RAF was nearly 500 below requirement. The strength of the Navy was 700 below requirement and the Army was 4,000 below requirement
• Between 1 April 1997 and 1 March 2003, the number of UK regular forces has fallen by 2 percent. Naval service employment fell by 8 percent, and RAF by 7 percent, but Army employment has risen by more than 3 percent.
• Since 1980 both naval service and RAF employment has fallen by about 40 percent and Army employment by 30 percent.
Excludes locally entered personnel and Gurkhas
Navy Army RAF Officers Other Ranks
1997 45,100 108,800 56,900 32,700 178,200 1998 44,470 109,830 55,840 32,620 177,510 1999 43,700 109,720 55,210 32,240 176,400 2000 42,850 110,050 54,720 32,520 175,100 2001 42,420 109,530 53,700 32,630 173,020 2002 41,630 110,050 53,000 32,750 171,940 1 Mar 03 41,510 112,260 53,160 33,220 173,710
Sources: DASA, Defence Statistics 2002, Table 2.8
MoD Statistical Bulletin TSP1, March 2003
Total Regular Forces
UK regular armed forces manpower at 1st April
Annual % change in UK armed forces manpower
-5.0%
-0.3%
-0.7% -0.5%
-0.9%
-0.5%
1.1%
-6% -5% -4% -3% -2% -1% 0% 1% 2%
1997 1998 1999 2000 2001 2002 1 Mar 2003
% change in armed forces personnel 1990-2001
+5% +3%
-19% -20% -24%
-29%
-32% -32% -33% -39%
-44%
-49% -50%
-61%
-17% -23%
-70% -60% -50% -40% -30% -20% -10% +10%
3.2 Defence expenditure
Next update: Summer 2003 Contact: Gavin Berman, x3851
• Defence expenditure, as a share of GDP, is planned to equal 2.3 percent in the current financial year and then fall to around 2.5 percent by 2005/06. This has been on a downward trend since 1984/85 when the figure was 5.3 percent.
• Planned real terms defence expenditure is almost 30 percent below the figure in 1984/85.
• Defence expenditure other than that on personnel and equipment has increased as a share of the total since 1997. • The chart showing international comparisons is based on the
NATO definition of military expenditure.
• Expenditure as a proportion of GDP has fallen since the 1980s in all NATO member countries except Turkey.
• Between 1985 and 1989 average defence expenditure in NATO member countries was 4.8 percent of GDP. In 2001 this had fallen to 2.7 percent
Defence expenditure 2002 (% of GDP)
5.0
4.4
3.3
2.5 2.4 2.3
1.9
1.6 1.5
1.2 1.1
2.0 2.7
0 1 2 3 4 5 6
Tur Gre US Fra UK Por Ita Net Ger Spa Can NATO EU
NATO Total
Real annual % change in UK defence budget
-8% -6% -4% -2% 0% 2% 4% 6% 8%
1980/81 1983/84 1986/87 1989/90 1992/93 1995/96 1998/99 2001/02 2004/05
Principal headings of the defence budget: 1990/91 - 2000/01
Percentage of total expenditure
Expenditure on personnel
Expenditure on equipment
Other expenditure
1990/91 39.5% 39.6% 20.9%
1991/92 40.5% 39.7% 19.8%
1992/93 44.2% 36.7% 19.1%
1993/94 42.0% 39.3% 18.7%
1994/95 41.3% 39.2% 19.5%
1995/96 39.6% 39.7% 20.7%
1996/97 39.2% 41.3% 19.5%
1997/98 39.6% 43.0% 17.4%
1998/99 38.1% 44.0% 18.0%
1999/00 37.8% 43.0% 19.2%
2000/01 37.2% 42.4% 20.3%
3.3 Defence exports
Next Update: October 2003 Contact: Gavin Berman, x3851
Constant 2001 US$m / percentage of total in italics
US 18,467 39.3 18,439 45.5 19,421 47.9 13,537 41.6 9,702 45.5
UK 7,600 16.2 4,149 10.2 5,333 13.2 5,823 17.9 4,000 18.8
Russia 2,794 5.9 2,293 5.7 3,200 7.9 3,743 11.5 3,600 16.9
France 7,489 15.9 7,753 19.1 3,840 9.5 2,080 6.4 1,000 4.7
Germany 1,341 2.9 1,638 4.0 2,240 5.5 1,248 3.8 100 0.5
Others 9,276 19.8 6,223 15.4 6,506 16.0 6,136 18.8 1,900 8.9
Total 46,967 40,495 40,540 32,567 21,302
Source: International Institute for Strategic Studies, The Military Balance 2002/2003, table 30
Value of arms deliveries and market share
2001
1998 1999 2000
1997 • The global value of arms deliveries fell substantially from
US$ 32.5bn in 2000 to US$ 23.1bn in 2001. There has been a declining trend in evidence since the peak of almost US$ 47bn in 1997.
• In 1987 the USSR accounted for over one third of the value of arms deliveries. By contrast, Russia accounted for just 5.7 percent in 1998. This share, albeit of a shrinking market, subsequently tripled to 16.9 percent in 2001.
• The US share of the world market was 45.5 percent in 2001, compared with 27.0 percent in 1987. The UK was the second largest exporter with 18.8 percent of the market.
Annual % change in global value of arms deliveries
13.2%
-13.8%
0.1%
-19.7%
-34.6% -40%
-30% -20% -10% 0% 10% 20%
1997 1998 1999 2000 2001
Arms deliveries market share, %
Russia (USSR) USA
UK
0 10 20 30 40 50 60
4.1 Class sizes
Next update: May 2003 Contact: David Knott x2454
• The average primary class increased steadily in numbers between 1985 and 1997. During this period the average size increased from 23.7 to 27.7 pupils per class, since then the figure has fallen by 1.4 pupils per class.
• Since 1979 there has been an increase in the average primary class size of just under 2 percent, from 25.9 pupils per class in 1979 to 26.3 in 2002.
• The average secondary class size and the percentage of secondary pupils in large classes (over 30 pupils) fell during the 1980s. This trend was reversed in the 1990s.
• Between 1979 and 2002 the average class size increased from 21.0 to 21.9.
• The overall (primary and secondary combined) average class size was 23.4 in 1979, 24.8 in 1997 and 24.2 in 2002.
Class sizes in primary schools in England
0% 5% 10% 15% 20% 25% 30% 35% 40%
1979 1981 1983 1985 1987 1989 1991 1993 1995 1997 1999 2001
% of pupils in large classes
20.0 21.0 22.0 23.0 24.0 25.0 26.0 27.0 28.0 29.0
Average class size % of pupils in large classes
Average class size
Class sizes in secondary schools in England
0% 2% 4% 6% 8% 10% 12% 14% 16% 18%
1979 1981 1983 1985 1987 1989 1991 1993 1995 1997 1999 2001
% of pupils in large classes
18.5 19.0 19.5 20.0 20.5 21.0 21.5 22.0 22.5
Average class size % of pupils in large classes
Average class size Single teacher class sizes in maintained schools
England, January each year
Primary Secondary
Average class size
% of pupils in classes of over 30
Average class size
% of pupils in classes
of over 30
1979 25.9 35.3% 21.0 15.9%
1997 27.5 33.4% 21.7 8.7%
1998 27.7 34.8% 21.7 9.9%
1999 27.5 31.5% 21.9 10.8%
2000 27.1 26.5% 22.0 11.3%
2001 26.7 21.1% 22.0 11.7%
2002 (prov) 26.3 17.8% 21.9 11.8%
Sources: DfES SFR 06/02 Class sizes in maintained schools in England
4.2 Schools
Next update: September 2003 Contact: David Knott x2454
• The number of primary schools has been declining steadily since the mid-1970s; the overall fall since 1975/76 has been nearly 4,200.
• The number of secondary schools has been falling for a longer period of time. Their number fell by 1,700 or around 28 percent between 1970/71 and 2001/02.
• The average size of primary schools in the UK increased slightly between 1997 and 2001, from 223 pupils to 225. • There was a much larger increase at secondary level, from
840 to 909 pupils, with the total number of pupils increasing to 3.9m in the same period.
• In the 2001/02 there were also 3,216 nursery, 1,483 special and 2,409 non-maintained (largely independent) schools in the UK.
Public sector primary and secondary schools
UK, 1970/71 - 2001/02
Primary Secondary Total
1970/71 26,799 6,010 32,809
1980/81 26,504 5,542 32,046
1990/91 24,135 4,790 28,925
1997/98 23,230 4,434 27,664
1998/99 23,125 4,418 27,543
1999/00 23,036 4,405 27,441
2000/01 22,902 4,337 27,239
2001/02 22,800 4,306 27,106
Source: National statistics, Annual abstract of statistics, various
Primary schools: number and average size
UK, 1991-2001
22,200 22,400 22,600 22,800 23,000 23,200 23,400 23,600 23,800 24,000 24,200
1991 1992 1993 1994 1995 1996 1997 1998 1999 2000 2001 Schools
200 205 210 215 220 225 Average pupil numbers
Secondary schools: number and average size
UK, 1991-2001
4,000 4,100 4,200 4,300 4,400 4,500 4,600 4,700 4,800
1991 1992 1993 1994 1995 1996 1997 1998 1999 2000 2001 Schools
4.3 Teachers
Next update: September 2003 Contact: David Knott x2454
• The number of primary school teachers in the UK fell by 36,000 between 1979 and 1985. The number has subsequently increased and in 2002 reached its highest level since 1980.
• The number of secondary teachers fell from a peak of over 280,000 in 1979 to below 230,000 in the mid-1990s. Provisional figures for 2002 show an increase of 4,000 over the year
• Underlying demographic changes are the main determinant of pupil numbers and hence the demand for teachers. The number of pupils per teacher shows teacher numbers in the context of this demand.
• In primary schools the number of pupils per teacher fell during the 1980s and increased by a similar amount between 1990 and 1998. It has declined 1.1 points in the last four years.
• The trend was similar in secondary schools, but the increase since 1990 has been greater. Small decreases in 2001 and 2002 were the first for a decade.
Change in pupil : teacher ratios in UK primary schools
-0.6 -0.5 -0.4 -0.3 -0.2 -0.1 0.0 0.1 0.2 0.3 0.4
1979 1981 1983 1985 1987 1989 1991 1993 1995 1997 1999 2001
M
or
e teacher
s M
or
e pupils
Full-time equivalent teachers in UK primary and secondary schools
Teachers Pupils per teacher
Primary Secondary Primary Secondary
1979 241.2 281.8 22.9 16.5
1990 219.0 236.6 21.7 14.8
1997 227.0 228.9 22.8 16.2
1998 225.4 228.7 23.1 16.4
1999 226.7 230.4 22.9 16.4
2000 228.0 232.9 22.7 16.6
2001 229.6 237.0 22.3 16.5
2002 (prov) 231.4 241.0 22.0 16.4
Note:
Sources: NS database series KBFB, KBFC, KBFG, KBFH
Figures are for January each year, apart from Wales up to 1998 and Scotland where the data are for September
Excludes pupils and teachers in sixth form colleges in England and Wales from 1994 onwards.
Change in pupil : teacher ratios in UK secondary schools
-0.4 -0.3 -0.2 -0.1 0.0 0.1 0.2 0.3 0.4
1979 1981 1983 1985 1987 1989 1991 1993 1995 1997 1999 2001
M
or
e teacher
s M
or
4.4 Examination results
Next update: September 2003 Contact: David Knott x2454
• The percentage of pupils achieving level 4 or above at Key Stage 2 (KS2) rose from 63 percent to 75 percent in English; from 62 percent to 73 percent in mathematics; and from 69 percent to 86 percent in science in the period 1997-2002.
• Government targets in English and mathematics were 80 percent and 75 percent pass rates respectively at level 4 in 2002.
• The percentage of pupils achieving 5 or more GCSEs grades A*-C reached its highest level in 2002, surpassing the Government’s target of 50 percent.
• The percentage of pupils passing at least one exam was also at its highest level.
• The percentage of school leavers with the equivalent of 5 GCSEs grade A*-C was 22.6 percent in 1974/75 and, apart from 2 years in the mid-1980s, has increased in each subsequent year.
• Increased staying-on rates mean that the proportion of 17 year olds with A levels, or their equivalent, has increased dramatically. The percentage with 3 or more A levels almost doubled between 1991/92 and 2001/02. • Data from 2000/01 include the impact of adjustments to the A-level
system under the Qualifying for Success scheme. The series appears to have settled in latest year, which now excludes data on GNVQ subsidiaries.
GCSE performance
England 1991/92 to 2001/02
5 or more grades A* to C
5 or more
grades A* to G no passes
1991/92 38.3 82.2 8.4
1997/98 46.3 87.5 6.6
1998/99 47.9 88.5 6.0
1999/00 49.2 88.9 5.6
2000/01 50.0 88.9 5.5
2001/02 51.5 88.9 5.4
Includes GNVQ equivalencies from 1996/97
Sources: DfES, GCSE/GNVQ examination results England 2001/02
DfES, Autumn Packages 2002
% of 15 year old pupils achieving
A-level and equivalent achievements in schools and colleges
England 1991/92 to 2001/02
1+ 3+ 1+ 3+
1991/92 92.7 57.4 29.5 17.4
1997/98 96.9 69.0 37.9 24.2
1998/99 96.6 69.4 38.0 24.7
1999/00 96.6 70.0 37.9 25.1
2000/01 93.9 86.2 66.3 26.2
2001/02 97.0 74.2 45.8 31.4
Data are for schools only Source:
% of examinees with A-level or equivalent passes
% of 17 year olds with A-level passes
DfES, GCE/VCE A/AS Examination Results for Young People in England 2001/2002 (provisional)
Percentage of pupils achieving Key Stage 2, level 4+
England 1997-2002
English Mathematics Science
1997 63 62 69
1998 65 59 69
1999 71 69 78
2000 75 72 85
2001 75 71 87
2002 75 73 86
4.5 Participation: 16-18 year olds
Next update: September 2003 Contact: David Knott x2454
Percentage of 16 to 18 year olds in education or training, by age
England, 1985-2001
16 year olds
17 year olds
18 year olds
30 40 50 60 70 80 90 100
1985 1986 1987 1988 1989 1990 1991 1992 1993 1994 1994 1995 1996 1997 1998 1999 2000 2001
16 17 18 16-18 16 17 18 16-18
1997 69.4 57.4 37.7 54.9 85.8 78.5 60.2 74.9
1998 69.8 57.8 37.2 54.8 85.7 79.3 59.9 74.8
1999 71.3 58.7 37.3 55.7 86.3 79.6 60.3 75.4
2000 71.3 58.9 37.1 55.8 86.6 79.3 60.0 75.3
2001 71.2 58.4 36.6 55.5 86.5 79.3 60.4 75.5
Ages at 31 August
Source: DfES, Participation in education, training and employment by 16-18 year olds in England 2000 and 2001
All education and training Full time education
16, 17 and 18 year olds in education and training
England, percentages • The percentage of the 16-18 age group continuing in full-time education
increased rapidly, for all ages, between 1985 and the early 1990s.
• Changes in the collection of data on further education means there is a discontinuity in the series from 1994. Figures for 1994 are given in the chart using both collection methods.
• The increases were especially large for 17 and 18 year olds. The percentage of 17 year olds still in full-time education increased from 32 percent to 58 percent, the proportion of 18 year olds more than doubled.
• In the last few years the overall rate has increased again to near its highest ever level.
• At the end of 2001 an estimated 9.3 percent of 16-18 year olds were not in education, training or work.
• The proportion of students enrolled in public secondary education is highest in Ireland. The government-dependent private sector is largest in the Netherlands. • Portugal has the largest proportion of upper secondary students in the
private sector.
Distribution of students in further education
EU, 2000
0% 10% 20% 30% 40% 50% 60% 70% 80% 90% 100%
4.6 Applicants and entrants to higher education
Next update: February 2004 Contact: David Knott x2454
• The number of applicants via the Universities and Colleges Admissions Service (UCAS) rose very steeply in 1997 – the year before tuition fees were introduced for most students.
• The total number of home applications has risen in each of the last three years, with a 0.6 percent increase recorded in 2002.
• The modest increase 2002 meant that the number of home applicants breached 400,000 for the first time.
[image:28.595.59.379.352.503.2]• The total number of accepted applicants rose in each of the last four years. • 83 percent of home applicants were accepted in 2002. The comparative
figure was only 69 percent in 1994.
• Overseas applications comprised almost 13 percent of the total number of applications in 2002.
• Overseas acceptances accounted for only 10 percent of the total number of acceptances in the latest year.
• UCAS processes applications for full-time and sandwich undergraduate courses only. This means that these statistics exclude a significant number of applicants, particularly mature students.
Applicants through UCAS, 1994-2001
number change number change
1994 365,323 .. 251,292 .. 69
1995 369,701 +1.2% 265,536 +5.7% 72
1996 364,885 -1.3% 268,289 +1.0% 74
1997 398,327 +9.2% 303,318 +13.1% 76
1998 389,588 -2.2% 298,220 -1.7% 77
1999 388,691 -0.2% 303,065 +1.6% 78
2000 389,091 +0.1% 308,718 +1.9% 79
2001 399,645 +2.7% 325,472 +5.4% 81
2002 401,854 +0.6% 331,725 +1.9% 83
Source: UCAS annual datasets
Accepted Home applicants
% accepted
Applications and acceptances to higher education institutions
UK, 2002
Age UK Overseas Total UK Overseas Total
<21 312,457 35,513 347,970 264,714 21,680 286,394 21-24 42,894 16,592 59,486 32,867 10,300 43,167 >25 46,503 7,406 53,909 34,144 4,410 38,554 All 401,854 59,551 461,405 331,725 36,390 368,115
Source: UCAS annual datasets
Applications Acceptances
Home applications and acceptances
1994-2002
Home applicants
Accepted
200,000 250,000 300,000 350,000 400,000 450,000
4.7 Participation in higher education
Next update: November 2003 Contact: David Knott x2454
• Both the number of students in higher education and the participation rate have increased significantly since 1979/80. • The age participation rate of young people has increased
from about one-in-eight in 1979/80 to one-in-three at present. • The total number of students increased by approximately
170,000 in 2001/02. There are now almost 2.25 million students in higher education in the UK.
• The five HE institutions with the highest (above 40 percent) entry rates from social classes IIIM, IV and V that were statistically significantly above their area benchmark are all ‘new’ universities, colleges or institutes.
• The five HE universities with the lowest (below 15 percent) entry rates from social classes IIIM, IV and V that were statistically significantly below their area benchmark comprise: Cambridge; Oxford; Bristol; Nottingham and Durham.
% Age participation rate
Great Britain, 1989/90 - 2001/02
10% 15% 20% 25% 30% 35% 40%
1989/90 1991/92 1993/94 1995/96 1997/98 1999/00 2001/02
Participation in higher education, 1979/80 to 2002/03
All students in
higher education(a) Age participation UK: 000s rate(b): GB
1979/80 795 12%
1997/98 1,938 33%
1998/99 2,081 31%
1999/00 2,024 32%
2000/01 2,067 33%
2001/02(c) 2,241 34%
2002/03(c) .. 34-36%
(a) Includes overseas and OU.
(b) home entrants to HE aged under 21 as a % of av no of 18-19 yrs (c) Projected participation rate
Source: Education Statistics for the UK 2002
Social classes IIIM, IV and V: Top/bottom 5 HE institutions by % entry
0 5 10 15 20 25 30 35 40 45 50
Wolverhampton
Bolton Institute
East London
Edge Hill College
Greenwich
Durham
Nottingham
Bristol
Oxford
Cambridge
4.8 Education expenditure
Next update: January 2004 Contact: David Knott x2454
• The expenditure plans since the 2000 Spending Review have been presented on a resource basis. The figures shown here are on a resource basis from 2000/01 onwards.
• Spending has increased in real terms in most years since 1979-80. The only periods where it fell for two or more consecutive years were in the mid-1980s and mid-1990s. • When expressed as a proportion of GDP, education spending
fell for much of the 1980s and during the mid to late 1990s. The only sustained increases were in the early 1990s and from 1999/00 onwards.
• By 2005-06 education expenditure is planned to reach 5.6 percent of GDP, the highest level in the last 25 years.
Education expenditure as a % of GDP: EU 1999
0 1 2 3 4 5 6 7 8
Gre Ire Net Ita UK Spa Ger Bel Fin Por Fra Aut Den Swe
Public Private
Real % change in UK public education expenditure
Series break -4
-2 0 2 4 6 8 10 12 14
80/81 82/83 84/85 86/87 88/89 90/91 92/93 94/95 96/97 98/99 00/01 02/03 04/05
Total public expenditure on education in the UK
£ billion at Annual % 2001-02 increase in £ billion prices real terms
1997/98 outturn 37.4 41.1 -0.3%
1998/99 outturn 39.0 41.8 +1.5%
1999/00 outturn 40.9 42.8 +2.4%
2000/01 outturn 44.1 45.1 ..
2001/02 estimate 50.7 50.7 +12.3%
2002/03 plans 53.7 52.4 +3.4%
2003/04 plans 58.5 55.7 +6.3%
2004/05 plans 62.9 57.0 +2.3%
2005/06 plans 68.4 60.5 +6.1%
UK figures are subject to the decisions of devolved administrations. Sources: HM Treasury, PESA 2002-03, Cm 5401 and earlier editions
HM Treasury, Budget 2002; CSR 2002
5.1 General election results
Contact: Adam Mellows-Facer, x6969
• Since 1945 both the Conservatives and Labour have been the largest party, in terms of seats won, on eight occasions.
• The Conservatives’ best result since 1945 in terms of seats was 1983 when they won 397. Their highest share of the vote was in 1955 when they polled 49.6 percent. • Labour’s 418 seats won in 1997 is their highest ever while their highest share since
1945 was 48.8 percent in 1951, an election that they lost.
• In the 2001 General Election the Liberal Democrats increased their number of seats by six to 52, the highest post war total by the party or its predecessors.
Share of the vote: UK: 1945-2001
0% 10% 20% 30% 40% 50% 60%
1945 1950 1951 1955 1959 1964 1966 1970 Feb '74 Oct '74 1979 1983 1987 1992 1997 2001 Labour
Conservative
LibDem
Other
PC/SNP
General election results: 1979-2001: UK
Con Lab Lib(a) PC/SNP Other Total
Share of vote (%)
1979 43.9% 36.9% 13.8% 2.0% 3.4% 100%
1983 42.4% 27.6% 25.4% 1.5% 3.1% 100%
1987 42.2% 30.8% 22.6% 1.7% 2.7% 100%
1992 41.9% 34.4% 17.8% 2.3% 3.5% 100%
1997 30.7% 43.2% 16.8% 2.5% 6.8% 100%
2001 31.7% 40.7% 18.3% 2.5% 6.9% 100%
Seats won
1979 339 268 11 4 13 635
1983 397 209 23 4 17 650
1987 375 229 22 6 18 650
1992 336 271 20 7 17 651
1997 165 418 46 10 20 659
2001 166 412 52 9 20 659
Votes (millions)
1979 13.7 11.5 4.3 0.6 1.1 31.2
1983 13.0 8.5 7.8 0.5 1.0 30.7
1987 13.7 10.0 7.3 0.5 0.9 32.5
1992 14.1 11.6 6.0 0.8 1.2 33.6
1997 9.6 13.5 5.2 0.8 2.1 31.3
2001 8.4 10.7 4.8 0.7 1.8 26.4
(a) Liberal/SDP Alliance 1983-87; Liberal Democrats from 1992
Sources: Parliamentary Research Services, British Electoral Facts: 1832-1999
5.2 Other elections
Next update: May 2003 Contact: Adam Mellows-Facer, x6969
• Elections took place to the Scottish Parliament, the Welsh Assembly and to 319 English district councils outside London on 1 May 2003. The elections to the Northern Ireland Assembly have been delayed. The House of Commons library will produce reports on each election.
• European Parliament elections will next take place in June 2004.
• The Conservatives won 36 of the 87 UK seats at the 1999 European Parliament elections to become the largest British party following an 11 percent swing from Labour relative to 1994.
• The nationalist parties in Scotland and Wales secured significantly higher shares of the vote in the 1999 devolved assembly elections than they did in the 2001 general election.
• Labour had around 1,000 more councillors in Great Britain than the Conservatives following the May 2002 local elections, down from almost 7,000 in the mid-1990s.
• 59 English districts will ran local election pilot schemes on 1 May to test new voting and counting methods, covering approximately 6.5 million voters. The schemes include mobile voting and voting by internet, SMS text and digital television.
Councillors in Great Britain: 1979-2002
After May local elections
0 2,000 4,000 6,000 8,000 10,000 12,000 14,000
1979 1981 1983 1985 1987 1989 1991 1993 1995 1997 1999 2001 Councillors
Labour
Conservative
Lib Dem
Other
PC/SNP
European Parliament election results: 1979-1999: United Kingdom
Con Lab Lib PC/SNP Other Total
Share of vote (%)
1979 48.4% 31.6% 12.6% 2.4% 4.9% 100%
1984 38.8% 34.8% 18.5% 2.5% 5.4% 100%
1989 33.5% 38.7% 5.9% 3.3% 18.5% 100%
1994 26.9% 42.6% 16.1% 4.1% 10.2% 100%
1999 33.5% 26.3% 11.9% 4.6% 23.8% 100%
Seats won
1979 60 17 0 1 3 81
1984 45 32 0 1 3 81
1989 32 45 0 1 3 81
1994 18 62 2 2 3 87
1999 36 29 10 4 8 87
Source: Parliamentary Research Services, British electoral facts 1832-1999
Elections in 2003
English local elections: 1 May 2003
One-third: Whole council:
88 non-metropolitan districts 150 non-metropolitan districts 36 metropolitan districts 27 unitary authorities 18 unitary authorities
Scottish Parliament elections: 1 May 2003 73 constituency seats
56 additional members from 8 regional lists Welsh Assembly elections: 1 May 2003
40 constituency seats
20 additional members from 5 regional lists Northern Ireland Assembly elections: delayed
5.3 Turnout
Source: International Institute for Democracy and Electoral Assistance, www.idea.int
Next update: May 2003 Contact: Adam Mellows-Facer, x6969
• Turnout at the 2001 general election was 59.4 percent, the lowest since the introduction of universal suffrage.
• Comparing turnout at the last parliamentary elections, the UK was 13th of the EU15.
• Turnout at the 1999 European Parliament election in the UK was 24 percent, the lowest in the EU.
Turnout at most recent elections
Percentages of registered electorate
Election Year Turnout %
General 2001 59.4
European Parliament 1999 24.0
Scottish Parliament 1999 58.2
Welsh Assembly 1999 46.4
Northern Ireland Assembly 1998 68.7
English local 2002 32.8
London boroughs 2002 33.1
Metropolitan boroughs 2002 31.4
Unitary councils 2002 30.2
Shire district councils 2002 35.5
Scottish unitary councils 1999 59.4
Welsh unitary councils 1999 49.7
Northern Ireland district councils 2001 66.0
Notes:
Sources: Rallings and Thrasher, British electoral facts 1832-1999
Rallings and Thrasher, Local elections handbook series Turnout at the Scottish, Welsh and Northern Ireland local elections was boosted by Scottish Parliament, Welsh Assembly and general elections respectively being held on the same day.
% Turnout at general elections 1945-2001
Percentage of registered electorate
83.9 82.6
76.8 78.7 77.1 75.8 72.0
78.8
72.8 76.0 72.7 75.3 77.7 71.4
59.4 72.8
0 20 40 60 80 100
1945 1950 1951 1955 1959 1964 1966 1970 F1974 O1974 1979 1983 1987 1992 1997 2001
% Turnout at last parliamentary election: EU and G7
Percentage of estimated voting age population
89
85 84 83
78 78 75
74 73 73 70 65
59 58 57 55
50 46
0 20 40 60 80 100
5.4 Voter characteristics
Contact: Adam Mellows-Facer, x6969 Source: MORI election aggregate in Worcester and Mortimore, Explaining
Labour's second landslide, Politico's 2001
• Older people, those in the higher social classes and home owners were disproportionately likely to vote at the 2001 general elections.
• Turnout amongst non-whites was 47 percent, compared to 60 percent amongst white people.
• The voting preferences of men and women were very similar. • Labour secured at least 30 percent of the vote from all the
groups considered in the chart to the right.
• Conservative support was strongly skewed towards older age groups, the higher social classes and home owners.
• The highest Liberal Democrat share of the vote came amongst the 18-24 age group, AB social classes and private renters. • Almost three-quarters of non-whites voted Labour. The
Liberal Democrats were second amongst this group with 13 percent
2001 general election: estimated %pt Labour lead over Conservatives by voter characteristic
9 10 9 14 27 17 9 -2 -1 -9 2 20 31 13 14 5 31 13 15 -7 9 22 -11 11 -7 16 42 12 8 61 29 4
-20 -10 0 10 20 30 40 50 60 70
All Gender Men Women Age group 18-24 25-34 35-44 45-54 55-64 +65 Social class AB C1 C2 DE Work status Full time Part-time Not working Unemployed Male FT Female FT Self-employed Private sector Public sector Housing tenure Owner Mortgage Own/mort ABC1 Own/mort C2DE Council/HA Private rent Ethnicity White Non-white Trade union Member Non-member
2001 general election: estimated % turnout by age group 39 46 59 65 69 70 0 10 20 30 40 50 60 70 80
5.5 Opinion polls
Next update: May 2003 Contact: Adam Mellows-Facer, x6969
• Recent MORI and ICM data shows little evidence of a fall in Labour’s poll lead over the Conservatives.
• Labour’s share of the intended vote has, however, fallen since the 2001 general election. The principal beneficiaries have been the Liberal Democrats.
• The only point in the last six years when the Conservative Party had a lead over Labour was in the September 2000 ICM poll – during the fuel protests.
• Defence, foreign affairs and international terrorism has been the issue most likely to be identified as the most, or as another important issue since January 2003. In March, over half of respondents thought that it was the most important issue. Previously the NHS had headed the list.
Monthly voting intention: ICM All naming a party, actual election results used
0% 10% 20% 30% 40% 50% 60% 70% May 97 Nov 97 May 98 Nov 98 May 99 Nov 99 May 00 Nov 00 May 01 Nov 01 May 02 Nov 02 May 03
Monthly voting intention: MORI All naming a party, actual election results used
0% 10% 20% 30% 40% 50% 60% 70% May 97 Nov 97 May 98 Nov 98 May 99 Nov 99 May 00 Nov 00 May 01 Nov 01 May 02 Nov 02 May 03 Labour Conservative LibDem Other
MORI: Issues facing Britain: March 2003
Issues polling over 5%
Most or other important issue%
Defence/foreign affairs/international terrorism 64
National Health Service/hospitals 42
Education/schools 27
Race relations/immigration/immigrants 26
Crime/law & order/violence/vandalism 18
Economy/economic situation 13
Nuclear weapons/nuclear war/disarmament 9
Pensions/social security 9
Transport/public transport 9
Unemployment/factory closure/lack of industry 8
Taxation 7
983 adults interviewed face-to-face, 20-24 March 2003
6.1 Road fuel prices
Next update: May 2003 Contact: Ross Young, x4313
• A litre of petrol retailed at 79p in March 2003, 18p higher than in January 1997.
• UK fuel prices have risen by 3.8p (petrol) and 4.7p (diesel) over the last three months
• Since May 1997, the average monthly change in UK retail prices for premium unleaded petrol has been 0.3p per month.
• The UK has the second highest pump price for unleaded petrol in the European Union, after the Netherlands, while the UK’s diesel pump price is the highest in Europe.
• As in France and Germany, 73 percent of the UK’s unleaded petrol pump price is accounted for by taxes and duties, the highest in the EU.
• Excluding tax and duties, the pre-tax price for unleaded petrol is 21p (petrol) and 23p (diesel)
Monthly change in UK retail prices
premium unleaded petrol, cash prices
-6 -4 -2 0 2 4 6
1997 1998 1999 2000 2001 2002 2003
pence per litre
UK retail prices for unleaded petrol and diesel
Pence per litre
Petrol Diesel
January 1997 61.0 62.0
January 1998 63.3 63.4
January 1999 63.7 64.6
January 2000 75.3 77.6
January 2001 77.0 81.5
January 2002 70.2 74.5
January 2003 75.8 77.0
March 2003 78.7 81.7
Source: Institute of petroleum, Oil datasheet 12
Petrol pump prices in EU Member States
£0.00 £0.10 £0.20 £0.30 £0.40 £0.50 £0.60 £0.70 £0.80 £0.90
6.2 Energy and CO
2emissions
Source: OECD International Energy Agency, CO2 emissions from fuel combustion, 2002 edition
Next update: October 2003 Contact: Ross Young, x4313
• Final UK energy consumption increased by 1.3 percent in 2001 to its highest ever level. • Transport became the largest energy consuming sector in 1988 and accounted for
34 percent of final consumption in 2001. Consumption by industry has almost halved since 1973.
• Turning to type of fuel, the most dramatic change has been the decline in coal and other solids. In 1960, solid fuels accounted for over 60 percent of total consumption. By 2001, this had fallen to less than 3 percent.
• Total UK carbon dioxide emissions have fallen by 20 percent since 1970. However, emissions from road transport have doubled over that period.
• The United States accounts for 24 percent of world emissions. Next come China, with 13 percent, and Russia, 6 percent. The UK accounts for 2 percent, below its share of GDP. In per capita terms, the Arab states of Qatar, Kuwait and the United Arab Emirates emit the most CO2.
CO2 emissions - tonnes per capita, 2000
60
32
24
21 20
18 17 17 15
13
9
4
0 10 20 30 40 50 60
Qat Kuw UAE USA Bah Lux Aus Can Bru SAr UK World
Electricity generated from renewable sources UK 1997-2001, GWh
7,428
9,231 10,174
10,454 10,099
0 2,000 4,000 6,000 8,000 10,000 12,000
1997 19