Staying The Course: An Econometric Analysis of
the Characteristics Most Associated With
Student Attrition Beyond The First Year Of
Higher Education
Main Report
1
Mark Bailey and Vani K Borooah
Staying The Course: An Econometric Analysis of the
Characteristics Most Associated With Student
Attrition Beyond The First Year Of Higher Education
Main Report
1Mark Bailey and Vani K Borooah
University of Ulster
*January 2007
1 A Technical Annex to this Report is available upon request to The Department for
Table of Contents
0. Executive Summary ...1
1. Introduction and Literature Survey ...4
What is retention and why is it important?...4
Literature Survey - Theory...6
Literature Survey - US evidence...7
Literature Survey - UK evidence...8
2. Data Description ...11
3. Estimating the Probabilities of Continuing after the First Year at University
...13
4. Earlier non-econometric analysis of retention at the University of Ulster ..17
5. Conclusions ...19
References ...22
Appendices ...24
Table 1 - Attrition and Survival Rates By Course of Study After Year 1 of
University ...25
Table 2 - Attrition and Survival Rates By Module of Study After Year 1 of
University: Art and Design...26
Table 3 - Attrition and Survival Rates By Module of Study After Year 1 of
University: Business and Management (ex. Accounting) ...28
Table 4 - Attrition and Survival Rates By Module of Study After Year 1 of
University: Engineering ...34
Table 5 - Attrition and Survival Rates By Module of Study After Year 1 of
University: Humanities and Languages ...37
Table 6 - Attrition and Survival Rates By Module of Study After Year 1 of
University: Computing and Information Technology ...47
Table 7 - Attrition and Survival Rates By Module of Study After Year 1 of
University: Science (ex. Nursing and other Health-related)...50
Table 8 - Attrition and Survival Rates By Module of Study After Year 1 of
University: Social Science (ex. Nursing, Social work, and other
Health-Related)...53
Table 9 - Attrition and Survival Rates By Module of Study After Year 1 of
University: Accounting...58
Table 10 - Attrition and Survival Rates By Module of Study After Year 1 of
University: Nursing ...59
Table 11 - Attrition and Survival Rates By Module of Study After Year 1 of
University: Social Work and (non-Nursing) Health-Related...61
Table 12 - Programmes of Study With 10 or Fewer Students: 2002, 2003,
2004 ...63
Table 13 - Programmes of Study With 60 or More Students: 2002, 2003,
2004 ...67
Table 14 - Attrition and Survival Rates By Sex After Year 1 of University .69
Table 15 - Attrition and Survival Rates By Social Class After Year 1 of
University ...70
Table 16 - Attrition and Survival Rates By Religion After Year 1 of
University ...71
0. Executive Summary
An important reason for being concerned about low rates of retention in
Higher Education is the concomitant wastage of resources from the
perspective of both funding bodies and higher education institutions.
However, another reason for concern with low retention rates is the
implication that they carry for future cohorts of students. This is best
encapsulated in the following statement:
“Increasing non-completion rates could undermine success in
opening higher education to a broader spectrum of the
population, put off potential students, and cause institutional
instability.”
Parliamentary Select Committee on Education & Employment (2001,
pp. v)
The central issue analysed in this paper is how the probability of a first
year student proceeding to the second year of his/her studies is influenced by
his/her personal characteristics and circumstances. We refer to this probability
as the probability of survival
2and the results reported here are in terms of the
marginal
probability
of survival. This is the
change
in the probability of
survival consequent upon a change in a specific determining variable (i.e.
between female and male students or between middle-class and
working-class students)
when the values of the other variables are left unchanged
.
The key findings are
Gender
- the probability of women surviving the first year was 3.7
percentage points higher than that for men
ceteris paribus
.
Socio-economic class
- compared to those students coming from an
unskilled or semi-skilled social background, the probability of surviving
the first year was 4.1 points higher for students from a professional
social class; however, there was no significant difference between the
survival rates of students from unskilled and skilled backgrounds.
Religion –
compared to students from “other” religions, Catholic
students were less likely to survive their first year by 4.0 points;
however, there was no significant difference between the survival rates
of students from “other” religions and Protestant students.
Usual domicile -
Compared to students whose domicile was outside
Northern Ireland (the residual domicile category), students from
Northern Ireland were less likely to survive their first year by 8.4 points.
Offer basis
- the probability of survival was not significantly affected by
the quality of the student’s school leaving grades or by the fact that
he/she had been made a “non-traditional” offer based on other than
A-levels.
Course type -
Compared to the probability of surviving the first year of
an Accounting course (the residual category of course type), the
probability of:
• surviving an Art and Design course type was 10.8 points lower
• surviving a Business and Management course type was 11.5
points lower
• surviving a Computing and Information Technology course type
was 22.4 points lower
• surviving a Science course type (excluding Nursing and
(non-Nursing) Health-related) was 14.0 points lower
• surviving a Social Science course type (excluding Nursing, Social
Work and (non-Nursing) Health-related) was 18.4 points lower
• surviving Nursing courses was not significantly different from the
survival rate for Accounting courses.
• surviving Social Work courses was not significantly different from
the survival rate for Accounting courses.
• surviving (non-Nursing) Health-related courses was not
significantly different from the survival rate for Accounting
courses.
From these results, one can identify the Northern Ireland domiciled
“student type” studying at the University of Ulster with the highest and lowest
survival rates. Female, Protestant students, from a professional background,
taking Social Work and (non-nursing) health-related courses had a survival
rate of 96.1 percent while male, Catholic students, from an
1. Introduction and Literature Survey
What is retention and why is it important?
The Higher Education Funding Council for England and Wales
(HEFCE) confirmed in its evidence to the Parliamentary Select Committee on
Education & Employment in January 2001 that there was no standard
definition of retention
“There are no nationally or internationally agreed definitions of
non-completion, and a wide range of possible constructions and
interpretations exist.”
Parliamentary Select Committee on Education & Employment
(2001, pp. 109)
For example, a student who successfully completes one or two modules but
fails the year as a whole may still be in a position to transfer those module
credits to another course within the same institution or possibly to another
institution.
Besides the impact of retention on resource wastage from the perspective of
the funding bodies
3and also the institutions, the same Parliamentary Select
Committee report noted that one reason for being concerned about retention
was for the potential students of the future as
“Increasing non-completion rates could undermine success in
opening higher education to a broader spectrum of the
population, put off potential students, and cause institutional
Parliamentary Select Committee on Education & Employment
(2001, pp. v)
The most recent national figures on retention from the Higher
Education Statistics Agency cover the academic year 2003/04 (HESA (2006)).
These figures indicate a national UK attrition rate (i.e. those no longer in any
form of higher education) of 9.5% with another 2.8% transferring to another
institution. The figures for the University of Ulster are higher than this with
14.7% no longer in any form of higher education and 1.7% transferring to
another institution.
Such data has been collected annually by the 4 UK funding bodies since
1998
4and an analysis of this reveals that UK attrition rates have been
relatively stable at 9½ – 10% and UU attrition rates have been relatively
stable at 10% – 14% despite growth rates in the 1
styear undergraduate
population of 10% and 90% respectively, over the period 1996/97 – 2003/04.
The attrition rates that we will observe in this analysis comprise the totality
of 4 separate components:
1. Withdrawal entirely from higher education (the 14.7% figure quoted by
HESA for the University of Ulster in the academic year 2003/04)
2. Transfer to another higher education institution to commence a
programme of study in the following academic year (the 1.7% figure
quoted by HESA for the University of Ulster in the academic year
2003/04)
3. Transfer within the University of Ulster to commence a programme of
study in the following academic year (not included within the HESA
definitions).
4. Repeating the first year of a programme of study at the University of
Ulster in the following academic year (not included within the HESA
definitions).
For example, the definitional difference is that our observed attrition rate
(elements 1, 2, 3 and 4) is higher than the HESA definition of the attrition rate
(elements 1 and 2) by approximately 4% in 2002/03 and 2% in 2003/04
5.
Literature Survey - Theory
The standard theoretical reference usually referred to in the student
attrition literature is to the student integration model of Tinto (1975) where the
likelihood of a student withdrawing from higher education is seen as being
determined by individual attributes, familial attributes, prior qualifications,
social integration, academic integration, individual commitment, institutional
commitment and external family and societal factors taking place during the
course of study.
One of the problems researchers are faced with when applying this model is
that Tinto takes a sociological perspective to the situation and specifically
focuses upon academic integration (grade performance, student's private
judgement on the value of what they are learning, academic self-esteem,
enjoyment of subject, enjoyment of studying, identification with academic
norms and values) and social integration (number of friends, personal contact
looking at an intake of 450 1
styear students at Bristol Business School in
1996/1997 and Lowe & Cook (2003) at the University of Ulster which we will
return to later.
Thus most studies take a lead not dissimilar to that of Yorke (1999) who
effectively has set the pattern of most subsequent research in the UK on
student attrition. Yorke identified, from previous research such as Thomas,
Adams and Birchenough (1996), three primary causes of withdrawal amongst
full-time students: a mismatch between students and their chosen programme
of study, financial difficulties for the student and poor quality of the student
experience.
Literature Survey - US evidence
Reason (2003) provides a useful overview of the main studies for the
United States prior to that date – here we will follow his approach which is to
look at studies categorised by the independent variables under analysis.
High School grade point average (GPA) and college admission test scores
(SAT/ACT) have proved to be a statistically significant determinant of
retention in a number of US studies (e.g. Astin et al (1987) and Tross et al
(2000)) with a higher GPA or a higher college admission test score leading to
a higher probability of retention; however, these variables do not predict more
than a quarter of the variation in retention by themselves. A further issued
highlighted by Wolfe & Johnson (1995) is that these two prior attainment
variables are usually highly collinear.
Gender has proved to be statistically significant in some studies (e.g. Astin et
al (1987)) although other more recent studies (Leppel (2002)) suggest that the
effects of gender are more complicated. In this paper Leppel indicates that the
retention with married women less likely to persist in higher education than
unmarried women.
Race & ethnicity have also been shown to be important determinants of
retention in the United States but recent studies such as Murtaugh et al
(1999) suggest that this effect has diminished substantially in recent years
and may no longer be statistically significant.
Astin (1997) indicates that these four variables (High School grade point
average, college admission test scores, gender and race) account for the bulk
of variance in retention.
Literature Survey - UK evidence
Patrick (2001) uses data from a sub-set of a 1
styear cohort at the
University of Glasgow (1998/99 session) to undertake both logistic and
multilevel regressions. The independent variables are entry routes
(categorised into entry by Scottish Highers, entry by ‘A’-levels, entry by
Scottish Lowers and others) and the subject area which they are studying.
His findings on entry routes were that those with Scottish Highers (32%) were
statistically significantly
6less likely to withdraw and those with other
qualifications (17%) were statistically significantly more likely to withdraw
ceteris paribus
.
The subject effects are that certain subjects (which are not identified by the
author) do have different withdrawal rates than others after partly correcting
for entry route differences. These differences are attributed by the author to
differences in the academic standard required by students upon entry or the
nature of the course as students on vocational courses do seem to do better.
A more wide ranging study is that undertaken by Smith & Naylor (2001) who
used individual level data for a one-year cohort from the whole of the
‘pre-1992’ universities (the former UFC funded institutions). This data included all
of those who enrolled on their studies in the academic year 1989/1990 which
was just over 76000 students. One slightly unusual factor in their work is that
their definition of withdrawal is defined as leaving the course before the
January of the final year of study – thus they include typically at least a year
and a third more of educational participation than do most studies which focus
on withdrawal before the commencement of the 2
ndyear of study. The more
relevant descriptive statistics from their survey for our purposes are: (i) that
amongst different subject disciplines, computer science has the highest
attrition rate of 15% compared to the lowest of 6% for Law; (ii) the drop-out
rate lowers as ‘A’-level point scores rise and (iii) the drop-out rate is lower for
those students with ‘professional’ or unskilled parents than for other groups
7.
They then undertake a bivariate probit analysis for male and female students
separately with the following statistically significant findings:
• the probability of withdrawal is reduced for both genders as the ‘A’-level
point score increases.
• the probability of withdrawal is increased for females studying sciences (but
not statistically significantly so for males).
7 The lower drop-out rate for those students who had unskilled parents may be explained for
• the probability of withdrawal is increased for both genders when studying
social sciences.
• the probability of withdrawal is reduced for mature students generally but
not statistically significantly so for females aged 34 or older.
• the probability of withdrawal is reduced for married male students but not
statistically significantly reduced for married female students.
• the probability of withdrawal is reduced for those male students with
parents in the ‘professional’ socio-economic class but not statistically
significantly for any other type of parental socio-economic class.
2. Data Description
The data for the analysis reported in this paper pertained to a total of
15,123
first-year
students at the University of Ulster enrolled in October 2002,
2003, and 2004. For each of these (first year) students, the university’s
records provided information about his/her:
1. Programme of study (for example, BA in Economics) and the course
type (for example, Social Sciences): in total, there were 385
programmes of study across 10 course types.
82. Whether the student proceeded, or did not proceed, to the next year of
his/her programme of study (survived/did not survive).
3. Sex, social class, religion, ethnicity, disability (if any), domicile, marital
status, year of entry, and basis for acceptance to the University
(A-levels, HND etc.).
Table 1 shows the survival and attrition rates (defined, respectively, as the
percentage of students who proceeded/did not proceed to the next year) by
course type. The overall attrition rate for the University, over the three years,
was nearly 19 percent but this rate varied considerably between course types:
the attrition rate was
lowest
for professional course types (8 percent for Social
Work and non-nursing health-related – for example, physiotherapy; 10
percent for Nursing; and 12 percent for Accounting) and
highest
for
Engineering (31 percent), Computing and Information Technology (28
percent), and Social Sciences (20 percent).
Tables 2- 11 show, for each course type, the attrition and survival rates by
programme of study. Of the 385 programmes of study offered by the
University of Ulster, 195 programmes admitted 10 or fewer students over
three years; the majority of these being in the new modular degree
programmes. On the other hand, 79 of the 385 programmes on offer had total
intakes of 60 students or more over 2002-2004. These “low intake” and “high
intake” programmes are listed in Tables 12 and 13, respectively. Of the 195
low intake programmes, 92 were from Humanities and Languages, 40 were
from Business and Management, 25 were from Social Sciences, and 15 were
from the Sciences. Of the 79 high intake programmes, 17 were from
Business and Management, 13 were from Social Sciences, 12 were from
Engineering, and 13 were from the professional programmes (Accounting,
Nursing, and Social Work and (non-nursing) Health-related).
Table 14 shows that the probability of female students surviving their
courses (85.2 percent) was significantly higher than that for male students
(75.8 percent); Table 15 shows that the probability of surviving courses
decreases as the social class of the students moves from a professional
background (86.2 percent survival rate) to an unskilled background (76.9
percent survival rate); Table 16 shows that students from other religions had
the highest survival rates (89.4 percent), followed by Protestant students (87.3
percent), followed by Catholic students (80.9 percent); lastly, Table 17 shows
from outside the EU had the highest survival rates (97.1 percent), followed by
non-UK EU students (92.7 percent), with the survival rates of students from
3. Estimating the Probabilities of Continuing after the First Year at
University
An important question is how the probability of a first year student
proceeding to the second year of his/her studies was influenced by his/her
personal characteristics and circumstances. In order to answer this question
we estimated a logit model in which the dependent variable
Y
i=1
if student
i
“survived” (i.e. proceeded to the second year of study) and
Y
i=0
if he/she did
not “survive”.
9The results of estimating this (survival) equation on data for
8,631 students over the 3 years (2002/03 to 2004/05) are shown in Table
18
10. A positive (negative) coefficient estimate indicates that the probability of
continuing rises (falls) with an increase in the value of the variable associated
with the coefficient. However, the coefficient estimates do not provide a guide
to the amount by which the probability of survival increases or decreases in
consequence of a change in the variable value.
For this reason, the estimation results are discussed in terms of
“marginal probabilities” shown in the last column of Table 18. The
marginal
probability
of survival, associated with a determining variable, is the change in
the probability of survival consequent upon an unit change in the determining
variable, the values of the other variables remaining unchanged. For discrete
variables, the marginal probabilities refer to changes consequent upon a
9 The logit equation is
1
Pr( 1)
exp{ } exp{ } 1 Pr( 1)
K i
ik i i k
i Y
X z
Y = β
=
= =
− =
∑
for K coefficients, βi and forobservations on K variables where Pr( 1) z/(1 z) i
Y = =e +e
10 The reduction in the number of observations under analysis is due to the unavailability of
socio-move from the
residual category
11for that variable to the category in
question.
12Table 18 shows that the probability of women surviving was
ceteris
paribus
3.7 percentage points higher than that for men (the residual gender
category).
Compared to the probability of surviving an Accounting course
(the
residual category of course type), the probability of:
(1) Surviving an Art and Design course type was 10.8 points lower
(2) Surviving a Business and Management course type was 11.5
points lower
(3) Surviving an Engineering course type was 26.2 points lower
(4) Surviving a Humanities course type was 16.7 points lower
(5) Surviving a Computing and Information Technology course type
was 22.4 points lower
(6) Surviving a Science course type (excluding Nursing and
(non-Nursing) Health-related) was 14.0 points lower
(7) Surviving a Social Science course type (excluding Nursing,
Social Work and (non-Nursing) Health-related) was 18.4 points
lower
There was no significant difference between the survival rate for Accounting
and for Nursing and for Social Work and (non-Nursing) Health-related
courses.
13Table 18 also shows that
compared to coming from an unskilled or
semi-skilled social background
(the residual social class category), the
probability of survival was 4.1 points higher for students from a professional
social class; however, there was no significant difference between the survival
rates of students from unskilled and skilled backgrounds.
Compared to
students from “other” religions
, Catholic students were less likely to survive
the first year of study by 4.0 points though this difference was only significant
at the 10% level; however, there was no significant difference between the
survival rates of students from “other” religions and Protestant students.
Compared to students whose domicile was outside Northern Ireland
(the
residual domicile category), students from Northern Ireland were less likely to
survive by 8.4 points. Lastly, the probability of survival was not significantly
affected by the quality of the student’s school leaving grades or by the fact
that he/she had been made a “non-traditional” offer based on other than
A-levels.
It is important to note that the difference in survival probabilities
between Accounting and the other course types as reported in Table 18 (the
marginal probabilities) are considerably different from the differences reported
in Table 1. This is because, the latter differences are the raw differences,
resulting not only from differences in course types but also from differences in
all the other factors (sex, social class, religion etc.) between the course types.
The marginal probabilities, as reported in Table 18, focus solely on
differences between course types by controlling for differences in the other
factors. For example, the survival rate for nursing was 90 percent compared
students were female compared to only 52 percent of Accounting students.
After controlling for gender, nursing was estimated to have a lower survival
probability (6.8 percent though, admittedly, not significant) than Accounting.
From the results reported in Table 18, one can identify the Northern
Ireland domiciled “student type” with the highest and lowest survival rates.
Female, Protestant students, from a professional background, taking Social
Work and (non-nursing) health-related courses had a rate of 96.1 percent
while male, Catholic students, from an unskilled/semi-skilled background,
4. Earlier non-econometric analysis of retention at the University
of Ulster
A localised example of an application of the Tinto student integration
model is in Lowe & Cook (2003) which details the results of two surveys of
first year students at the University of Ulster in the academic year 2000/01
with the first survey being undertaken prior to university entry (to measure
expectations) and one being undertaken three months later (to analyse how
far expectations met with actuality). There were 691 students who responded
to both surveys – predominantly from the business and management & health
science disciplines (64% of the sample).
The first survey focused on how prepared students were for higher
education and what their reasons where for coming to University with the
questions on how prepared students were for their higher education
experience prior to entry revealing that 17% of the students knew nothing
about their 1
styear modules, 18% knew nothing of how they would be
assessed, 26% did not know if the course would involve a placement and
57% knew nothing of the number of hours of contact per week. The
overwhelming reasons for coming to University were liking the idea of going to
university (78% of the sample agreed or strongly agreed), university being
‘better than the dole’ (58% of the sample agreed or strongly agreed), meeting
social norms (25% of the sample agreed or strongly) or parental pressure
(22% of the sample agreed or strongly agreed).
The remainder of the survey dealt with issues such as why did the
students come to the University of Ulster, what their opinions were of the
personal & practical problems with University life. It is these latter two
categories to which we will now turn.
The survey found that issues such as homesickness, a lack of personal
support from family and a lack of confidence were more feared (in the first
survey) than actually experienced (in the second survey) – despite this 47% of
students were experiencing feelings of homesickness from missing friends
whilst 35% were experiencing feelings of homesickness from missing family
(there is no measurement of the severity of these feelings in the survey so we
cannot distinguish between mild discomfort and severe discomfort).
The questions on study and personal skills revealed further divergence
between the experience of student life expected by students and that actually
experienced, particularly with regard to the different styles of teaching and
learning, with students experiencing particular problems with note taking in
lectures and even the size of classes themselves.
Overall, from our perspective, the main conclusion reached by the
authors is that up to 20% of students in their first year at the University of
Ulster may be failing to come to terms with the academic and social demands
of life at University with a caveat being expressed that the nature of the
survey was biased towards those who enrolled on time and who were still
attending classes late in the autumn term so it is conceivable that this figure
might be an underestimate as it excludes those students who have effectively
left the course but have not officially indicated their decision to University
5. Conclusions
The important question under analysis here is how the probability of a
first year student proceeding to the second year of his/her studies is
influenced by his/her personal characteristics and circumstances. In order to
answer this question a logit model was estimated with the dependent variable
set equal to 1 if the student “survived” (i.e. proceeded to the next year) and 0
if he/she did not “survive”.
The key findings are
Gender
- the probability of women surviving the first year was 3.7
percentage points higher than that for men (the residual gender
category)
ceteris paribus
.
Socio-economic class
- compared to those students coming from an
unskilled or semi-skilled social background (the residual social class
category), the probability of surviving the first year was 4.1 points
higher for students from a professional social class; however, there
was no significant difference between the survival rates of students
from unskilled and skilled backgrounds.
Religion –
compared to students from “other” religions, Catholic
students were less likely to survive their first year by 4.0 points though
this difference was only significant at the 10% level; however, there
was no significant difference between the survival rates of students
from “other” religions and Protestant students.
Usual domicile -
Compared to students whose domicile was outside
Northern Ireland (the residual domicile category), students from
Offer basis
- the probability of survival was not significantly affected by
the quality of the student’s school leaving grades or by the fact that
he/she had been made a “non-traditional” offer based on other than
A-levels.
Course type -
Compared to the probability of surviving the first year of
an Accounting course (the residual category of course type), the
probability of:
• surviving an Art and Design course type was 10.8 points lower
• surviving a Business/Management course type was 11.5 points
lower
• surviving an Engineering course typewas 26.2 points lower
• surviving a Humanities course type was 16.7 points lower
• surviving a Computing and Information Technology course type
was 22.4 points lower
• surviving a Science course type (excluding Nursing and
(non-Nursing) Health-related) was 14.0 points lower
• surviving a Social Science course type (excluding Nursing, Social
Work and (non-Nursing) Health-related) was 18.4 points lower
• surviving Nursing courses was not significantly different from the
survival rate for Accounting courses.
• surviving Social Work courses was not significantly different from
the survival rate for Accounting courses.
From these results, one can identify the Northern Ireland domiciled
“student type” with the highest and lowest survival rates. Female, Protestant
students, from a professional background, taking Social Work and
(non-nursing) health-related courses had a survival rate of 96.1 percent while male,
Catholic students, from an unskilled/semi-skilled background, studying
References
• Astin, A. W., Korn, W., & Green, K. (1987), “Retaining and satisfying
students”,
Educational Record,
Vol. 68 No. 1,
pp. 36 - 42.
• Astin, A. W. (1997), “How ‘good’ is your institution’s retention rate?”,
Research in Higher Education
, Vol. 38,
pp. 647 - 658.
• Bailey, M. F. (2003), “The labour market participation of Northern Ireland
University Students”,
Applied Economics
, Vol. 35 No.11, pp. 1345 - 1350.
• HESA (2006), “Performance Indicators in Higher Education in the UK
2002/03”, Cheltenham: Higher Education Statistics Agency [accessed
online at
http://www.hesa.ac.uk/pi/0405/home.htm
on 8th September 2006]
• Hunt, A., Lincoln, I. & Walker, A. (2004), “Term-Time Employment and
Academic Attainment: evidence from a large-scale survey of
undergraduates at Northumbria University”,
Journal of Further and Higher
Education
, Vol. 28 No.1, pp. 4 – 18.
• Leppel, K. (2002), “Similarities and differences in the college persistence of
men and women”,
The Review of Higher Education,
Vol. 25 No. 4, pp. 433
- 450.
• Lowe, H & Cook, A. (2003), “Mind the gap: are students prepared for higher
education?”,
Journal of Further and Higher Education
, Vol. 27 No. 1, pp. 53
– 76.
• Mackle, S. E. (2001), “Jumping the Hurdles – Undergraduate Student
Withdrawal Behaviour”,
Innovations in Education and Teaching
International
, Vol. 38 No. 3, pp. 265 – 276.
• Murtaugh, P. A., Burns, L. D., Schuster, J. (1999), “Predicting the retention
of university students”,
Research in Higher Education,
Vol. 40 No. 3, pp.
355 -371.
• Parliamentary Select Committee on Education & Employment. (2001),
Higher Education: Student Retention. Report, together with the
proceedings of the Committee, Minutes of Evidence taken before the
• Patrick, W. J. (2001), “Estimating First-Year student attrition rates: An
application of multilevel modelling using categorical variables”,
Research in
Higher Education
, Vol. 42 No.2, pp. 151 – 170.
• Pugh, G., Coates, G. & Adnett, N. (2005), “Performance Indicators and
Widening Participation in UK Higher Education”,
Higher Educational
Quarterly
, Vol.59 No. 1, pp. 19 – 39.
• Reason, R. D. (2003), “Student variables that predict retention: Recent
research and new developments”,
NASPA Journal
, Vol. 40 No. 4, pp. 172 –
191.
• Smith, J. P. & Naylor, R. A. (2001), “Dropping out of university: a statistical
analysis of the probability of withdrawal for UK university students”,
Journal
of the Royal Statistical Society: Series A
, Vol. 164 No. 2, pp. 389 - 405.
• Thomas, M.; Adams, S. and Birchenough, A. (1996), “Student withdrawal
from higher education”,
Educational Management and Administration
, Vol.
24 No. 2, pp. 207 – 221.
• Tinto, V. (1975) "Dropout from Higher Education: A Theoretical Synthesis
of Recent Research",
Review of Educational Research
, Vol. 45 No. 1,
pp.89 - 125.
• Tross, S. A., Harper, J. P., Osher, L. W., & Kneidinger, L. M. (2000), “Not
just the usual cast of characteristics: Using personality to predict college
performance and retention”,
Journal of College Student Development
, Vol.
41 No.3
,
pp.
323 - 334.
• Wolfe, R. N., & Johnson, S. D. (1995), “Personality as a predictor of college
performance”,
Educational and Psychological Measurement,
Vol. 55 No.2,
pp. 177–185.
• Yorke, M. & Thomas, L. (2003), “Improving the Retention of Students from
Lower Socio-economic Groups”,
Journal of Higher Education Policy and
Management
, Vol. 25 No. 1, pp. 63 – 74.
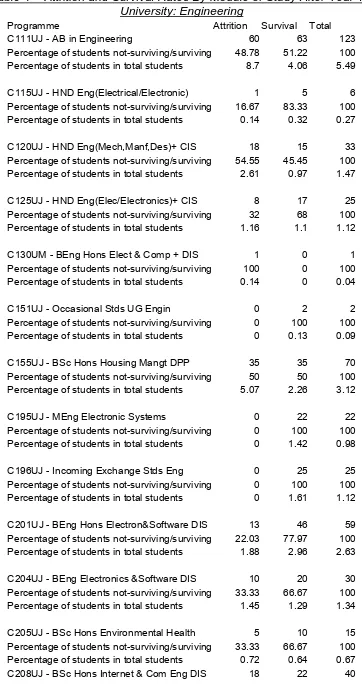
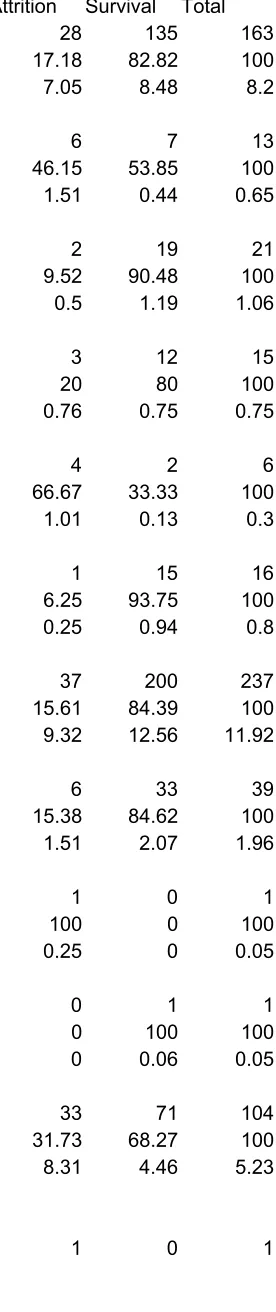
Table 1 - Attrition and Survival Rates By Course of Study After Year 1 of
University
Attrition Survival Total
Art and Design 149 1,078 1,227
Percentage of students not-surviving/surviving 12.14 87.86 100 Percentage of students in total students 5.29 8.76 8.11
Business and Management (excluding
Accounting) 478 2,400 2,878
Percentage of students not-surviving/surviving 16.61 83.39 100 Percentage of students in total students 16.96 19.50 19.03
Engineering 690 1,552 2,242
Percentage of students not-surviving/surviving 30.78 69.22 100 Percentage of students in total students 24.49 12.61 14.83
Humanities and Languages 305 1,598 1,903 Percentage of students not-surviving/surviving 16.03 83.97 100 Percentage of students in total students 10.82 12.99 12.58
Computing and Information Technology 446 1,130 1,576 Percentage of students not-surviving/surviving 28.30 71.70 100 Percentage of students in total students 15.83 9.18 10.42
Science (excluding. Nursing and other
health-related) 141 820 961
Percentage of students not-surviving/surviving 14.67 85.33 100 Percentage of students in total students 5.00 6.66 6.35
Social Science (excluding. Nursing, Social Work,
and other health-related) 397 1,592 1,989 Percentage of students not-surviving/surviving 19.96 80.04 100 Percentage of students in total students 14.09 12.94 13.15
Accounting 44 338 382
Percentage of students not-surviving/surviving 11.52 88.48 100 Percentage of students in total students 1.56 2.75 2.53
Nursing 85 780 865
Percentage of students not-surviving/surviving 9.83 90.17 100 Percentage of students in total students 3.02 6.34 5.72
Social Work and health related (ex. nursing) 83 1,017 1,100 Percentage of students not-surviving/surviving 7.55 92.45 100 Percentage of students in total students 2.95 8.26 7.27
Total 2,818 12,305 15,123
Table 2 - Attrition and Survival Rates By Module of Study After Year 1 of
University: Art and Design
Programme Attrition Survival Total
A105UB - Cert in Found std in Art & Des 6 0 6 Percentage of students not-surviving/surviving 100 0 100 Percentage of students in total students 4.03 0 0.49
A106UB - Dip in Found Std in Art & Design 41 352 393 Percentage of students not-surviving/surviving 10.43 89.57 100 Percentage of students in total students 27.52 32.65 32.03
A196UB - Incoming Exchange Stds Arts 0 6 6 Percentage of students not-surviving/surviving 0 100 100 Percentage of students in total students 0 0.56 0.49
A212UB - BA Hons Architecture 22 59 81
Percentage of students not-surviving/surviving 27.16 72.84 100 Percentage of students in total students 14.77 5.47 6.6
A215UB - BA Hons Design for Visual Comm 7 32 39 Percentage of students not-surviving/surviving 17.95 82.05 100 Percentage of students in total students 4.7 2.97 3.18
A216UB - BDes Hons Design for Vis Comm 7 71 78 Percentage of students not-surviving/surviving 8.97 91.03 100 Percentage of students in total students 4.7 6.59 6.36
A240UB - BA Hons Fine & Applied Arts 23 266 289 Percentage of students not-surviving/surviving 7.96 92.04 100 Percentage of students in total students 15.44 24.68 23.55
A245UB - BA Hons Textiles and Fashion 3 28 31 Percentage of students not-surviving/surviving 9.68 90.32 100 Percentage of students in total students 2.01 2.6 2.53
A246UB - BDes Hons Textiles and Fashion 2 47 49 Percentage of students not-surviving/surviving 4.08 95.92 100 Percentage of students in total students 1.34 4.36 3.99
A250UB - BA Hons Art and Design 16 60 76
Percentage of students not-surviving/surviving 21.05 78.95 100 Percentage of students in total students 10.74 5.57 6.19
A355UB - Junior Year Abroad Arts 0 2 2
Percentage of students not-surviving/surviving 19.23 80.77 100 Percentage of students in total students 3.36 1.95 2.12
A491UB - BDes Int Ind and Furn Design 9 46 55 Percentage of students not-surviving/surviving 16.36 83.64 100 Percentage of students in total students 6.04 4.27 4.48
A491UM - BDes Hons Design & Communicat 8 88 96 Percentage of students not-surviving/surviving 8.33 91.67 100 Percentage of students in total students 5.37 8.16 7.82
Total 149 1,078 1,227
Table 3 - Attrition and Survival Rates By Module of Study After Year 1 of
University: Business and Management (ex. Accounting)
Attrition Survival Total
B106UM - BSc Hons Mkt & Int Politics 0 1 1
Percentage of students not-surviving/surviving 0 100 100 Percentage of students in total students 0 0.04 0.03
B108UJ - BA Hons Human Res Mangt DIS 14 60 74 Percentage of students not-surviving/surviving 18.92 81.08 100 Percentage of students in total students 2.93 2.5 2.57
B109UJ - BSc Hons Marketing DIS 23 152 175
Percentage of students not-surviving/surviving 13.14 86.86 100 Percentage of students in total students 4.81 6.33 6.08
B116UM - BSc Hons Busn Stds with Spanish 2 2 4 Percentage of students not-surviving/surviving 50 50 100 Percentage of students in total students 0.42 0.08 0.14
B117UM - BSc Hons Busn Stds with Psychology 1 5 6 Percentage of students not-surviving/surviving 16.67 83.33 100 Percentage of students in total students 0.21 0.21 0.21
B119UM - BSc Hons Busn Std with Int Pol 0 2 2
Percentage of students not-surviving/surviving 0 100 100 Percentage of students in total students 0 0.08 0.07
B121UM - BSc Hons Busn Stds with German 0 2 2
Percentage of students not-surviving/surviving 0 100 100 Percentage of students in total students 0 0.08 0.07
B122UM - BSc Hons Busn Stds with French 0 2 2
Percentage of students not-surviving/surviving 0 100 100 Percentage of students in total students 0 0.08 0.07
B123UM - BSc Hons Busn Stds with Drama 1 2 3 Percentage of students not-surviving/surviving 33.33 66.67 100 Percentage of students in total students 0.21 0.08 0.1
B124UM - BA Hons Bus Stds Opt DIS 32 235 267 Percentage of students not-surviving/surviving 11.99 88.01 100 Percentage of students in total students 6.69 9.79 9.28
B125UM - BA Hons Bus St(specialism)DIS 0 1 1
Percentage of students not-surviving/surviving 13.04 86.96 100 Percentage of students in total students 0.63 0.83 0.8
B150UJ - BA Hons Business Studies 1 0 1
Percentage of students not-surviving/surviving 100 0 100 Percentage of students in total students 0.21 0 0.03
B151UM - LLB Hons Law with Marketing 1 1 2
Percentage of students not-surviving/surviving 50 50 100 Percentage of students in total students 0.21 0.04 0.07
B152UC - BA Hons Retail Management 13 66 79 Percentage of students not-surviving/surviving 16.46 83.54 100 Percentage of students in total students 2.72 2.75 2.74
B152UM - LLB Hons Law with Irish 1 0 1
Percentage of students not-surviving/surviving 100 0 100 Percentage of students in total students 0.21 0 0.03
B153UM - LLB Hons Law with Inter Pol 3 4 7
Percentage of students not-surviving/surviving 42.86 57.14 100 Percentage of students in total students 0.63 0.17 0.24
B154UC - BSc Hons Busn Fin & Investment 22 128 150 Percentage of students not-surviving/surviving 14.67 85.33 100 Percentage of students in total students 4.6 5.33 5.21
B154UM - LLB Hons Law with Hum Res Mgt 1 2 3 Percentage of students not-surviving/surviving 33.33 66.67 100 Percentage of students in total students 0.21 0.08 0.1
B155UJ - BA Hons Busn Studies with DIS 41 270 311 Percentage of students not-surviving/surviving 13.18 86.82 100 Percentage of students in total students 8.58 11.25 10.81
B155UM - LLB Hons Law with German 0 1 1
Percentage of students not-surviving/surviving 0 100 100 Percentage of students in total students 0 0.04 0.03
B156UM - LLB Hons Law with French 2 8 10
Percentage of students not-surviving/surviving 20 80 100 Percentage of students in total students 0.42 0.33 0.35
B158UM - LLB Hons Law with Drama 1 2 3
Percentage of students not-surviving/surviving 33.33 66.67 100 Percentage of students in total students 0.21 0.08 0.1
Percentage of students not-surviving/surviving 23.88 76.12 100 Percentage of students in total students 3.35 2.13 2.33
B170UJ - BA Hons Economics with DIS 3 0 3
Percentage of students not-surviving/surviving 100 0 100 Percentage of students in total students 0.63 0 0.1
B174UC - Occasional Stds UG B&M (Port) 0 1 1
Percentage of students not-surviving/surviving 0 100 100 Percentage of students in total students 0 0.04 0.03
B175UC - Occasional Stds UG B&M 0 3 3
Percentage of students not-surviving/surviving 0 100 100 Percentage of students in total students 0 0.13 0.1
B175UM - Occasional Stds UG B&M 0 1 1
Percentage of students not-surviving/surviving 0 100 100 Percentage of students in total students 0 0.04 0.03
B177UC - BA Hons Management DIS 12 24 36
Percentage of students not-surviving/surviving 33.33 66.67 100 Percentage of students in total students 2.51 1 1.25
B186UC - BA Hons Bus Stds with Comp DIS 21 136 157 Percentage of students not-surviving/surviving 13.38 86.62 100 Percentage of students in total students 4.39 5.67 5.46
B193UJ - BSc Hons Sport Exer&Leisure 3 87 90 Percentage of students not-surviving/surviving 3.33 96.67 100 Percentage of students in total students 0.63 3.62 3.13
B196UC - Incoming Exchange Stds B&M 0 158 158
Percentage of students not-surviving/surviving 0 100 100 Percentage of students in total students 0 6.58 5.49
B196UJ - Incoming Exchange Stds B&M 1 14 15 Percentage of students not-surviving/surviving 6.67 93.33 100 Percentage of students in total students 0.21 0.58 0.52
B196UM - Incoming Exchange Stds B&M 0 10 10
Percentage of students not-surviving/surviving 0 100 100 Percentage of students in total students 0 0.42 0.35
Percentage of students not-surviving/surviving 100 0 100 Percentage of students in total students 0.21 0 0.03
B233UC - BA Hons Trav&Tour Mg DIS PRUSH 9 37 46 Percentage of students not-surviving/surviving 19.57 80.43 100 Percentage of students in total students 1.88 1.54 1.6
B235UC - BA Hons Hosplty Mngt DIS PRUSH 6 34 40 Percentage of students not-surviving/surviving 15 85 100 Percentage of students in total students 1.26 1.42 1.39
B240UC - FdSc Culinary Arts PORTRUSH 0 1 1
Percentage of students not-surviving/surviving 0 100 100 Percentage of students in total students 0 0.04 0.03
B240UJ - LLB/BSc Hon Law and Government 57 153 210 Percentage of students not-surviving/surviving 27.14 72.86 100 Percentage of students in total students 11.92 6.38 7.3
B245UJ - LLB/BSc Hons Law and Economics 18 48 66 Percentage of students not-surviving/surviving 27.27 72.73 100 Percentage of students in total students 3.77 2 2.29
B251UC - BA Hons Les Ev Cul MgDIS 6 24 30
Percentage of students not-surviving/surviving 20 80 100 Percentage of students in total students 1.26 1 1.04
B281UC - FdA Inter Hospit Mgt PRUSH 0 7 7
Percentage of students not-surviving/surviving 0 100 100 Percentage of students in total students 0 0.29 0.24
B282UC - FdA Trav & Tour Mgt PRUSH 14 29 43 Percentage of students not-surviving/surviving 32.56 67.44 100 Percentage of students in total students 2.93 1.21 1.49
B283UC - FdA Hospitality MangtPRUSH 10 10 20 Percentage of students not-surviving/surviving 50 50 100 Percentage of students in total students 2.09 0.42 0.69
B301UM - LLB/BA Hons Law & Bsn Sts 7 47 54 Percentage of students not-surviving/surviving 12.96 87.04 100 Percentage of students in total students 1.46 1.96 1.88
B302UM - LLB/BA Hons Law & Politics 8 55 63 Percentage of students not-surviving/surviving 12.7 87.3 100 Percentage of students in total students 1.67 2.29 2.19
Percentage of students not-surviving/surviving 20 80 100 Percentage of students in total students 0.84 0.67 0.69
B324UM - BSc Hons Bus Stds with Opts 5 94 99 Percentage of students not-surviving/surviving 5.05 94.95 100 Percentage of students in total students 1.05 3.92 3.44
B333UC - BSc Hons Culinary Art DIS PRSH 3 9 12 Percentage of students not-surviving/surviving 25 75 100 Percentage of students in total students 0.63 0.38 0.42
B335UC - BSc Hons Int Hosp Mgmt PRSH 0 6 6
Percentage of students not-surviving/surviving 0 100 100 Percentage of students in total students 0 0.25 0.21
B346UC - BSc Hons Int Hot and Tour PRSH 1 5 6 Percentage of students not-surviving/surviving 16.67 83.33 100 Percentage of students in total students 0.21 0.21 0.21
B351UC - BSc Hons Les Ev Cul Mg DIS POR 2 3 5 Percentage of students not-surviving/surviving 40 60 100 Percentage of students in total students 0.42 0.13 0.17
B352UC - BSc Hons Retail Mkt and Cust 3 5 8 Percentage of students not-surviving/surviving 37.5 62.5 100 Percentage of students in total students 0.63 0.21 0.28
B354UJ - BSc Hons Busn Studies with DIS 14 66 80 Percentage of students not-surviving/surviving 17.5 82.5 100 Percentage of students in total students 2.93 2.75 2.78
B355UM - Junior Year Abroad Bus & Mgmt 0 1 1
Percentage of students not-surviving/surviving 0 100 100 Percentage of students in total students 0 0.04 0.03
B377UC - BSc Hons Management DIS 2 21 23
Percentage of students not-surviving/surviving 8.7 91.3 100 Percentage of students in total students 0.42 0.88 0.8
B386UC - BSc Hons Bus Std with Comp DIS 7 44 51 Percentage of students not-surviving/surviving 13.73 86.27 100 Percentage of students in total students 1.46 1.83 1.77
Percentage of students not-surviving/surviving 0 100 100 Percentage of students in total students 0 0.04 0.03
B449UC - BSc Hons Busn with Irish 1 0 1
Percentage of students not-surviving/surviving 100 0 100 Percentage of students in total students 0.21 0 0.03
B450UC - BSc Hons Busn with Jour Publ 2 2 4 Percentage of students not-surviving/surviving 50 50 100 Percentage of students in total students 0.42 0.08 0.14
B451UC - BSc Hons Busn with Media Stds 0 1 1
Percentage of students not-surviving/surviving 0 100 100 Percentage of students in total students 0 0.04 0.03
B453UC - BSc Hons Busn with Psychology 2 5 7 Percentage of students not-surviving/surviving 28.57 71.43 100 Percentage of students in total students 0.42 0.21 0.24
B454UC - BSc Hons Busn with Spanish 1 5 6
Percentage of students not-surviving/surviving 16.67 83.33 100 Percentage of students in total students 0.21 0.21 0.21
B480UC - AB in Consumer Studies PRUSH 1 0 1 Percentage of students not-surviving/surviving 100 0 100 Percentage of students in total students 0.21 0 0.03
B480UJ - HND Busn & Rel Studs with CIS 58 137 195 Percentage of students not-surviving/surviving 29.74 70.26 100 Percentage of students in total students 12.13 5.71 6.78
B482UC - AB Int Trav and Tour Mgmt PRSH 1 2 3 Percentage of students not-surviving/surviving 33.33 66.67 100 Percentage of students in total students 0.21 0.08 0.1
Total 478 2,400 2,878
Table 4 - Attrition and Survival Rates By Module of Study After Year 1 of
University: Engineering
Programme Attrition Survival Total
C111UJ - AB in Engineering 60 63 123
Percentage of students not-surviving/surviving 48.78 51.22 100 Percentage of students in total students 8.7 4.06 5.49
C115UJ - HND Eng(Electrical/Electronic) 1 5 6
Percentage of students not-surviving/surviving 16.67 83.33 100 Percentage of students in total students 0.14 0.32 0.27
C120UJ - HND Eng(Mech,Manf,Des)+ CIS 18 15 33
Percentage of students not-surviving/surviving 54.55 45.45 100 Percentage of students in total students 2.61 0.97 1.47
C125UJ - HND Eng(Elec/Electronics)+ CIS 8 17 25
Percentage of students not-surviving/surviving 32 68 100 Percentage of students in total students 1.16 1.1 1.12
C130UM - BEng Hons Elect & Comp + DIS 1 0 1
Percentage of students not-surviving/surviving 100 0 100 Percentage of students in total students 0.14 0 0.04
C151UJ - Occasional Stds UG Engin 0 2 2
Percentage of students not-surviving/surviving 0 100 100 Percentage of students in total students 0 0.13 0.09
C155UJ - BSc Hons Housing Mangt DPP 35 35 70
Percentage of students not-surviving/surviving 50 50 100 Percentage of students in total students 5.07 2.26 3.12
C195UJ - MEng Electronic Systems 0 22 22
Percentage of students not-surviving/surviving 0 100 100 Percentage of students in total students 0 1.42 0.98
C196UJ - Incoming Exchange Stds Eng 0 25 25
Percentage of students not-surviving/surviving 0 100 100 Percentage of students in total students 0 1.61 1.12
C201UJ - BEng Hons Electron&Software DIS 13 46 59 Percentage of students not-surviving/surviving 22.03 77.97 100 Percentage of students in total students 1.88 2.96 2.63
Percentage of students not-surviving/surviving 45 55 100 Percentage of students in total students 2.61 1.42 1.78
C210UJ - BSc Hons Environ Health + DIS 18 70 88
Percentage of students not-surviving/surviving 20.45 79.55 100 Percentage of students in total students 2.61 4.51 3.93
C225UJ BEng Hons Civil Engineering + DIS 22 30 52 Percentage of students not-surviving/surviving 42.31 57.69 100 Percentage of students in total students 3.19 1.93 2.32
C229UJ - BSc Civil Engineering + DIS 4 36 40
Percentage of students not-surviving/surviving 10 90 100 Percentage of students in total students 0.58 2.32 1.78
C265UJ - BSc Hons Const Eng & Mngt + DIS 66 149 215 Percentage of students not-surviving/surviving 30.7 69.3 100 Percentage of students in total students 9.57 9.6 9.59
C266UJ - BSc Construct Engineering DIS 36 57 93
Percentage of students not-surviving/surviving 38.71 61.29 100 Percentage of students in total students 5.22 3.67 4.15
C275UJ - BEng Hons Environ Engin + DIS 7 19 26
Percentage of students not-surviving/surviving 26.92 73.08 100 Percentage of students in total students 1.01 1.22 1.16
C277UJ - BEng Hons Bld Serv Eng DIS 4 9 13
Percentage of students not-surviving/surviving 30.77 69.23 100 Percentage of students in total students 0.58 0.58 0.58
C290UJ - BSc Hons Arch Tech & Mgmt DIS 32 58 90 Percentage of students not-surviving/surviving 35.56 64.44 100 Percentage of students in total students 4.64 3.74 4.01
C299UJ - BSc Hons Tport & Sup Ch MgtDIS 21 37 58 Percentage of students not-surviving/surviving 36.21 63.79 100 Percentage of students in total students 3.04 2.38 2.59
C311UJ - BEng Hons Engineering Mngt DIS 50 68 118 Percentage of students not-surviving/surviving 42.37 57.63 100 Percentage of students in total students 7.25 4.38 5.26
C313UJ - BEng Engineering Mngt DIS 41 15 56
Percentage of students not-surviving/surviving 73.21 26.79 100 Percentage of students in total students 5.94 0.97 2.5
C320UJ - BEng Hons Engineering DIS 2 30 32
Percentage of students not-surviving/surviving 6.25 93.75 100 Percentage of students in total students 0.29 1.93 1.43
Percentage of students not-surviving/surviving 20 80 100 Percentage of students in total students 0.14 0.26 0.22
C330UJ - BEng Mechanical Engineering 13 34 47
Percentage of students not-surviving/surviving 27.66 72.34 100 Percentage of students in total students 1.88 2.19 2.1
C331UJ - BEng Hons Mechanical Engin DIS 23 88 111 Percentage of students not-surviving/surviving 20.72 79.28 100 Percentage of students in total students 3.33 5.67 4.95
C355UJ - Junior Year Abroad Engineering 0 1 1
Percentage of students not-surviving/surviving 0 100 100 Percentage of students in total students 0 0.06 0.04
C374UJ - BSc Hons Quantity Surveying DIS 43 170 213 Percentage of students not-surviving/surviving 20.19 79.81 100 Percentage of students in total students 6.23 10.95 9.5
C375UJ - BSc Hons Building Surveying DIS 33 79 112 Percentage of students not-surviving/surviving 29.46 70.54 100 Percentage of students in total students 4.78 5.09 5
C378UJ - BSc Hons Prop Invest & Dev DIS 29 146 175 Percentage of students not-surviving/surviving 16.57 83.43 100 Percentage of students in total students 4.2 9.41 7.81
C405UJ - BSc Hons Biom Engineering DIS 15 44 59
Percentage of students not-surviving/surviving 25.42 74.58 100 Percentage of students in total students 2.17 2.84 2.63
C406UJ - BSc Biomed Engineering 8 8 16
Percentage of students not-surviving/surviving 50 50 100 Percentage of students in total students 1.16 0.52 0.71
C494UJ - BSc Technology & Design 7 16 23
Percentage of students not-surviving/surviving 30.43 69.57 100 Percentage of students in total students 1.01 1.03 1.03
C495UJ - BSc Hons Tech & Design DIS 39 62 101 Percentage of students not-surviving/surviving 38.61 61.39 100 Percentage of students in total students 5.65 3.99 4.5
C497UJ - BSc Hons Tech with Design DIS 7 40 47
Table 5 - Attrition and Survival Rates By Module of Study After Year 1 of
University: Humanities and Languages
Programme Attrition Survival Total
D106UC - Dip Irish Language 2 11 13
Percentage of students not-surviving/surviving 15.38 84.62 100 Percentage of students in total students 0.66 0.69 0.68
D110UM - BA Hons Irish Hist.& Politics 25 58 83 Percentage of students not-surviving/surviving 30.12 69.88 100 Percentage of students in total students 8.2 3.63 4.36
D112UC - AB in Combined Arts 0 16 16
Percentage of students not-surviving/surviving 0 100 100 Percentage of students in total students 0 1 0.84
D113UC - BA Hons American Studies 3Yr 1 1 2
Percentage of students not-surviving/surviving 50 50 100 Percentage of students in total students 0.33 0.06 0.11
D113UJ - BA Hons American Studies 3Yr 0 1 1
Percentage of students not-surviving/surviving 0 100 100 Percentage of students in total students 0 0.06 0.05
D115UC - BA Hons Media Studies 17 104 121
Percentage of students not-surviving/surviving 14.05 85.95 100 Percentage of students in total students 5.57 6.51 6.36
D117UC - BA Hons Media Arts 3 8 11
Percentage of students not-surviving/surviving 27.27 72.73 100 Percentage of students in total students 0.98 0.5 0.58
D120UC - BA Hons English 35 154 189
Percentage of students not-surviving/surviving 18.52 81.48 100 Percentage of students in total students 11.48 9.64 9.93
D122UC - BA Hons French & Comp DAS 0 2 2
Percentage of students not-surviving/surviving 0 100 100 Percentage of students in total students 0 0.13 0.11
D124UC - BA Hons Span & Comp DAS 0 5 5
Percentage of students not-surviving/surviving 0 100 100 Percentage of students in total students 0 0.31 0.26
D128UC - BA Hons English and Film Stds 1 2 3
Percentage of students not-surviving/surviving 33.33 66.67 100 Percentage of students in total students 0.33 0.13 0.16
D128UM - BA Hons Fren and Germ and Span 2 0 2
D129UJ - BA Hons Humanit Amer Stds IC 1 7 8 Percentage of students not-surviving/surviving 12.5 87.5 100 Percentage of students in total students 0.33 0.44 0.42
D130UC - BA Hons Irish Studies 13 12 25
Percentage of students not-surviving/surviving 52 48 100 Percentage of students in total students 4.26 0.75 1.31
D131UJ - BA Hons Humanities Amer Stds 1 8 9
Percentage of students not-surviving/surviving 11.11 88.89 100 Percentage of students in total students 0.33 0.5 0.47
D131UM - BA Hons Intern Pol with Market 0 2 2
Percentage of students not-surviving/surviving 0 100 100 Percentage of students in total students 0 0.13 0.11
D132UC - BA Hons Irish Lang & Literature 5 27 32 Percentage of students not-surviving/surviving 15.63 84.38 100 Percentage of students in total students 1.64 1.69 1.68
D132UJ - BA Hons Humanities:English 12 29 41
Percentage of students not-surviving/surviving 29.27 70.73 100 Percentage of students in total students 3.93 1.81 2.15
D132UM - BA Hons Intern Pol with Irish 0 1 1
Percentage of students not-surviving/surviving 0 100 100 Percentage of students in total students 0 0.06 0.05
D133UC - BA Hons Irish with English 0 1 1
Percentage of students not-surviving/surviving 0 100 100 Percentage of students in total students 0 0.06 0.05
D133UJ - BA Hons Humanities:History 9 31 40
Percentage of students not-surviving/surviving 22.5 77.5 100 Percentage of students in total students 2.95 1.94 2.1
D134UM - BA Hons Intern Pol with French 1 2 3
Percentage of students not-surviving/surviving 33.33 66.67 100 Percentage of students in total students 0.33 0.13 0.16
D135UC - BA Hons Philosophy 4 7 11
Percentage of students not-surviving/surviving 36.36 63.64 100 Percentage of students in total students 1.31 0.44 0.58
D135UM - BA Hons Internat. Bus. Comm. 2 4 6
D137UC - BA Hons French DAS 1 0 1 Percentage of students not-surviving/surviving 100 0 100 Percentage of students in total students 0.33 0 0.05
D137UM - AB in Lang Business & Comput 0 9 9
Percentage of students not-surviving/surviving 0 100 100 Percentage of students in total students 0 0.56 0.47
D138UM - BA Hons Lang Business & Comput 2 9 11 Percentage of students not-surviving/surviving 18.18 81.82 100 Percentage of students in total students 0.66 0.56 0.58
D139UM - BA Hons Intern Pol with Span 0 3 3
Percentage of students not-surviving/surviving 0 100 100 Percentage of students in total students 0 0.19 0.16
D141UJ - BA Hons Humanities: Joint 15 32 47
Percentage of students not-surviving/surviving 31.91 68.09 100 Percentage of students in total students 4.92 2 2.47
D142UM – BA Hons Fre and Span and I Pol 1 0 1
Percentage of students not-surviving/surviving 100 0 100 Percentage of students in total students 0.33 0 0.05
D143UM - BA Hons Fren and Span and Mark 0 1 1
Percentage of students not-surviving/surviving 0 100 100 Percentage of students in total students 0 0.06 0.05
D144UM - BA Hons Fren and Span and Psyc 0 1 1
Percentage of students not-surviving/surviving 0 100 100 Percentage of students in total students 0 0.06 0.05
D145UC - BA Hons Combined Arts 3YR 45 235 280
Percentage of students not-surviving/surviving 16.07 83.93 100 Percentage of students in total students 14.75 14.71 14.71
D150UJ - BMus with Hons (Music) 4 25 29
Percentage of students not-surviving/surviving 13.79 86.21 100 Percentage of students in total students 1.31 1.56 1.52
D150UM - BA Hons International Politics 9 32 41
Percentage of students not-surviving/surviving 21.95 78.05 100 Percentage of students in total students 2.95 2 2.15
D151UM - BA Hons Int Pol & Psy DIS 1 1 2
Percentage of students not-surviving/surviving 50 50 100 Percentage of students in total students 0.33 0.06 0.11
D152UM - BMus Hons Music 8 50 58
D153UM - BA Hons Music with Drama 0 1 1 Percentage of students not-surviving/surviving 0 100 100 Percentage of students in total students 0 0.06 0.05
D155UC - BA Hons Applied Languages 3 26 29
Percentage of students not-surviving/surviving 10.34 89.66 100 Percentage of students in total students 0.98 1.63 1.52
D155UM - BA Hons Music with German 0 1 1
Percentage of students not-surviving/surviving 0 100 100 Percentage of students in total students 0 0.06 0.05
D156UC - BA Hons French & German(A.Lang 0 1 1 Percentage of students not-surviving/surviving 0 100 100 Percentage of students in total students 0 0.06 0.05
D156UM - BA Hons Music with Irish 0 1 1
Percentage of students not-surviving/surviving 0 100 100 Percentage of students in total students 0 0.06 0.05
D157UC - BA Hons French & Span (A.Lang) 1 6 7 Percentage of students not-surviving/surviving 14.29 85.71 100 Percentage of students in total students 0.33 0.38 0.37
D158UC - BA Hons German & Span (A.Lang) 1 0 1 Percentage of students not-surviving/surviving 100 0 100 Percentage of students in total students 0.33 0 0.05
D162UC - BA Hons Euro and Jour Publ Std 0 1 1
Percentage of students not-surviving/surviving 0 100 100 Percentage of students in total students 0 0.06 0.05
D165UC - BA Hons Mod & Cont History 9 21 30
Percentage of students not-surviving/surviving 30 70 100 Percentage of students in total students 2.95 1.31 1.58
D166UB - BA Hons American Studies 3Yr 8 10 18
Percentage of students not-surviving/surviving 44.44 55.56 100 Percentage of students in total students 2.62 0.63 0.95
D166UC - BA Hons History 8 48 56
Percentage of students not-surviving/surviving 14.29 85.71 100 Percentage of students in total students 2.62 3 2.94
D167UB - BA Hons American Studies DAS 5 4 9
D169UB - BA Hons Visual Culture 2 4 6 Percentage of students not-surviving/surviving 33.33 66.67 100 Percentage of students in total students 0.66 0.25 0.32
D170UM - BA Hons Inter Pol with Sociol 3 0 3
Percentage of students not-surviving/surviving 100 0 100 Percentage of students in total students 0.98 0 0.16
D172UC - BA Hons Film Stds and History 0 1 1
Percentage of students not-surviving/surviving 0 100 100 Percentage of students in total students 0 0.06 0.05
D173UM - BA Hons Dance with Psychology 1 0 1
Percentage of students not-surviving/surviving 100 0 100 Percentage of students in total students 0.33 0 0.05
D174UC - BA Hons Film and Jour Publ Std 0 2 2
Percentage of students not-surviving/surviving 0 100 100 Percentage of students in total students 0 0.13 0.11