Coral bioindicators of environmental conditions on coastal coral reefs
224
0
0
Full text
(2) Coral bioindicators of environmental conditions on coastal coral reefs. Thesis submitted by Timothy Fraser COOPER B.Sc. (Hons) JCU in June 2008. for the degree of Doctor of Philosophy in the School of Marine and Tropical Biology James Cook University.
(3) STATEMENT OF ACCESS. I, the undersigned author of this work, understand that James Cook University will make this thesis available for use within the University Library and, via the Australian Digital Theses network, for use elsewhere. I understand that, as an unpublished work, a thesis has significant protection under the Copyright Act and;. I do not wish to place any further restriction on access to this work. _____________________________________ Signature. ______________ Date.
(4) ELECTRONIC COPY. I, the undersigned, the author of this work, declare that the electronic copy of this thesis provided to the James Cook University Library, is an accurate copy of the print thesis submitted, within the limits of the technology available.. _______________________________ Signature. _______________ Date.
(5) STATEMENT ON SOURCES. Declaration. I declare that this thesis is my own work and has not been submitted in any form for another degree or diploma at any university or other institution of tertiary education. Information derived from the published or unpublished work of others has been acknowledged in the text and a list of references is given.. …………………………………………….. (Signature). ……………………… (Date).
(6) STATEMENT ON THE CONTRIBUTION OF OTHERS Chapter 2 is included without abstract and published as Cooper TF, Uthicke S, Humphrey C, Fabricius KE. (2007). Gradients in water column nutrients, sediment parameters, irradiance and coral reef development in the Whitsunday Islands, central Great Barrier Reef. Estuarine, Coastal and Shelf Science 74: 458-470. The data was collected by all authors during field work undertaken over a 2-year period from 2004 to 2006. S Uthicke collected, processed and wrote the sediment sections. TF Cooper compiled and analysed the water quality and irradiance data, and wrote the manuscript. The manuscript (and this chapter) was submitted after editorial contributions from all co-authors. Chapter 3 is included without abstract as Cooper TF, Ulstrup KE. (in review). Mesoscale variation in the photo-physiology of a coastal coral on the Great Barrier Reef. Marine Biology. TF Cooper collected and analysed the data, and wrote the manuscript. KE Ulstrup processed the data and derived parameters from the rapid light curves. The manuscript (and this chapter) was submitted after editorial contributions from the co-author. Chapter 4 is included without abstract as Cooper TF, Slivkoff M. (in prep). Relationship among coral reflectance, chlorophyll a concentration and perceived brightness of scleractinian corals. TF Cooper collected and analysed the data, and wrote the manuscript. M Slivkoff processed the spectral reflectance data. TF Cooper and M Slivkoff designed and built the reflectance chamber. The manuscript (and this chapter) has been prepared after editorial contributions from the co-author. Chapter 6 is included without abstract and published as Cooper TF, Ridd PV, Ulstrup KE, Humphrey C, Slivkoff M, Fabricius KE. (2008). Temporal dynamics in coral bioindicators for water quality on coastal coral reefs of the Great Barrier Reef. Marine and Freshwater Research 59: 703-716. TF Cooper collected and analysed the data. PV Ridd and C Humphrey assisted with logger deployment and processing of physical and water quality samples. KE Ulstrup assisted with processing of coral samples and M Slivkoff processed the satellite image. The manuscript (and this chapter) was submitted after editorial contributions from all co-authors. Chapter 7 is included without abstract and published as Cooper TF, De’ath G, Fabricius KE, Lough JM. (2008). Declining coral calcification in massive Porites in two nearshore regions of the northern Great Barrier Reef. Global Change Biology 14: 529-538. The samples were collected by TF Cooper and KE Fabricius. TF Cooper processed the coral slices and wrote the manuscript. JM Lough supervised sample processing and extracted the growth variables from the coral slices. The statistical analyses were done by G De’ath. The manuscript (and this chapter) was submitted after editorial contributions from all co-authors..
(7) Acknowledgments This study was supported by funding from the Australian Institute of Marine Science (AIMS), the Cooperative Research Centre (CRC) for Coral Reefs and CRC Rainforest to the Catchment to Reef Program, and the Reef and Rainforest Research Centre through the Marine and Tropical Sciences Research Facility. I am grateful to my supervisor Dr Katharina Fabricius for providing the opportunity to undertake this research and for the invaluable guidance and support that made this study possible. I am also grateful for the stimulating discussions with Dr Glenn De’ath that shaped the statistical techniques used in this study. I thank Prof. Michael Kingsford and Dr Ken Anthony at James Cook University (JCU) for advice on various aspects of the study. I was fortunate to work alongside many highly regarded scientists at AIMS and I thank Dr David Barnes, Dr Terry Done, Dr Janice Lough and Dr Eric Wolanski for giving of their time and ideas. In the Water Quality and Ecosystem Health Team, I thank Craig Humphrey, Dr Anke Klüter, Dr Britta Schaffelke and Dr Sven Uthicke who made my time at AIMS both enjoyable and productive. I thank Dr Peter Ridd at JCU who provided the light and turbidity loggers used in this project. At the CRC Reef, I was grateful for the support of Dr David Williams and Tim Harvey. For assistance with laboratory techniques, field work and cycling (or combinations thereof), I would like to thank Lewis Anderson, Dr Ray Berkelmans, Stephen Boyle, Neal Cantin, Deborah Frietas, Dr Miles Furnas, Joe Goiffre, Tim Hyndes, Niall Jeeves, Alison Jones, Nadine Koch, the staff and guests of Long Island, Eric Matson, Katharina McGuire, Tony McKenna, Dr David McKinnon, Dr Andrew Negri, Eyvone Sawall, Melanie Shaw, Christopher Shelbourn, Michele Skuza, Matt Slivkoff, Dr Adam Smith, Paola Spicker, Danika Tager, Damian Thomson, Lindsay Trott, Jake van Oosterom, Dr Madeleine van Oppen, Miriam Weber, Margaret Wright and Tracie Wright. Thanks to the crew of the RV Lady Basten for logistical support, engineering wisdom and great food in the field. Thanks to Dr Marcus Lincoln Smith for mentoring me through my early years in science and for continued personal support and encouragement to pursue a PhD. A special thanks to Karin Ulstrup whose constructive comments and encouragement improved the content of this thesis. Finally, I acknowledge the support provided by friends and family over the past few years, in particular Truda Cooper, whose strength in adversity was a source of inspiration throughout this project. This work is dedicated to my grandparents who were instrumental in developing my interest of the ocean..
(8) Publications Peer-reviewed journal articles associated with this thesis Cooper TF, Ulstrup KE. (in review). Mesoscale variation in the photo-physiology of a coastal coral on the Great Barrier Reef. Marine Biology. Cooper TF, Ridd PV, Ulstrup KE, Humphrey C, Slivkoff M, Fabricius KE. (2008). Temporal dynamics in coral bioindicators for water quality on coastal coral reefs of the Great Barrier Reef. Marine and Freshwater Research 59: 703-716 Cooper TF, De’ath G, Fabricius KE, Lough JM. (2008). Declining coral calcification in massive Porites in two nearshore regions of the northern Great Barrier Reef. Global Change Biology 14: 529-538 Cooper TF, Uthicke S, Humphrey C, Fabricius KE. (2007). Gradients in water column nutrients, sediment parameters, irradiance and coral reef development in the Whitsunday Islands, central Great Barrier Reef. Estuarine, Coastal and Shelf Science 74: 458-470 Peer-reviewed journal articles relevant but not associated with this thesis Humphrey C, Weber M, Lott C, Cooper TF, Fabricius KE. (2008). Effects of different types of sediment, dissolved inorganic nutrients and salinity on fertilisation and embryo development in the coral Acropora millepora (Ehrenberg, 1834). Coral Reefs doi 10.1007/s00338-008-0408-1 Wolanski E, Fabricius KE, Cooper TF, Humphrey C. (2008). Wet season fine sediment dynamics on the inner shelf of the Great Barrier Reef. Estuarine, Coastal and Shelf Science 77: 755-762 Fabricius KE, De’ath G, Puotinen ML, Done TJ, Cooper TF, Burgess, SC. (2008). Disturbance gradients on inshore and offshore coral reefs caused by a severe tropical cyclone. Limnology and Oceanography 53: 690-704 Conference abstracts Cooper TF, Slivkoff M, Fabricius KE. (2006). Coral colour responds to changes in water quality: validation of a bioindicator using reflectance spectrometry. International Society for Reef Studies: European Meeting, 19 – 22 September 2006, Bremen, Germany..
(9) Conference abstracts contd. Cooper TF, Slivkoff M, Fabricius KE. (2006). Coral colour responds to changes in water quality: validation of a bioindicator using reflectance spectrometry. Australian Marine Sciences Association, 9 – 13 July 2006, Cairns, Australia. Ron Kenny Prize for Highly Commended student oral presentation. Cooper TF, Fabricius KE, Humphrey C, Neale S. (2005). Coral based indicators of the effects of water quality on nearshore reefs of the Great Barrier Reef. Rainforest meets Reef: Joint conference of CRC Reef and Rainforest CRC, 22 – 24 November 2005, Townsville, Australia..
(10) “I thought of that while riding my bicycle” ― Albert Einstein, on the theory of relativity..
(11) i. CONTENTS Contents. i. List of Tables. iv. List of Figures. vi. Abstract. x. Chapter 1.0. General introduction, review of literature and thesis outline. 1. 1.1. General Introduction. 2. 1.2. Review of literature. 3. 1.2.1 Effects of water quality on corals 1.2.1.1 Nutrient availability 1.2.1.2 Sedimentation 1.2.1.3 Turbidity and light attenuation 1.2.2 Characteristics of suitable indicators 1.2.3 Indicators and indices in other aquatic ecosystems 1.2.4 Indicators of the condition of coastal coral reefs 1.2.4.1 Colony indicators 1.2.4.2 Population indicators 1.2.4.3 Community indicators. 1.3. Thesis outline. 3 3 4 5 5 11 12 12 16 18. 21. Chapter 2.0 Gradients in water column nutrients, sediment parameters, irradiance and coral reef development in the Whitsunday Islands, central Great Barrier Reef 27 2.1. Introduction. 28. 2.2. Materials and methods. 29. 2.2.1 2.2.2 2.2.3 2.2.4 2.2.5 2.2.6. 2.3 2.3.1 2.3.2 2.3.3 2.3.4. 2.4 2.4.1 2.4.2 2.4.3 2.4.4. Study area Water column Sediments Irradiance Maximum depth of coral reef development Statistical analysis. Results Water column Sediments Irradiance Maximum depth of coral reef development. Discussion Water column Sediments Irradiance Maximum depth of coral reef development. 29 30 31 32 33 33. 35 35 41 42 43. 48 48 49 50 50.
(12) ii. Chapter 3.0 Spatial variation in the photo-physiology of a coastal coral along an environmental gradient of the Great Barrier Reef 53 3.1. Introduction. 54. 3.2. Materials and methods. 56. 3.2.1 3.2.2 3.2.3 3.2.4 3.2.5 3.2.6 3.2.7. 3.3 3.3.1 3.3.2 3.3.3 3.3.4 3.3.5. 3.4 3.4.1 3.4.2 3.4.3 3.4.4. Study area and sampling design Environmental gradient Relative PAR-absorptivity Minimum fluorescence and maximum quantum yield Rapid light curves Relative non-photochemical quenching and relative excitation pressure Statistical analyses. Results Environmental gradient Relative PAR-absorptivity Minimum fluorescence and maximum quantum yield Rapid light curves Relative non-photochemical quenching and relative excitation pressure. Discussion Relative PAR-absorptivity Minimum fluorescence and maximum quantum yield Rapid light curves Relative non-photochemical quenching and relative excitation pressure. 56 57 57 58 58 59 60. 61 61 61 62 63 64. 70 70 72 72 73. Chapter 4.0 Relationship among coral reflectance, chlorophyll a concentration and perceived brightness of scleractinian corals 75 4.1. Introduction. 76. 4.2. Materials and methods. 77. 4.2.1 4.2.2 4.2.3. Reflectance measurements Determination of chlorophyll a Statistical analyses. 78 80 80. 4.3. Results. 80. 4.4. Discussion. 86. Chapter 5.0 Spatial variation of coral bioindicators along an environmental gradient of the Great Barrier Reef 90 5.1. Introduction. 91. 5.2. Materials and methods. 92. 5.2.1 5.2.2 5.2.3 5.2.4 5.2.5. 5.3. Field study area and sampling design Laboratory experiments Field manipulative experiment Physiological analyses Statistical analyses. Results. 5.3.1 Field study 5.3.2 Laboratory experiments 5.3.2.1 Experiment 1 5.3.2.2 Experiment 2. 92 93 94 96 96. 97 97 99 100 102.
(13) iii. 5.3.3. 5.4. Field manipulative experiment. Discussion. 107. 111. Chapter 6.0 Temporal dynamics in coral bioindicators for water quality on a coastal coral reef of the Great Barrier Reef 116 6.1. Introduction. 117. 6.2. Materials and methods. 118. 6.2.1 6.2.2 6.2.3 6.2.4 6.2.5 6.2.6. 6.3. Study area and sampling design Weather data Turbidity and benthic irradiance Water column nutrients Coral indicators Statistical analyses. Results. 6.3.1 6.3.2 6.3.3 6.3.4. 6.4. 118 119 120 121 122 122. 123. Weather data Turbidity and benthic irradiance Water column nutrients Coral indicators. Discussion. 123 128 130 137. 150. Chapter 7.0 Declining coral calcification in massive Porites in two nearshore regions of the northern Great Barrier Reef 154 7.1. Introduction. 155. 7.2. Materials and methods. 156. 7.2.1 7.2.2 7.2.3 7.2.4. Study area and sampling design Sclerochronology Sea surface temperature Statistical analyses. 156 156 157 158. 7.3. Results. 159. 7.4. Discussion. 163. Chapter 8.0 8.1. General discussion, conclusions and future research. Selecting candidate coral indicators. 8.1.1 8.1.2 8.1.3 8.1.4 8.1.5. Symbiont photo-physiology Colony brightness of massive Porites Skeletal and tissue growth of massive Porites Density of macro-bioeroders in living Porites Maximum depth of coral reef development. 167 168 173 173 174 175 176. 8.2. Conclusions. 176. 8.3. Future research. 180. References. 182.
(14) iv. LIST OF TABLES Table 1.1. Summary of criteria for selection of indicators to assess effects of stressors on corals and coral communities. Modified from Jones and Kaly (1996), Erdmann and Caldwell (1997) and Jameson et al. (1998). 8 Table 1.2. Examples of studies examining colony, population and/or community variables on coral reefs and reported responses to various stressors. 23 Table 2.1. Summary of mean water column, sediment and irradiance parameters (± standard error) at each of the 12 study locations in the Whitsunday Islands. Data for each location are averaged over sampling events from August 2004 to February 2006. 36 Table 2.2. Summary of analyses comparing water column, sediment and irradiance parameters with distance from the coast and among times of sampling. Data are log2 transformed, * denotes terms that were eliminated at P >0.25. 38 Table 2.3. Total daily irradiance (mol photons m-2) calculated from Odyssey PAR loggers deployed at 3 m and 6 m depth at three locations (Lindeman, Long and Deloraine Islands) on two occasions in the Whitsunday Islands. Data for Hardy Reef are for surface irradiance, supplied from the AIMS weather station (http://www.aims.gov.au/pages/facilities/weatherstations/weather-index.html). Numbers in parentheses are % of surface irradiance at Hardy Reef. Mean ± standard error. 44 Table 2.4. Pearson correlations between maximal depth coral reef development and environmental variables averaged for each time of sampling in the Whitsunday Islands. Abbreviations: Max depth = maximum depth of reef development; Chl a = chlorophyll a, PN = particulate nitrogen, PP = particulate phosphorus, POC = particulate organic carbon, TSS = total suspended solids, DIN = dissolved inorganic nitrogen, DIP = dissolved inorganic phosphorus, DON = dissolved organic nitrogen, DOP = dissolved organic phosphorus, OD = optical depth, Sed value = Munsell colour value, Sed org C = sediment organic carbon, Sed pha = sediment phaeophytin, Sed inorg C = sediment inorganic carbon, Fine grains = %grains <63 μm. Bold: P <0.05. 45 Table 2.5. Estimates of light attenuation coefficients and percent of surface irradiance resulting in light limitation of zooxanthellate corals on reefs in the Whitsunday Islands. Kd (PAR) averaged over three times of sampling. Data are presented as means ± standard error (SE). Maximal depth of coral reef development is presented as depth below lowest astronomical tide. Ez derived from Equation 1. 47 Table 3.1. Summary of mean photo-physiological variables (± standard error, n=6) of Pocillopora damicornis at each of the 7 study locations in the Whitsunday Islands, January 2007.. 67. Table 3.2. Summary of two factor ANOVAs comparing photo-physiological variables of Pocillopora damicornis among reefs and between depths in the Whitsunday Islands. For post hoc tests, results are presented in ascending order. Abbreviations: R = Repulse Island; L = Lindeman Island; Lo = Long Island; D = Dent Island; Hs = Haslewood Island; H = Hook Island; Dl = Deloraine Island. 68 Table 3.3. Summary of linear models testing relationships between photo-physiological variables of Pocillopora damicornis and the water quality index.. 69. Table 4.1. Summary of linear models testing relationships between (a) coral reflectance % (R675 nm) and (b) concentrations of chlorophyll a (log2 transformed, μg cm-2), with the colour chart for all species. 82 Table 4.2. Summary of analyses comparing the influence of shadows due to coral morphology produced by differing illumination angles on coral reflectance. 84.
(15) v. Table 4.3. Summary of linear models testing relationships between coral reflectance % (R675 nm) and concentrations of chlorophyll a (μg cm-2) among different coral species. 84 Table 4.4. Summary of analyses comparing (a) homogeneity of slopes and (b) differences among intercepts of the relationship between coral reflectance % (R675 nm) and concentrations of chlorophyll a (log2 transformed, μg cm-2) among different coral species. 85 Table 5.1. Summary of experimental treatments used to test hypotheses about the effects of water quality on colony brightness.. 94. Table 5.2. Summary of linear models comparing indicators in (a–d) Pocillopora damicornis and (e–i) massive Porites with the Water Quality Index between two depths (shallow and deep) in the Whitsunday Islands. 98 Table 5.3. Summary of ANOVAs comparing colony parameters in Porites lobata nubbins after 56 d exposure to different treatments of nutrients and irradiance (Tank Experiment 1). * denotes term eliminated at P >0.25. For post hoc tests, means (± SE) are untransformed and in ascending order. Underlined terms were not significantly different from each other. Abbreviations: FSW = filtered seawater, SPM = suspended particulate matter. 104 Table 5.4. Summary of ANOVAs comparing concentrations of chlorophyll a and spectral reflectance among experimental treatments for coral nubbins transplanted along an environmental gradient in the Whitsunday Islands. Inner nubbins refers to nubbins sourced from the nearshore islands (Long and Lindeman Islands); outer nubbins refers to nubbins sourced from the outer islands (Deloraine and Edward Islands) of the Whitsunday Islands. 109 Table 6.1. Summary of four factor ANOVAs comparing water quality variables between years and seasons, and among locations on the GBR. * denotes terms that were eliminated at P >0.25. For post hoc tests, means (± SE) are untransformed and in ascending order. Underlined means were not significantly different from each other. Abbreviations: HB = Horseshoe Bay; DR = Davies Reef; BR = Broadhurst Reef. 132 Table 6.2. Summary of four factor ANOVAs comparing physiological variables of (a – e) Pocillopora damicornis and (f – g) massive Porites between years and seasons, and among locations on the GBR. * denotes terms that were eliminated at P >0.25. 139 Table 6.3. Summary of post hoc tests of physiological variables of Pocillopora damicornis and massive Porites between years and seasons and among locations on the GBR. Means (± SE) are untransformed and in ascending order. Underlined terms were not significantly different from each other. Abbreviations: HB = Horseshoe Bay, DR = Davies Reef, BR = Broadhurst Reef. 141 Table 6.4. Summary of analyses for model selection to examine the relationship between physiological measures of P. damicornis (a – e) and massive Porites (f – g) with physical variables (predictors). Predictors selected by dropping terms from the full model based on calculation of Akaike Information Criterion (AIC). Data for sea surface temperature (SST), benthic irradiance and turbidity averaged over the 14 d period preceding the site visit. 145 Table 6.5. Summary of ANOVAs comparing physiological measures of P. damicornis (a – e) and massive Porites (f – g) among locations and with environmental variables. 146 Table 7.1. The numbers of colonies observed by (a) year and (b) reef shows the imbalance in the data due to fewer colonies having bands in earlier years. 159 Table 7.2. Cross-validated estimates of smoothness (degrees of freedom) of trends in years and sea surface temperature for skeletal density, annual extension and calcification. Estimates were based on linear mixed effects models. 159 Table 8.1. Assessment framework for identifying indicators of the effects of changes in water quality on coastal corals of the GBR. Indicators are assessed against the criteria defined in Chapter 1.2.2. Rank denotes the sum of positive scores when assessed against each criterion and determines the level of recommendation. Abbreviations: Med. = Medium; Rec. = Recommendation. 169.
(16) vi. LIST OF FIGURES Fig. 1.1. Response of a hypothetical indicator to a disturbance (dark grey areas represent the disturbance in question; light grey areas represent other disturbances). A suitable indicator must detect differences between a disturbed state (solid line) and reference states (dashed lines). The situations described in a), b) c) and d) would be appropriate for inclusion into a monitoring program. 10 Fig. 2.1. (a) Satellite image (Landsat 5 TM) of the Whitsunday Islands showing a flood plume emerging from the Proserpine and O’Connell Rivers, 28th January 2005. Areas of elevated suspended solids are visible near the mouths of the rivers, with areas of increased phytoplankton abundance indicative of nutrient enrichment that extend through the islands. Red circles indicate some of the sampling locations; (b) Map of study locations in the Whitsunday Islands of the Great Barrier Reef, Australia. Dashed area represents area shown in Fig. 1a. Image courtesy K. Rohde (Department of Natural Resources and Water, Queensland Government). 34 Fig. 2.2. Summary of the relationships between each of the water column, sediment and irradiance variables and nearest distance from the coast. Samples collected from five sampling events between August 2004 and August 2006. Response variables are log2 transformed, except for the Water Quality Index. Abbreviations: TSS = total suspended solids, PN = particulate nitrogen, PP = particulate phosphorus, POC = particulate organic carbon, DIN = dissolved inorganic nitrogen, DIP = dissolved inorganic phosphorus, DON = dissolved organic nitrogen, DOP = dissolved organic phosphorus, Pha = phaeophytin. Water Quality Index (WQI) refers to the sum of z-scores calculated from z transformation of each of the water column and irradiance variables. Symbols represent each time of sampling: □ August 2004; ○ August 2005; + January 2006; × February 2006; ● August 2006. 39 Fig. 2.3. Principal components analysis of water column and irradiance variables sampled at the Whitsunday Islands for all sampling events. Chl a=chlorophyll a, Pha = Phaeophytin, TSS = total suspended solids, PN = particulate nitrogen, PP = particulate phosphorus, POC = particulate organic carbon, DIN = dissolved inorganic nitrogen, DIP = dissolved inorganic phosphorus, DON = dissolved organic nitrogen, DOP = dissolved organic phosphorus, Si = silicate, Secchi = Secchi depth, OD = optical depth. WQ Index refers to the index calculated for the water quality variables. Distance to coast is determined as nearest distance to the Australian mainland. The latter two parameters, indicated by dashed lines, are superimposed on the biplot. 40 Fig. 2.4. Principal components analysis of sediment variables at the Whitsunday Islands. Chl a = chlorophyll a, Pha = phaeophytin, N = nitrogen, IC = inorganic carbon, OC = organic carbon, Sed value = Munsell colour value, Grain = average grain size, fine grains = sediments<63 μm. WQ Index refers to the index calculated for the water quality variables. Distance from coast is determined as nearest distance from the Australian mainland. The latter two parameters are indicated by dashed lines. 42 Fig. 2.5. Relationship between maximal depth of coral reef development and the water quality index for the Whitsunday Islands. Dashed lines are ± 1 standard error (SE). 46 Fig. 3.1. Map of study locations in the Whitsunday Islands, Great Barrier Reef.. 60. Fig. 3.2. Relationship between relative PAR-absorptivity of Pocillopora damicornis and the water quality index (WQI), where □ = shallow depth (3 m) and ● = deep depth (6 m). The WQI is determined by the sum of z-scores calculated from thirteen irradiance and water column nutrient variables collected between August 2004 and January 2007. A low WQI indicates high irradiance, low nutrient conditions whereas a high WQI indicates low irradiance, nutrientenriched conditions. Arrow indicates direction of change along the environmental gradient from turbid nearshore to clear-water outer locations. Linear regression ± 1 standard error (dashed lines). 62.
(17) vii. Fig. 3.3. Relationship between (a) minimum fluorescence (F0) and (b) maximum quantum yield (Fv /Fm), respectively, of Pocillopora damicornis and the water quality index (WQI) derived for the Whitsunday Islands. □ = shallow depth (3 m), ● = deep depth (6 m). Linear regression ± 1 standard error (dashed lines). 63 Fig. 3.4. Relationship between (a) maximum apparent photosynthetic rate (PSmax), (b) light utilisation coefficient (α) and (c) minimum saturating irradiance (Ek), respectively, of Pocillopora damicornis and the water quality index (WQI) derived for the Whitsunday Islands. □ = shallow depth (3 m), ● = deep depth (6 m). Linear regression ± 1 standard error (dashed lines). 65 Fig. 3.5. Relationship between (a) relative non-photochemical quenching (rNPQ241) and relative excitation pressure over PSII (rQ241), respectively, of Pocillopora damicornis and the water quality index (WQI) derived for the Whitsunday Islands. □ = shallow depth (3 m), ● = deep depth (6 m). Linear regression ± 1 standard error (dashed lines). 66 Fig. 3.6. Relative PAR-absorptivity images of Pocillopora damicornis collected at shallow (3 m) and deep (6 m) at seven locations along the environmental gradient. Arrow indicates direction of change along the environmental gradient from turbid nearshore (high WQI) to clear-water outer locations (low WQI).. 71. Fig. 4.1. Diagrammatic representation of the coral reflectance measuring chamber. A piece of coral is placed on an adjustable platform and positioned near the detector. A fibre optic cable connects to an Ocean Optics USB 2000 spectrometer, which is connected to a computer. 79 Fig. 4.2. Relationship between (a) coral reflectance % (R675 nm) and (b) the concentration of chlorophyll a (log2 transformed, μg cm-2), and the colour chart for Acropora millepora (black U), Pocillopora damicornis (red +), Stylophora pistillata (blue ○), Turbinaria reniformis (grey □) and Porites lobata (brown V). 83 Fig. 4.3. Relationship between coral reflectance % (R675 nm) and concentrations of chlorophyll a (log2 transformed, μg cm-2). Symbols: Acropora millepora (black U), Pocillopora damicornis (red +), Stylophora pistillata (blue ○), Turbinaria reniformis (grey □) and Porites lobata (brown V). 85 Fig. 5.1. Map of study locations to examine spatial variation of colony indicators of Pocillopora damicornis and massive Porites in the Whitsunday Islands. Manipulative experiment involved transplanting small nubbins of Porites among Long and Lindeman Islands (inner), and Deloraine and Edward Islands (outer). 95 Fig. 5.2. Relationships between indicators in (a–d) Pocillopora damicornis, (e–i) massive Porites spp. between shallow (□) and deep (●) with a water quality index (WQI) for the Whitsunday Islands. Dashed lines ± standard error (SE). WQI derived from five surveys between August 2004 and August 2006; large positive numbers correspond to elevated water column nutrients and low irradiance on nearshore reefs, negative numbers correspond to low water column nutrients and high irradiance on outer islands and mid-shelf reefs. 99 Fig. 5.3. Mean concentration (± SE) of water column parameters in Experiment 1 to examine response of Porites lobata nubbins exposed to suspended particulate matter (values averaged over 56 d). (a – d) dissolved nutrients (n=20) and (e – f) particulate nutrients and suspended solids (n=40). Treatments: FSW = filtered seawater (white bars) and SPM = suspended particulate matter (grey bars). * denotes statistical significance at P <0.05. Abbreviations: DIN, dissolved inorganic nitrogen; DIP, dissolved inorganic phosphorus; DON, dissolved organic nitrogen; DOP, dissolved organic phosphorus; PN, particulate nitrogen; PP, particulate phosphorus; POC, particulate organic carbon; TSS, total suspended solids. 101 Fig. 5.4. Time series of mean concentration (± SE, n=8) of water column parameters in Experiment 2 to examine response of Porites lobata nubbins exposed to suspended particulate matter. Treatments: FSW = filtered seawater (grey lines) and SPM = suspended particulate matter (black lines). Abbreviations: DIN, dissolved inorganic nitrogen; DIP, dissolved inorganic.
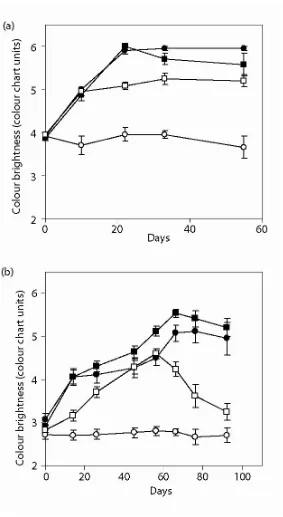
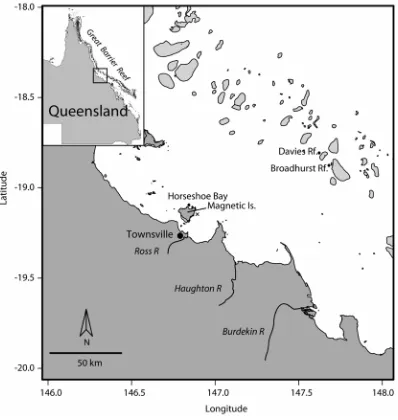
(18) viii. phosphorus; PN, particulate nitrogen; PP, particulate phosphorus; POC, particulate organic carbon, TSS, total suspended solids. 103 Fig. 5.5. (a) Tank Experiment 1: Response of mean coral brightness (± SE, n=12) of Porites lobata nubbins exposed to different treatments of SPM and irradiance. (b) Tank Experiment 2: Recovery of colony brightness (± SE, n=12) of Porites lobata nubbins following exposure to different treatments of nutrient and SPM. Symbols: circles = filtered seawater; squares = SPM; open symbols = unshaded; dark symbols = shaded. 105 Fig. 5.6. Mean values (± SE, n=12) of (a) tissue thickness, (b) concentration of chlorophyll a and (c) density of symbionts in Porites lobata nubbins exposed to different treatments of SPM and irradiance (Tank Experiment 1). FSW = filtered seawater; SPM = suspended particulate matter. Symbols: black bars = shaded; white bars = unshaded; grey bars = unshaded + SPM. * denotes statistical significance at P <0.05. 106 Fig. 5.7. Mean brightness of colour (± SE) of coral nubbins sourced from (a) inner zone, and (b) outer zone, and transplanted along an environmental gradient in the Whitsunday Islands. Colour brightness measured with a Coral Health Monitoring Chart (Siebeck et al. 2006). Symbols: ● undisturbed; ○ cored; ▲ moved; □ translocated deep to shallow; ■ translocated shallow to deep; U translocated reef; U transplant inner to outer/outer to inner; transplant inner shallow to outer deep/outer shallow to inner deep; transplant inner deep to outer shallow/outer deep to inner shallow. 108 Fig. 5.8. Mean concentration of chlorophyll a (μg cm-2, ± SE) for coral nubbins sourced from (a) inner zone, and (b) outer zone, and transplanted along an environmental gradient in the Whitsunday Islands. Abbreviations: DS = deep to shallow; SD = shallow to deep; IO = inner to outer; OI = outer to inner; transplant treatments are combinations of these. * denotes statistical significance at P <0.05. 110 Fig. 5.9. Mean reflectance (± SE) of coral nubbins sourced from (a) inner zone, and (b) outer zone, and transplanted along an environmental gradient in the Whitsunday Islands. Abbreviations: DS = deep to shallow; SD = shallow to deep; IO = inner to outer; OI = outer to inner; transplant treatments are combinations of these. * denotes statistical significance at P <0.05. 111 Fig. 6.1. Map of study locations at Horseshoe Bay on Magnetic Island (coastal) and Davies and Broadhurst Reefs (mid-shelf). U AIMS weather station in Cleveland Bay. 120 Fig. 6.2. MODIS-aqua satellite image of a flood event on the Great Barrier Reef taken 10th February 2007. Red line shows study area in Fig.1, red dots indicate study locations. Image downloaded from Ocean Colour Web (Feldman and McClain 2007) and processed by SeaDAS (Baith et al. 2001). Image courtesy M Slivkoff. 125 Fig. 6.3. Sea surface temperature (°C, solid line) and monthly mean (28 d ± SE) total daily irradiance (mol photons m-2 d-1) at the surface (○) recorded by an automated weather station, and benthic irradiance (●), recorded at (a) Horseshoe Bay and (b) Davies Reef. Gaps in the time-series are missing data due to instrument malfunction. 126 Fig. 6.4. (a) Turbidity (NTU), (b) benthic irradiance (μmol photons m-2 s-1), (c) wind speed (m s-1) and (d) total monthly rainfall during study. (a) and (b) recorded by a logger at a shallow depth (2 m below LAT) on the fringing reef at Horseshoe Bay, (c) recorded at by Cleveland Bay AWS. Gaps in the time-series during Dry Season of Year 1 for (a) and (b), and Wet Season of Year 1 for (c), are missing data due to instrument malfunction. Dashed line denotes time series shown in Fig. 6.5. 127 Fig. 6.5. (a) Turbidity (NTU), (b) benthic irradiance (μmol photons m-2 s-1) and (c) wind speed (m s-1) recorded during the flood event in February 2007. Arrow indicates the commencement of major flooding in the Haughton River. A peak level of 3.8 m was recorded above the Burdekin Falls Dam spillway on 4th February 2007 (Bureau of Meteorology 2007). 129.
(19) ix. Fig. 6.6. Relationship between (a) benthic irradiance at noon and turbidity, and (b) the attenuation coefficient for noon downward irradiance (Kd), corrected for tide and solar zenith angle, and turbidity recorded by a logger deployed at 2 m depth at Horseshoe Bay between May 2005 and May 2007. Dashed lines are 95% confidence intervals. 131 Fig. 6.7. Mean concentrations of water column (a) chlorophyll a (μg L-1), (b) particulate nitrogen (μmol L-1), (c) particulate phosphorus (μmol L-1), (d) particulate organic carbon (μmol L-1), (e) dissolved inorganic nitrogen (μmol L-1), (f) dissolved inorganic phosphorus (μmol L-1), (g) dissolved organic nitrogen (μmol L-1), (h) dissolved organic phosphorus (μmol L-1) sampled at Horseshoe Bay (●), and Davies (□) and Broadhurst Reefs (U). 136 Fig. 6.8. Principal components biplot of physiological variables of P. damicornis grouped by (a) locations: Horseshoe Bay (dark grey) and mid-shelf reefs (light grey); and (b) seasons: Dry Season of Year 1 (light grey), and Wet Season of Year 1 and both Dry and Wet Season of Year 2 (dark grey). Environmental variables are over-laid on the plot. Abbreviations: WQI = water quality index, SST = sea surface temperature. Data for benthic irradiance, turbidity and SST are 14 d averages for time preceding each sampling event. 138 Fig. 6.9. Summary of mean (± SE) (a) symbiont density (cells cm-2), (b) chlorophyll a (μg cm-2), (c) chlorophyll a symbiont cell-1 (pg cell-1), (d) skeletal density (g cm-3), (e) colony brightness of P. damicornis, and (f) colony brightness, (g) density of macro-bioeroders of Porites sampled at each of Horseshoe Bay (●), and Davies (□) and Broadhurst Reefs (U). 143 Fig. 6.10. Partial residual plots showing the estimated dependencies (± 1 standard error) of symbiont density, concentration of chlorophyll a, chlorophyll per symbiont, skeletal density and colony brightness of P. damicornis on (a) location, (b) sea surface temperature, (c) turbidity, (d) benthic irradiance and (e) water quality index. Each partial effects plot is adjusted for the effects of the other five explanatory variables. 147 Fig. 6.11. Partial residual plots showing the estimated dependencies (± 1 standard error) of the density of macro-bioeroders and colony brightness of massive Porites on (a) location, (b) sea surface temperature, (c) turbidity, (d) benthic irradiance and (e) water quality index. Each partial effects plot is adjusted for the effects of the other five explanatory variables. 149 Fig. 7.1. Study sites for sampling of colonies of massive Porites on the Great Barrier Reef. Hay and Hannah Islands in the Far Northern Region, High and Kent Islands in the Northern Region of the GBR. 157 Fig. 7.2. Temporal profiles for skeletal density, annual extension and calcification rate over years. The red lines indicate individual corals and the black lines indicate the mean profiles. The variation of annual extension and calcification are large (coefficient of variation, CV = 30.5% and 30.3% respectively) compared with skeletal density (CV = 9.1%). 160 Fig. 7.3. Partial effects plots showing the estimated dependencies (with 95% confidence intervals) of skeletal density, annual extension and calcification on (a) year, (b) sea surface temperature and (c) reef. Hannah and Hay Island are in the Far Northern Region, High and Kent Island in the Northern Region of the Great Barrier Reef. Each partial effects plot is adjusted for the effects of the other two explanatory variables. 161 Fig. 7.4. (a) X-ray of a coral slice showing a 33-year growth record for a massive Porites from Kent Island in the Northern Region of the Great Barrier Reef, (b) mean annual sea surface temperature for the Northern Region over the same period and (c) calcification rate of the colony. Dashed lines are 95% confidence intervals. 162 Fig. 8.1. Conceptual model of coral measures to indicate increasing exposure to the key components of water quality. Grey boxes indicate differences in response of the indicator depending on the type of stressor.. 178.
(20) x. ABSTRACT Reversing the decline in water quality is a key priority for the protection of the Great Barrier Reef (GBR). Strategies to improve the water quality of the GBR include conservation of riparian zones and the adoption of ecologically sustainable practices in the catchments. The implementation of these strategies requires feedback to resource managers and the community through monitoring programmes aimed at detecting biological responses to changes in water quality. This thesis investigates a range of coral indicators at different spatial and temporal scales and identifies those most suitable for inclusion into a toolbox for monitoring the condition of coastal coral reefs on the GBR. The approach combines in situ studies of coral indicators in different regions and environmental gradients on the GBR with controlled manipulative experiments exposing corals to differing water quality to examine causality of correlations observed in the field. An environmental gradient was identified in the Whitsunday Islands where water column variables (especially chlorophyll a, total suspended solids, particulate organic carbon and particulate nutrients) and irradiance variables (Secchi and optical depth) differed significantly from nearshore to the outer islands. For example, mean concentrations of chlorophyll a were up to 1.9 times greater at nearshore (Repulse Island; RI: 0.59 ± 0.12 μg L-1 mean ± SE) compared with outer islands (Edward Island; EI: 0.31 ± 0.06 µg L-1) averaged over five sampling events from 2004 to 2006, whereas mean Secchi depth was approximately 3 times lower at nearshore (RI: 4.0 ± 0.8 m) than outer locations (EI: 15.3 ± 3.3 m). Some of the coral indicators showed significant relationships with a water quality index (WQI) derived for the Whitsunday Islands. Responses of photo-physiological measures of Symbiodinium associated with Pocillopora damicornis along the gradient were consistent with patterns of light acclimatisation and suggested deep corals (i.e. below 5 – 6 m depth) on nearshore reefs in the Whitsunday Islands are lightlimited. Both colony brightness and tissue thickness of massive Porites spp., and the maximum depth of reef building corals, increased from nearshore to outer locations along the gradient. Similarly, a 50-fold decrease in the density of macro-bioeroders in massive Porites from nearshore to outer locations was indicative of increased particle loads on the nearshore reefs. The data of the maximum depth limit for coral reef development at locations where suitable settlement substrata were available suggest that the absolute minimum of light required for a coral reef to persist is in the range of 6 – 8 % of surface irradiance in the Whitsunday Islands. The model that color brightness of corals responded to changes in water quality was validated with manipulative experiments in the laboratory and by transplantation of small nubbins along the environmental gradient. The experiments showed nubbins of massive Porites became darker, i.e. concentrations of pigments increased, within 20 – 40 days of exposure to elevated nutrients and.
(21) xi. reduced irradiances compared with corals kept in filtered sea water and unshaded conditions. The response in colony brightness was consistent with other studies of photo-acclimatisation to enhanced nutrients and light limitation. However, a 2.5-fold decrease in symbiont density of P. damicornis during the wet compared with the dry season, which in turn influenced colony brightness, was related strongly to seasonal changes in sea surface temperature (SST). Thus, effects of seasonal variation of a range of environmental parameters need to be considered if physiological measures such as colony brightness are used in water quality monitoring programmes. The simultaneous in situ measurement of benthic irradiance and turbidity at a shallow depth (~3.5 m) on a coastal coral reef for 2 years allowed the quantification of potential thresholds of concern for turbidity. The linear relationship between the attenuation coefficient for downward irradiance Kd (PAR) and turbidity showed that a change from 0 to 3 nephelometric turbidity units (NTU) at 3.5 m results in a decrease of 88% of benthic irradiance to levels around 200 µmol photons m-2 s-1. The minimum saturating irradiance (Ek) of Symbiodinium associated with P. damicornis was approximately 206 ± 8 µmol photons m-2 s-1 at shallow depths on nearshore reefs of the Whitsunday Islands. Thus, levels of turbidity greater than 3 NTU can result in environmental conditions that are light limiting, and hence sublethal photo-physiological stress, for P. damicornis. Levels of turbidity of 4.5 NTU corresponded to 6 – 8% of surface irradiance, which was a critical level of irradiance required for coral reef development in the Whitsunday Islands. Thus, long-term turbidity >3 NTU could be used as a threshold of turbidity for sublethal photo-physiological stress, while long-term turbidity >5 NTU for severe stress effects on P. damicornis at shallow depths (~3.5 m) on coastal reefs. Temporal variation in the growth parameters of massive Porites from two nearshore regions of the GBR were not consistent with regional differences in water quality. Mean annual SST increased by ~0.38°C over a 16 year study period that correlated with a decline of ~21% in coral calcification rates. A decline in calcification of this magnitude with increasing SST contrasts with results of previous studies and is unprecedented in recent centuries. Changes in the growth parameters were linear over time, while SST had no effect on skeletal density, but a modal effect on annual extension and calcification with maxima at ~26.7°C. The findings were consistent with other experimental studies of the synergistic effect of elevated seawater temperatures and CO2 partial pressure (pCO2) on coral calcification and suggest that monitoring of seawater chemistry should be undertaken on the GBR. Defining a set of key selection criteria and assessing the characteristics of candidate indicators in a matrix against changes in water quality, allowed the identification of coral indicators for a monitoring toolbox. The most suitable bioindicators were: symbiont photo-physiology, colony.
(22) xii. brightness, skeletal and tissue growth, and bioeroder density in massive Porites, coral recruitment, community structure of corals, indicator organisms other than corals and the maximum depth of coral reef development. As each of these measures has a different sensitivity and response time to changes in environmental conditions, a combination of measures, i.e. a composite indicator system, is recommended for use in assessments of the condition of coastal reefs on the GBR..
(23) Chapter 1. Chapter 1.0 thesis outline. 1. General introduction, review of literature and.
(24) Chapter 1. 1.1. 2. General Introduction. Coral reefs are recognised as being amongst the most diverse of the world’s ecosystems. They provide a source of food and income in many countries, they have important tourism values and they may provide the next generation of pharmaceuticals used by humans. There is increasing concern, however, about the status of coral reefs with recent estimates suggesting that approximately 20% of the world’s reefs have been destroyed with a further 50% are under threat of ecosystem collapse (Wilkinson 2004). Threats to coral reefs include the effects of climate change (Hughes et al. 2003), diseases (Sutherland et al. 2004), outbreaks of crown of thorns starfish (Acanthaster planci; Birkeland and Lucas 1990), changes in water quality (Rogers 1990; Fabricius 2005) and destructive fishing practices. On the Great Barrier Reef (GBR), there is considerable concern about the influence of runoff of nutrients, sediments and agrochemicals on coral reefs (Bell and Elmetri 1995; Haynes and Michalek-Wagner 2000). The coastal zone of the Great Barrier Reef World Heritage Area, with an area of 30,000 km2 and a water volume of 300 km3, receives an average annual input of water and sediment on the order of 66 km3 and 7 – 28 Mt, respectively (Furnas 2003; Alongi and McKinnon 2005). Nutrient and sediment input have increased several-fold over the past 150 years (Moss et al. 1992; McCulloch et al. 2003). Current estimates of annual inputs of nitrogen and phosphorus from land are ~43,000 t and 7,000 – 11,000 t, respectively; a significant proportion of these nutrients are associated with particulate matter (Furnas 2003). Enrichment of nutrients and sediments can alter trophic structures of coral reefs (Grigg 1994; Lapointe 1997). Colony measures such as tissue thickness and growth rates of the massive coral Porites (Risk and Sammarco 1991; Barnes and Lough 1992; Lough and Barnes 2000), concentrations of chlorophyll a and symbiont densities (Hoegh-Guldberg and Smith 1989) as well as lipid and protein content in corals (Anthony and Fabricius 2000; Anthony 2006) differ along environmental gradients. At the ecological level, nutrient enrichment and sedimentation can have negative effects on reproduction (Loya et al. 2004), inhibit rates of coral fertilization (Gilmour 1999; Harrison and Ward 2001), reduce levels of coral recruitment (Loya 1976; Babcock and Davies 1991; Wittenberg and Hunte 1992) and alter biodiversity (van Woesik et al. 1999; Fabricius and De'ath 2004; Fabricius et al. 2005). These processes can transfer the competitive advantage on nearshore reefs from corals to macroalgae leading to trophic dominance by assemblages of macroalgae (Schaffelke 1999) once productivity exceeds rates of grazing (McCook 1999; Hughes et al. 2007). Numerous studies have developed and applied indicators as measures of coral condition in the past, however, with some exceptions few have aimed at comparing proposed indicator measures against each other. The exceptions include Risk et al. (2001) who highlighted the need for early warning, cost-effective indicators that can be used at large spatial scales. They proposed a toolbox.
(25) Chapter 1. 3. comprising assessments of the diversity of stomatopods, amphipods and other invertebrates, and measurements of bioerosion and geochemical markers to identify intensity and origin of stress. Using a rapid assessment method, DeVantier et al. (1998) showed that a two-tiered examination of ecological indicators (benthic cover and taxonomic composition of scleractinian corals) could discriminate sites with high conservation value in the Whitsunday Region of the GBR. Jameson et al. (2001) described the value of using a multimetric index to assess ecosystem health and developed the Index of Biotic Integrity (IBI), combining measures such as sessile epibenthos, benthic macroinvertebrates, fish, marine vegetation, phytoplankton and zooplankton, to produce an environmental score of the condition of coral reefs. No studies have undertaken a quantitative comparison of coral indicators to identify those suitable for assessing changes in environmental conditions on coastal coral reefs of the GBR.. 1.2. Review of literature. The types of indicators that could be used to assess the status coral reefs range from responses at the molecular- to community-level. The aim of this review is to summarise the types of indicators that have been, or could be, used in monitoring programmes of the effects of changes in water quality on coral reefs. I define a change in water quality broadly as some change in concentrations of dissolved and/or particulate nutrients, rates of sedimentation, levels of turbidity, or any associated changes in levels of benthic irradiance (light) and an overview of the effects of these stressors on corals is provided below. A review on how to sample or design response/validation experiments is not included, as this topic has received much attention elsewhere (e.g. Andrew and Mapstone 1987; Underwood 1997).. 1.2.1. Effects of water quality on corals. 1.2.1.1 Nutrient availability The main sources of new nutrients (N and P) in the GBR are upwelling from the Coral Sea and terrestrial runoff (Furnas 2003; McKergow et al. 2005). Corals are exposed to nutrients in a variety of forms that include particulate matter, and dissolved inorganic and organic nutrients (DIN and DON). Since dissolved inorganic nutrients (both N and P) are assimilated rapidly by phytoplankton, only a fraction of DON is bio-available, and the majority of nutrients are discharged in terrestrial runoff as particulate matter, particulate nutrients are the most common bio-available form of nutrients for corals in the coastal zone (Furnas 2003). Concentrations of nutrients on coral reefs vary widely with differing spatial and temporal scales. Nutrient concentrations are generally higher on coastal than offshore reefs (Brodie et al. 2007; Chapter 2) and higher in the Austral summer than in winter (Brodie et al. 2007)..
(26) Chapter 1. 4. The effects of nutrients on corals depend on the concentration and duration of exposure. Moderate levels of dissolved inorganic nutrients and particulate nutrients can enhance rates of gross photosynthesis (Kinsey and Davies 1979; Hoegh-Guldberg and Smith 1989; Ferrier-Pages et al. 2000), increase symbiont density (e.g. Hoegh-Guldberg and Smith 1989; Muscatine et al. 1989) and tissue thickness (Barnes and Lough 1992; Lough and Barnes 2000), but reduce rates of calcification (Kinsey and Davies 1979; Marubini and Atkinson 1999). At higher concentrations, however, light attenuation negates the advantages of heterotrophic nutrition due to downregulation of photosynthesis and reduced rates of calcification (Marubini 1996), which may alter reef metabolic processes leading to changes in community structure and diversity (Fabricius 2005).. 1.2.1.2 Sedimentation Sedimentation is defined as the deposition of particulate material onto the benthos, with the origin of the particles either resuspension from the seafloor or new imports through terrestrial runoff (Rogers 1990; Wolanski et al. 2005). Levels of sedimentation on coral reefs vary widely with differing spatial and temporal scales. Rates of sedimentation are usually greatest near the coast where wind waves can re-suspend seafloor sediments, and near river mouths, and decrease with distance from the shore (Rogers 1990; Todd et al. 2001; Lirman et al. 2003). At smaller scales, sedimentation is usually greatest in sheltered, wave-protected lagoons, bays, or deeper reef slopes and lowest in shallow wave-exposed areas (Wolanski et al. 2005). Sedimentation rates also vary temporally, and are high after periods of strong winds, waves and terrestrial runoff (Wolanski et al. 2008). Increased concentrations of particulate materials can have contrasting effects on corals. Feeding on fine sediment particles may enhance coral growth in some species (Anthony 1999). However, the ability of corals to utilise particulate organic matter as a source of nutrition varies among species and types of sediment (Anthony and Fabricius 2000). In general, however, settling particulate matter represents a stress to corals. Energy investment into sediment rejection stresses corals in a variety of ways including down-regulation of photosynthesis and increasing their rates of respiration and mucus production (Riegl 1995; Telesnicki and Goldberg 1995; Yentsch et al. 2002; Philipp and Fabricius 2003). Photo-physiological stress occurs within hours of exposure to sedimentation (Philipp and Fabricius 2003) and is strongly related to the quality of the sediment (Weber et al. 2006), and is thus considered a useful sublethal indicator of changes in water quality. Accumulation of sediment on corals may ultimately result in tissue necrosis leading to injury and partial mortality (Lasker 1980; Rogers 1983; Peters and Pilson 1985; Gilmour 2002, Bak, 1978), which can lead to whole-colony mortality thereby altering the demography, percentage cover and community structure on coral reefs. Changes in community structure occur because susceptibility.
(27) Chapter 1. 5. to sedimentation varies among coral species according to tissue thickness, polyp sizes and growth forms (Abdel-Salam et al. 1988; Stafford-Smith 1993; Riegl 1995; Wesseling et al. 1999).. 1.2.1.3 Turbidity and light attenuation Turbidity refers to the amount of suspended particulate matter (SPM) in the water column (and to a lesser extent some dissolved organic compounds) and their effect on light attenuation (Te 1997; Fabricius 2005). Suspended particles include both inorganic and organic matter (bacteria, phytoplankton, zooplankton and detritus), or inorganic particles with organic coating. Turbidity and thus light attenuation may vary over small spatial and temporal scales depending on the proximity of sources of terrestrial runoff (Fabricius 2005) as well as changes in local weather conditions (Larcombe et al. 1995; Orpin et al. 2004; Wolanski et al. 2005). Turbidity and light attenuation can have contrasting effects on corals. Some species gain a substantial proportion of their energy budgets from heterotrophic feeding on SPM, while others obtain most of their nutrition from autotrophy regardless of the availability of particulate matter (Anthony and Fabricius 2000). At deeper depths, the energy gained from utilising SPM is most likely offset by the energy lost from reduced light availability (Fabricius 2005). Corals are able to photo-acclimate to changes in light levels by adjusting the concentration of photosynthetic pigments and/or the density of their symbionts. The coral-symbiont association can adapt to low irradiance by increasing concentrations of photosynthetic pigments and/or the density of the symbionts (Falkowski and Dubinsky 1981; Dubinsky et al. 1984; McCloskey and Muscatine 1984; Porter et al. 1984; Chapter 4). Symbionts acclimated to high irradiance have less photosynthetic pigments and/or occur at lower cell density and thus exhibit lower light absorption characteristics (e.g. PAR-absorptivity; Ralph et al. 2005; Chapter 3). Corals that are not able to compensate energetically from reduced light availability may experience decreased rates of calcification and thinner tissue in the coral host (Rogers 1979; Telesnicki and Goldberg 1995; Anthony and Hoegh-Guldberg 2003a). Due to variable abilities of corals in deeper water to compensate for low light, increased turbidity may lead to reduced density and diversity of corals, thus reducing the limit of depth distribution in coral communities (Birkeland 1987; Yentsch et al. 2002; Chapter 2).. 1.2.2. Characteristics of suitable indicators. Monitoring programmes examine biological responses to determine the status, trends and the effects of specific stressors on ecological systems. Bioindicators and/or biomarkers are often used to detect such responses. A biomarker refers to measures at the biomolecular or biochemical level (McCarty et al. 2002), whereas a bioindicator (hereafter indicator) refers to those at higher colony, population and/or community levels. The use of biological indicators provides a number of.
(28) Chapter 1. 6. significant advantages over direct measurements of water quality. For example, a direct measurement of water quality provides information about the condition of the water column at that particular point in time only. Moreover, if sampling is weather-dependant and constrained by safety considerations, then important information on the effects of episodic events, e.g. terrestrial discharges during floods or the resuspension of sediments during strong winds, may be missed. These issues are overcome, however, with the use of biological indicators that can provide a timeintegrated measure (from time periods of minutes to years) of the effects of changes in water quality on coral reefs. Indictors that respond rapidly to a stressor can be used to detect sublethal effects, while indicators with high specificity can provide ecologically relevant information about the exposure particularly if the stressors can not be quantified. Given the wide variety of natural and anthropogenic factors that can influence a complex ecosystem such as a coral reef, it is unlikely that a single indicator exists that could sufficiently describe the condition of a coral reef (Erdmann and Caldwell 1997; Jameson et al. 1998). Rather, a composite of indicators (sensu Risk et al. 2001) incorporating responses from different ecological levels of organisation (i.e. colony to communities) that can be combined to form an index (e.g. Jameson et al. 2001) has greater potential for success in assessments of the condition of coastal coral reefs. To select a biological indicator objectively, requires a set of selection criteria. Here, five key criteria are defined (Table 1.1) as modified from Jones and Kaly (1996), Erdmann and Caldwell (1997) and Jameson et al. (1998) that were considered to characterise desirable features of indicators necessary for assessing the condition of coastal coral reefs. An important criterion in the selection of any indicator is the response time over which the biological response is manifest in the colony, population or community. Both the times for the onset of a response and the period until full recovery of a response can range from near-instantaneous to decades. An important distinction, therefore, is to differentiate between methods suitable for detecting effects during or shortly after exposure to the stressor (rapid, with onset of response and recovery from an event within hours to weeks), and those better suited to detecting cumulative effects over prolonged periods of time (slow: onset and recovery taking months to years). An example of a method providing an immediate indication of stress is a change in the photo-physiology of Symbiodinium (Jones et al. 1999; Philipp and Fabricius 2003), whereas variation in the density and composition of macro-bioeroders due to changes in water quality may occur on a time-scale of years (Hutchings and Peyrot-Clausade 2002). Both types of indicators have advantages and disadvantages. A rapid response following exposure to a stressor is considered a desirable feature of an indicator as the response could be used as a sublethal indicator particularly for environmental impact assessments (e.g. of the effects of dredging) or acute disturbances such as episodic runoff events. This is offset, however, by the high level of sampling intensity and replication required in monitoring programmes to obtain accurate estimates of a response that.
(29) Chapter 1. 7. could change on a time-scale of days to weeks; important events may be missed if recovery is too quick. Equally, whilst an indicator responding on a slower time-scale may not provide an early warning of change, they are still considered useful particularly for monitoring of chronic effects, as these types of indicators are likely to have low natural variability, and require lower sampling intensity to detect ecological change. Thus, in addition to response time, the importance of which will depend on the question being addressed, outlined below are five criteria that can be used to select indicators for assessments of the condition of coral reefs: 1. Response specificity is the extent to which the biological response is specific to the stressor (either chronic or acute) of interest and not to variation due to other causes. For example, the maximal depth of reef building corals was strongly related to a water quality gradient in the Whitsunday Islands and is considered highly specific to changes in water quality, particularly light attenuation associated with turbidity (Chapter 2), but is unlikely to respond to other stressors, e.g. warming sea temperatures. The photo-physiological parameter PARabsorptivity, which indicates a more densely pigmented coral tissue layer possibly due to greater density of symbionts and/or concentration of chlorophyll (Ralph et al. 2005), was also strongly related to differences in water quality (Chapter 3). However, symbiont loss is a well known response to a range of stressors including high sea temperatures (e.g. Glynn and D'Croz 1990; Hoegh-Guldberg 1999), thus changes in PAR-absorptivity due to changing water quality can at times be confounded by bleaching stress. 2. Monotonic refers to the shape of the dose-response relationship, in which the magnitude of the response reflects the intensity (and/or duration) of the stress. A decrease in the photosynthetic yield (Fv /Fm) of Symbiodinium exposed to increasing levels of a stressor (Jones et al. 1999; Philipp and Fabricius 2003; Negri et al. 2005) is an example of a monotonic response indictor. 3. Variability refers to indicators that demonstrate patterns of low variation in the absence of the stressor. An indicator that displays patterns of seasonal or temporal variability such as symbiont density (Fitt et al. 2000) or lipid content (Leuzinger et al. 2003) might still be suitable for inclusion into an indictor system provided that the variability is understood and can be accounted for in statistical analyses. 4. Practicality refers to indicators that are easily quantified, low cost, require a low level of expertise and are applicable over a range of spatial and temporal scales (e.g. Risk et al. 2001). The cost factor includes consideration of the amount of labour required to collect data in the field and for laboratory analyses, and the cost of equipment and reagents required to process the samples. The colour chart developed by Siebeck et al. (2006) is an example of an economic, simple tool that can be used by a range of end-users..
(30) Chapter 1. 8. 5. Relevant refers to indicators that are both ecologically relevant and also important in public perception. Relevance assists in the communication of the results to a wide range of end-users. Measures such as the shift from a diverse hard coral to a macroalgal dominated reef community, are readily communicated to the public (e.g. Hughes 1994). Table 1.1. Summary of criteria for selection of indicators to assess effects of stressors on corals and coral communities. Modified from Jones and Kaly (1996), Erdmann and Caldwell (1997) and Jameson et al. (1998). Attribute. Criteria. Specificity. Indicator should be specific to the cause (the stressor of interest), hence clearly attributable to that stressor.. Monotonic. The relationship between the disturbance intensity and the response size should be monotonic (rather than modal).. Variability. Indicator should be consistent at a range of scales in time and space. Ideally, there should be low background variability.. Practicality. Indicator should be cost effective, easy to measure and a proxy for another, more complicated or costly measure. Measurements should be observerindependent and carried out by a range of users, ideally requiring a low level of expertise.. Relevance. Indicator should be ecologically relevant and ideally important in public perception to assist communication.. A schematic of desirable features of an indicator is presented in Fig. 1.1 showing the responses of a hypothetical indicator to hypothetical disturbances (e.g. chronic or episodic runoff events). A suitable indicator must display a response to a disturbance (either chronic or acute) that differs with the response at reference areas. Under chronic conditions, this would be a long-lasting or permanent response (Fig. 1.1a). For acute disturbances, the response would last as long as the disturbance in question (shaded area; Fig. 1.1b), or for a period of time following the disturbance, but eventually the indicator would return to levels measured at reference areas. Further, it should demonstrate specificity by not responding to other types of disturbances (Fig. 1.1b). Ideally, the indicator should provide information on the intensity of the disturbance. A monotonic relationship is shown in Fig. 1.1c where the indicator responds to a disturbance by changing direction (either positive or negative) as the size of the disturbance changes but returns to values comparable to reference areas once the disturbance is over. An indicator that displays patterns of seasonal or temporal variability might still be suitable for monitoring programmes provided that (at the time of the disturbance) the measure at the area of interest is different in some way compared with that at reference areas (Fig. 1.1d). Finally, any measure that does not respond to a specific disturbance.
(31) Chapter 1. 9. would obviously not represent a suitable indicator (Fig. 1.1e). An ideal indicator would show a response similar to the one described in Fig. 1.1c, quantifying the extent of disturbance and showing rapid recovery following cessation of the disturbance. Among the most important features of an indicator is that it demonstrates patterns of low unexplained variability in the absence of the disturbance. The responses of potential indicators must be validated with both manipulative experiments and sampling programmes in the field to ensure they are specific to the disturbance of interest. Measuring and validating such responses in the field is, however, a complex process given the natural spatial and temporal variability inherent in biological systems. Notwithstanding this, it is clear that sampling at a range of spatial and temporal scales is an appropriate way to measure environmental responses (e.g. Green 1979; Stewart-Oaten et al. 1986; Underwood 1991). This approach allows comparisons of estimates of the response variability at disturbed areas with natural variability at reference areas, which have not been affected by the disturbance but are otherwise comparable in nature. If, following a disturbance, the response measure at the disturbed area differs in some way from the variability measured at reference areas, then it can be assumed that the response was due to the disturbance..
(32) Chapter 1. Fig. 1.1. Response of a hypothetical indicator to a disturbance (dark grey areas represent the disturbance in question; light grey areas represent other disturbances). A suitable indicator must detect differences between a disturbed state (solid line) and reference states (dashed lines). The situations described in a), b) c) and d) would be appropriate for inclusion into a monitoring program.. 10.
(33) Chapter 1. 1.2.3. 11. Indicators and indices in other aquatic ecosystems. The use of validated indicators of ecosystem health, numerical indices and predictive models are well developed in other aquatic ecosystems. For this reason, the following section highlights examples from estuarine and freshwater ecology that have incorporated methods that could potentially be adapted for use on coral reefs. Assessments of estuarine health have focused on different components of the ecosystem including seagrasses (Abal and Dennison 1996; Dennison and Abal 1999), foraminifera (Saraswat et al. 2004), filter feeders such as bivalves (Bayne 1989) and fish assemblages (Scott and Hall 1997; Blaber 1999). For example, light attenuation is considered to be a limiting factor for the distribution of seagrasses (Duarte 1991; Masini et al. 1995). Elevated levels of turbidity from episodic runoff events (Preen et al. 1995; Longstaff and Dennison 1999), the resuspension of sediments due to currents, wind and wave activity (Larcombe et al. 1995; Dennison and Abal 1999), or from anthropogenic disturbances such as dredging, reduces light penetrating to the seafloor and may contribute to seagrass decline. Abal and Dennison (1996) found seagrasses (mainly Zostera capricorni) extended to deeper depths at locations with low turbidity, light attenuation and concentrations of nutrients than turbid locations in Moreton Bay (Australia). Recent work has proposed to use the relationship between the maximal depth of seagrasses and water quality as an indicator of estuarine health (e.g. Carruthers et al. 1999; Dennison and Abal 1999). There is widespread use of trophic or pollution indicators in freshwater ecology, each measuring specific components of the ecosystem such as bacteria (Godlewska-Lipowa 1976), diatoms (Chessman et al. 1999; Taffs 2001), macroinvertebrates (Krieger 1984; Growns et al. 1995; Lamberti and Berg 1995; Wright et al. 1995; Chessman 1999; Klemm et al. 2002) or fish (Harris 1995; Soto-Galera et al. 1998). Other studies range from indicators based on the proportion of deformities found in certain taxa (Bird 1994) to those that have measured the abundance of elephants (Elephas maximus) to assess the effects of unregulated mining discharge into a river in Northern India (Singh and Chowdhury 1999). Many studies have further developed the use of indicators into an integrated framework to assess the health of freshwater ecosystems. Models such as RIVPACS (Wright 1995) and AUSRIVAS (Turak et al. 1999, Simpson, 2000) use information collected for ‘predictor variables’, which are considered unlikely to be affected by anthropogenic impacts, to predict the assemblage of macroinvertebrates that could be expected to occur at a particular location in the absence of anthropogenic disturbances. The predicted assemblage is then compared with that sampled to provide a basis to assess the health of the system..
(34) Chapter 1. 12. Other approaches to assess freshwater ecosystem health have been the development of tools such as the SIGNAL index that correlate biotic and abiotic data to produce an environmental quality score for a particular site. Chessman (1995) developed the SIGNAL biotic index, which was later modified (Chessman et al. 1997), to determine the health of rivers in south-east Australia using the presence or absence of families of macroinvertebrates. The grade-numbers for each macroinvertebrate family or taxon were derived from their responses to chemical pollutants. Thus, the SIGNAL index is designed to provide an assessment of ecological health based on water quality.. 1.2.4. Indicators of the condition of coastal coral reefs. 1.2.4.1 Colony indicators Photosynthetic efficiency Chlorophyll a fluorescence of Photosystem II (PSII) using pulse-amplitude-modulation (PAM) technology of coral symbionts has been used widely to infer environmental impacts on the regulation of photosynthesis (e.g. Warner et al. 1996; Jones et al. 1999; Fitt et al. 2001; Hill et al. 2004a). However, in recent years, PAM has also been applied to test photo-physiological responses of symbionts in relation to various components of water quality. Recent studies have shown that maximum quantum yield (Fv /Fm) decreases depending on the duration and quantity of sediment exposure (Philipp and Fabricius 2003), sediment type (Weber et al. 2006) and hyposaline conditions (Kerswell and Jones 2003). Similarly, toxicants have been found to negatively influence the maximum quantum yield depending on quantity and exposure duration (Jones et al. 1999; Markey et al. 2007; Table 1.2). Imaging-PAM chlorophyll a fluorometers (Schreiber 2004), which are essentially a twodimensional version of the more conventional chlorophyll fluorometers, are capable of mapping the chlorophyll a fluorescence yield with a spatial resolution of ~0.5 mm. They can perform all standard routines of saturation pulse quenching analysis (Schreiber 2004), such as determination of maximum and effective (ΔF/Fm’) quantum yield as well as measurements of fluorescence induction and rapid light curves (White and Critchley 1999; Ralph and Gademann 2005). Rapid light curves can provide detailed information on photo-acclimatory responses of corals to changes in the light regime on coral reefs. Quantitative parameters derived from the fitting of rapid light curves include apparent photosynthetic rate (PSmax), minimum saturating irradiance (Ek) and light utilisation coefficients (α). Under high irradiance, symbionts are characterised by high PSmax, Ek and low α (White and Critchley 1999; Ralph and Gademann 2005; Ulstrup et al. 2006b). In contrast, symbionts acclimated to low irradiance are characterised by having low PSmax and Ek, and high α (White and Critchley 1999; Ralph and Gademann 2005)..
Figure


+7


Outline
Sediments
Discussion
Environmental gradient
Minimum fluorescence and maximum quantum yield
0 Relationship among coral reflectance, chlorophyll a concentration and perceived brightness of
Experiment
Field manipulative experiment
Coral indicators
0 Declining coral calcification in massive Porites in two nearshore regions of the northern Great Barrier Reef
Symbiont photo-physiology
Related documents
nature exhibits rich diversity of different structures and phenomena. however, behind this complexity often relatively simple universal laws and patterns are hidden. in this
The cell e.s.d.'s are taken into account individually in the estimation of e.s.d.'s in distances, angles and torsion angles; correlations between e.s.d.'s in cell parameters are
The results of the VECM model, which is used to test the hypothesis, establish a conclusion that there is a long-term Granger cointegration relationship derived from FDI to
Following the Ninth Circuit’s determination, only two circuits have addressed the narrow issue of whether a de minimis exception applies to infringement actions based upon the
For the RNA-seq data sets generated with anlotinib resistant NCI-H1975 and anlotinib-treated anlotinib resistant NCI-H1975, we firstly removed genes whose transcription is modulated
The heights and plant diameters of the plots fertilized at 75 and 100 kg N/ha were higher than those obtained for the lower fertilization levels under the direct and residual
Received 30 September 2005 Accepted 10 November 2005 Online 16 November 2005.. , 1999); program(s) used to refine structure: SHELXL97 (Shel- drick, 1997); molecular graphics:
To mark the 4th European Month of Photography in 2010, the Berlinische Galerie continues to present four more positions: Emil Otto Hoppé with photos from the 1920s, Arno Fischer,
