METHOD DEVELOPMENT AND VALIDATION FOR
ANTI DIABETIC DRUGS BY RP-HPLC
A dissertation submitted to
THE TAMILNADU Dr.M.G.R MEDICAL UNIVERSITY
CHENNAI- 600 032In partial fulfillment of the requirements for the award of degree of
MASTER OF PHARMACY
IN
PHARMACEUTICAL ANALYSIS
SUBMITTED BY
YAMUNA PRADEEPA J
(Reg. No. 261330961) Under the guidance of
Mr.S.Justin Jayaraj, M.Pharm.,
DEPARTMENT OF PHARMACEUTICAL ANALYSIS
EDAYATHANGUDY.G.S PILLAY COLLEGE OF PHARMACY
NAGAPATTINAM-611002
METHOD DEVELOPMENT AND VALIDATION FOR
ANTI DIABETIC DRUGS BY RP-HPLC
A dissertation submitted to
THE TAMILNADU Dr.M.G.R MEDICAL UNIVERSITY
CHENNAI- 600 032In partial fulfillment of the requirements for the award of degree of
MASTER OF PHARMACY
IN
PHARMACEUTICAL ANALYSIS
SUBMITTED BY
(Reg. No. 261330961)
DEPARTMENT OF PHARMACEUTICAL ANALYSIS
EDAYATHANGUDY.G.S PILLAY COLLEGE OF PHARMACY
NAGAPATTINAM-611002
Mr.S.Justin Jayaraj,
M.Pharm.,Assistant Professor,
Department of Pharmaceutical Analysis
Edayathangudy.G.S. Pillay College of Pharmacy,
Nagapattinam
–
611 002.
CERTIFICATE
This is to certify that the dissertation entitled
“
METHOD
DEVELOPMENT AND VALIDATION FOR ANTI DIABETIC
DRUGS BY RP-HPLC
”
submitted by YAMUNA PRADEEPA J(Reg
No:
261330961
) in partial fulfillment for the award of degree of Master
of Pharmacy to the Tamilnadu Dr. M.G.R Medical University, Chennai is
an independent bonafide work of the candidate carried out under my
guidance
in
the
Department
of
Pharmaceutical
Analysis,
Edayathangudy.G.S Pillay College of Pharmacy during the academic year
2012-2013.
Place: Nagapattinam
Date:
Prof.Dr.D.BabuAnanth,
M.Pharm., Ph.D.,Principal,
Edayathangudy.G.S.Pillay College of Pharmacy,
Nagapattinam – 611 002.
CERTIFICATE
This is to certify that the dissertation entitled
“
METHOD
DEVELOPMENT AND VALIDATION FOR ANTI DIABETIC
DRUGS BY RP-HPLC
”
submitted by YAMUNA PRADEEPA J(Reg
No:
261330961
) in partial fulfillment for the award of degree of Master
of Pharmacy to the Tamilnadu Dr. M.G.R Medical University, Chennai is
an independent bonafide work of the candidate carried out under the
guidance
of
Mr.S.justin
jeyaraj,M.Pharm,,in
Department
of
Pharmaceutical Analysis, Edayathangudy G.S.Pillay College of
Pharmacy, Nagapattinam
during the academic year 2014-2015.
Prof.Dr.D.BabuAnanth,
M.Pharm., Ph.D.,Place: Nagapattinam
ACKNOWLEDGEMENT
I would like to express profound gratitude to
Jothimani
Chevalier
Thiru.G.S.Pillay,
Chairman, E.G.S.Pillay College of Pharmacy, and
Thiru.S.Paramesvaran,
M.Com., FCCA.,Secretary, E.G.S.Pillay College
of Pharmacy.
I express my sincere and deep sense of gratitude to my guide
Mr.S.Justin Jayaraj, M.Pharm., Principal, E.G.S.Pillay College of
Pharmacy, for his guidance, invaluable and extreme support, encouragement,
and co-operation throughout the course of my work.
I wish to express my great thanks Prof.Dr.D.Babu Ananth,
M.Pharm., Ph.D., Principal, E.G.S.Pillay College of Pharmacy, for his support
during my project work.
I wish to express my great thanks to Prof.Dr.M.Murugan,
M.Pharm., PhD, Director cum Professor, Head, Department of
Pharmaceutics, E.G.S.Pillay College of Pharmacy, for his support during my
project work.
I wish to express my great thanks to Prof.K.Shahul Hameed
Maraicar, M.Pharm., (PhD), Director cum Professor , Department of
Pharmaceutics, E.G.S.Pillay College of Pharmacy, for his support during my
project work.
I would like to extend my thanks to all the Teaching Staff and Non
Teaching Staff, who are all, supported me for the successful completion of my
project work.
Last but not least, I express my deep sense of gratitude to my parents,
INDEX
S.NO
CONTENTS
PAGE NO
1
INTRODUCTION
1
2
LITERATURE REVIEW
20
3
DRUG PROFILE
22
4
AIM & PLAN OF WORK
26
5
MATERIALS & METHODS
27
6
CHROMATOGRAMS
50
7
RESULTS & DISCUSSION
78
8
SUMMARY & CONCLUSION
80
INTRODUCTION
Analytical chemistry may be defined as the science and art of
determining the composition of materials in terms of the elements of
composition contained. Pharmaceutical analysis is a bench of science that deals
with the analytical procedures used to determine the purity, safety and quality
of drugs and chemicals. It contains procedures to determine the identity ,
strength , quality and purity of new compounds . It also involves procedures
for separating, identifying, and determining the relative amount of the
components in sample of matter.
Quality assurance plays a key role in finding the safety and
efficiency of medicines. It has highly specific and sensitive analytical
methods for the design , development, standardization and quality control of
medicinal products . They are equally important for the pharmacokinetics and
drug metabolism studies, both which are important for the assessment of
bioavailability and clinical response.
Modern physical method of analysis are extremely sensitive even
for small amount of samples of materials .It can be rapidly applied and can
readily amenable to automation. So it is widely used in the product
development and in the control of manufacture , formulation and also in
monitoring the use of drugs and medicines.
The term pharmaceutical analysis includes both quantitave and
qualitative analysis of Drugs and pharmaceutical substances starting from
bulk drugs to finished dosage forms .So it is used as a diagnostic aids in the
modern practice of medicine by the analysis of chemical constituents in the
human body which may alter during the disease state .
If the quality of drug product is questioned by a physician , the
pharmacist is responsible for taking necessary steps to determine if indeed
the product is defective . This may be accomplished by contacting with
drug manufacturer about the problem involving the product , analyzing the
clinical laboratory if necessary , sending the sample to a private
laboratory for analysis , or a combination of all these steps .In any case
,however, it remains the responsibility of analyst to solve problems relating to
drug quality .
The term ‘quality’ as applied to a drug product has been defined
as the sum of all factors which contributes directly or indirectly to the safety ,
effectiveness and reliability of the product.
Significance of quality control:
The pharmaceutical industry continues as a vital segment of the health
care cycle in conducting research and manufacturing products which are life
maintaining and life restoring.
Modern medicines for human use are required to meet exacting
standards which are Related to their quality , safety and efficacy .The
evaluation of safety , efficacy and their maintenance in practice is dependent
up on the existence of adequate methods for the quality control of product.
Quantitative analysis reveals the chemical identity of species in
the sample . Quantitative analysis establishes the relative amount of one or
more of these species or analyte in numerical terms.
Analytical Techniques
The efficacy and safety of a medicinal product can only be
assured by analytical monitoring of its quality. Therefore, the overall purity
of a medicine must be assessed throughout its storage, distribution and use.
The objective can possibly be achieved if the specification to be
applied are based on validated procedure , which can demonstrate the
relationship in quality between the substance under examination and that
initially subjected to pharmaceutical, toxicological and pharmacological
These are the following techniques employed for
estimation of different components in formulations.
Optical methods
Some of the optical methods are
X-ray spectroscopy
UV-Visible spectroscopy
Infrared spectroscopy
Atomic absorption spectroscopy
Flame photometry
Nuclear magnetic resonance spectroscopy
Nephlo-turbidimetry
Electron spin spectroscopy
Electro analytical methods:
Some of the electro analytical methods are
Amperometry
Voltametry
Potentiometry
Conductometry
Separation methods/chromatography
Some of chromatographic methods are
Gas-liquid chromatography
Gas-solid chromatography
Liquid-liquid chromatography
Liquid-solid chromatography
Thin-layer chromatography
Paper chromatography
One of the major decisions to be made by an analyst is the choice of
the most effective procedure for a given analysis , for this he must be
familiar with the practical details, the theoretical principles and also that he
must be conversant with the condition under which each method is reliable ,
aware of possible interferences which may arise and capable of demising
means of circumventing such problems .
The instrumental separative techniques are divided into two categories.
1. Chromatography
2. Electrophoresis
3. Mass spectroscopy
Chromatography
Chromatography is a technique by which a mixture is separated into
its components as a result of the relative ability of each component to be
eluted along or through the stationary phase by mobile phase .The sample is
placed on edge of the stationary phase (a solid or liquid) and a mobile phase is
allowed to flow over the stationary phase to sweep the sample along the length
of the stationary phase .Component which are strongly adsorbed to the
stationary phase are swept less rapidly along the length of the stationary phase
than those components that are less strongly adsorbed to stationary phase .
The word chromatography is derived from the Greek letters chromos
meaning colour and the graphy means colour writing. The initial use of the
terms is attributed to Tswett, who separated colour bands of plant pigments on
a chromatography column that consist of an adsorbent powder that was washed
with a liquid solvent termed as mobile phase . This is carried down the length
HIGH PERFORMANCE LIQUID CHROMATOGRAPHY (HPLC)
The technique of high performance liquid chromatography (HPLC)
was developed in the later 1960s and early 1970s from knowledge of the
theoretical principles that already had been established for earlier
chromatographic techniques in particular for column chromatography. The
technique is based on the same modes of separation as classical column
chromatography. I.e. adsorption, partition (including reverse phase partition),
ion exchange and gel permeation. HPLC differ from column chromatography
in that mobile phase is pumped through the packed column under high
pressure. The principal advantages of HPLC compared to classical (gravity
feed) column chromatography are improved resolution of the separated
substances, faster separation times and the increased accuracy, precision and
sensitivity with which the separated substances may be quantified.
Basic principle of HPLC
High performance liquid chromatography (HPLC) is a separation
technique utilizing differences in distribution of compounds in phases called
stationary phase and mobile phase. The stationary phase designates a thin layer
created on the surface of fine particles and the mobile phase designates the
liquid flowing over the particles. Under a certain dynamic solution, each
component in a sample has different distribution equilibrium depending on the
solubility in the phases and the molecular size.
As a result, the component move at different speeds over the
stationary phase and there by separated by each other. The column is a stainless
steel (or resin) tube, which is packed with spherical solid particles. Mobile
phase constantly fed into the column inlet at a constant rate by a liquid pump.
Sample is injected from sample injector, located near the column inlet. The
injected sample enters the column with mobile phase and the components in
these samples migrate through it, passing between the stationary phase and
Compound move in the column only it is in the mobile phase and
therefore migrate faster through the column while compounds that tend to be
distributed in the stationary phase migrate slower .In this way, component is
separated on the column and sequentially elutes from the outlet. A detector
connected to the outlet of the column detects each compound eluting from the
column.
The recorder starts at the time when sample is injected and
monitors the separation process and a graph is obtained. This graph is called
chromatogram. The time that is required for a compound to elute (called
retention time) and the relationship between the compound concentration
(amount) and peak area depends on the characteristics of the compound.
Selectivity of HPLC
Most of the drugs can be analysed by HPLC method because of several
advantages.
Speed (analysis can be accomplished in 20 minutes or less).
Greater sensitivity (various detectors can be employed).
Improved resolution (wide variety of stationary phase).
Reliable columns (wide variety of stationary phase).
Ideal for substances of low volatility.
Easy sample recovery, handling and maintenance.
Easy programming of the numerous functions in each module.
Time programmable operation sequence, such as initiating operation of
detector lamp and pump to obtain stable baseline and equilibrated
column before the work day begins.
Different Modes of Separation of HPLC
- Normal phase mode
- Reverse phase mode
- Reverse phase ion pair chromatography
- Ion exchange chromatography
- Affinity chromatography
- Size exclusion chromatography (gel permeation and gel filtration
chromatography)
Instrumentation for HPLC
- A solvent reservoir for the mobile phase to be delivered to column over
a wide range of flow rates and pressure. A degasser is needed to remove
dissolved air and other gases from the solvents
- A pump to deliver the mobile phase to the column. The pumping system
must be pulse free. A pump should be able to operate to at least 100
atm(1500 psm), pressure suited to less expensive chromatography.
However, 400 atm (600 psi) is a more desirable pressure limit. For many
analytical columns only moderate flow rate of 0.5 to 2 ml per minute
needed to be generated.
- Sampling valves or loops are used to inject the sample in the flowing
mobile phase just at the head of the separation column.
- At the head of the separation column, there may be a guard column or a
inline filter to prevent contamination of the main column by small
particulates.
- The separation column contains the packing needed to accomplish the
desired HPLC separation. These may be silica’s for adsorption
chromatography, bonded phases for liquid-liquid chromatography, ion
exchange functional groups bonded to stationary support for ion
exchange chromatography, gels of specific porosity for exclusion
chromatography, or some unique packing for a particular separation
- Most column lengths ranges from 10 – 30 cm, short, fast columns are 3
– 8cm long with an internal diameter of 4 -5 mm. Particle diameter lie in the range 3 -5 µm, occasionally up to 10 µm or higher for preparative
chromatography.
- A detector with some type of data handling device, completes the basic
instrumentation.
The various detectors are
- UV visible photometers
- Refractive index detector
- Flourimetric detector
- Conductivity detector
- Amperometric detector
- PDA
Detector electronic integrators and computing integrators are
widely used today in HPLC for measuring peak areas. These devices
automatically sense peaks and print out the areas in numerical forms.
With the help of peak areas and height values, the peak width can be
calculated (considering the peak as a triangle) and it can also be used for
the calculation of number of theoretical plates.
Quantitation methods in HPLC
Peak heights or peak area measurements only provide a
response in terms of detector signal.
This response must be related to the concentration or mass of
the compound of interest. To accomplish this, some type of calibration
must be performed.
The four primary techniques for quantization are
a. Normalized peak area method.
b. External standard method.
c. Internal standard method.
a) Normalized peak area method
The area percent of any individual peak is referred to as normalized
peak area. This technique is widely used to estimate the relative amounts
of small impurities or degradation compounds in a purified material and in
this method the response factor for each component is identified.
b) External Standard method
This method includes injection of both standard and unknown, and
the unknown is determined graphically from a calibration plot or
numerically using response factors.
A response factor (RF) can be determined for each standard as follows.
RF = Standard area (peak height) / Standard Concentration
The external standard approach for most samples in HPLC that do not require
extensive sample preparation.
c) Internal Standard method
Internal standard is a different component from the analyte but one
that is well resolved in the separation. The internal standard should be chosen
to mimic the behavior of the sample component. One of the main reasons for
using an internal standard is for samples requiring significant pre treatment or
preparation.
d) Method of standard addition
The method of standard addition can be used to provide a
calibration plot for quantitative analysis. It is more often used in trace
analysis.
An important aspect of the method of standard addition is that the
response prior spiking additional analytes should be high enough to
provide a reasonable S/N ratio (<10), otherwise the result will have poor
VALIDATION
Validation is a key process for effective quality assurance. “Validation
is established documented evidence, which provides specific a high degree of
assurance that a process of equipment will consistently produce a product or
result meeting its predetermined specifications and quality attributes”.
Definition
USFDA defines validation as “established documented evidence
which provides a high degree of assurance that a specific process will
consistently produce a product of predetermined specifications and quality
attributes”.
EUGMP defines validation as “action of proving in accordance with
the principle of Good manufacturing practice (GMP), that any material activity
or system actually lead to expected result”.
AUSTRALIAN GMP defines validation as “the action of proving
that any material, process, procedure, system, equipment or mechanism used in
manufacture or control can and will be reliable and achieve the desire and
intended result”.
Importance of validation
1. As the quality of the product cannot be always assured by routine
quality
control because of testing of statistically insignificant number of sample.
2. The validation should provide adequacy and reliability of a system or
product to meet the predetermined criteria or attributes, providing high
degree of confidence that the same level of quality is consistently build
3. Retrospective validation is useful for trend comparison or results
complaints to cGMP to cGLP.
4. For taking appropriate action in case of non-compliance.
Objectives of validation
The primary objective of validation is to form a basis for written
procedure for production and process control which are designed to assure that
the drug products have the identity, quality and purity they purport or are
represented to possess.
1. Assurance of quality.
2. Government regulation.
Types of validation
The following are frequently required to be validated on a pharmaceutical
process
1. Equipment validation
2. Process validation
3. Cleaning validation
4. Analytical method validation
5. Facility validation including utilities
ANALYTICAL METHOD VALIDATION
Method validation is a process to confirm that the analytical
procedure employed for a specific test is suitable for its intended use.
Analytical testing of a pharmaceutical product is necessary to ensure the purity,
stability, safety and efficacy. Analytical method validation is an integral part of
PARAMETERS USED FOR ASSAY VALIDATION
The validations of the assay procedure are carried out using following
parameters.
SPECIFICITY:
Specificity is the ability to asses unequivocally analyte in the
presence of impurities, degradants, matrix, etc which may be expected to be
present. Lack of specificity of an individual analytical procedure may be
compensated by other supporting analytical procedures.
PRECISION:
Definition
The precision of an analytical procedure express the closeness of the
agreement between a series of measurements obtained from multiple sampling
of the same homogenous sample under the prescribed conditions. The precision
of an analytical procedure is usually expressed as the variance, standard
deviation or co-efficient of variation of a series measurement.
System precision
A system precision is evaluated by measuring the peak response for
the six replicable injection of the same standard solution prepared as per the
proposed method .The %RSD is calculated and it should not be more than 2%.
Method precision
A method precision is evaluated by measuring the peak response
for six replicate injection of six different weigh of sample solution prepared as
per proposed method. The %RSD is calculated and it should not be more than
Determination
The precision of an analytical method is determined by assaying a
sufficient number of aliquots of a homogenous sample to be able to calculate
statistically valid estimates of standard deviation or relative standard deviation.
ICH Requirements
The ICH documents recommended that repeatability should be
assessed using a minimum number of nine determinations covering the
specified range of the procedure (I, e., three concentrations and there replicates
of each concentrations or using a minimum of six determinations at 100% of
the test concentration).
ACCURACY
Definition
The accuracy of an analytical procedure express the closeness of the
agreement between the values which is acceptable either as conventional true
value or an accepted reference value and the value found.
Determination
In case of assay of drug in a formulated product ,accuracy may be
determined by application of the analytical method to synthetic mixtures of the
drug product components to which the known amount of analyte have been
added within the range of the method . If it is not possible to obtain all product
components ,it may be acceptable either to add known quantities of the analyte
to the drug product or to compare results with those of a second ,well
characterized method ,the accuracy of which has been stated or defined
.Accuracy studies for drug substance and drug product are recommended to be
performed at the 80,100 and 120% level of label claim as stated in the
guidelines for submitting samples and analytical data for method validation .At
each recommended level studied ,replicate samples are evaluated. The RSD of
is. The mean of the replicates, expressed as %label claim, indicates how
accurate the test method is.
ICH Requirements
The ICH documents recommended that accuracy should be assessed
using a minimum of nine determinations over a minimum of three
concentration levels, covering the specified range (i.e., three concentration and
three replicates of each concentration).
LINEARITY
Definition
The linearity of an analytical procedure is its ability (with in a given
range) to obtain the test results which are directly proportional to the
concentration (amount) of analyte in the sample.
Determination
Linearity of an analytical procedure is established minimum of five
concentrations. It is established initially by visual examination of plot of
signals as a function of analyte concentration of content .If there appears to be
a linear relationship ,test results are established by appropriate statistical
methods(i.e., by calculation of the regression line by the method of least
LIMIT OF DETECTION (LOD)
Definition
LOD is the lower concentration of the substance that the method can
detect but not necessarily quantify.LOD simply indicates that the sample below
or above a certain level.
Determination
For non instrumental methods, the detection limit is generally determined
by the analysis of samples with known concentration of analyte and by
establishing the minimum level at which the analyte can be reliably detected.
ICH Requirements
The ICH describes a common approach, which is to compare
measured signal from samples with known concentrations of analyte with those
of blank samples. The minimum concentration at which the analyte can reliably
be detected is established.
Typically acceptable signal-to-noise ratios are 2:1 or 3:1.
LIMIT OF QUANTITATION (LOQ)
Definition
LOQ is the lowest concentration of the substance that can be estimated
quantitatively with acceptable precision, accuracy and reliability by the
proposed method. LOQ is determined by the analysis of samples containing
decreasing known quantity of the substance and determining the lowest level at
which acceptable level of accuracy and precision is attained.
Determination
For non-instrumental methods, quantization limit is generally
determined by the analysis of samples with known concentration of analyte and
by establishing the minimum level at which the analyte can be determined with
RANGE
Definition
The range of an analytical procedure is the interval between the upper
and the lower concentration (amounts) of analyte in the sample (including these
concentrations) for which it has been demonstrated that the analytical
procedure has a suitable level of precision, accuracy and linearity.
Determination
The range of the method is validated by verifying that the analytical
method provides acceptable precision, accuracy and linearity when applied to
samples containing analyte at the extremes of the range as well as within the
range.
ROBUSTNESS
Definition
The robustness of an analytical procedure is a measure of its capacity
to remain unchanged by small but deliberately variations in method parameters
and provides an indication of its reliability during normal usage.
Determination
The robustness of method determined by performing the assay by
deliberately altering parameters(change in flow rate ±10%,change in mobile
phase ratio ±2,change in pH of mobile phase ±0.2,change in wave length
detection ±5nm, change in temperature ±1 to 50 ) that the results are not
RUGGEDNESS
Definition
The ruggedness of an analytical method is the degree of reproducibility
of test results obtained by the analysis of the samples under a variety of
conditions, such as different laborites, different analyst, different instruments,
different lots of reagents, different elapsed assay times, different assay
temperatures, different days etc.
Determination
The ruggedness of analytical method is determined by the analysis of
aliquots from homogenous lots in different laboratories, by different analysis,
using operational and environmental condition that may differ but are still
within the specified parameters of the assay .The degree of reproducibility of
the results is that determined as a function of assay variables. This
reproducibility may be compared to the precision of assay under normal
condition to obtain a measure of the ruggedness of the analytical method.
SAMPLE SOLUTION STABILITY
Solution stability of the drug substance or drug product after
preparation according to the test method should be evaluated. Most laboratories
utilize auto samples with overnight runs and the sample will be in solution for
hours in the laboratory environment before the rest procedure is completed.
This is concern especially for drugs that can undergo degradation by
hydrolysis, photolysis, and adhesion to glassware.
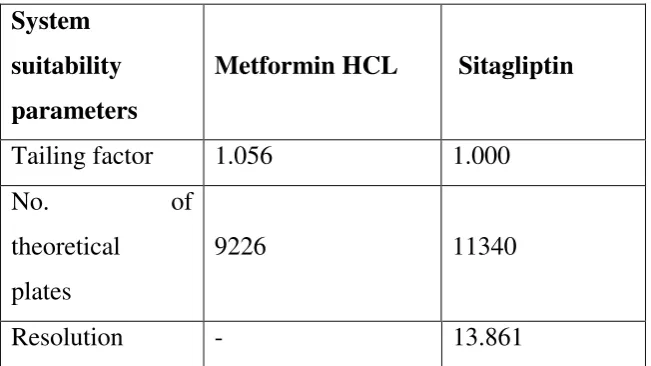
SYSTEM SUITABILITY SPECIFICATION AND TESTS
The accuracy and precision of HPLC data collected begin with a well
behaved chromatographic system. The system suitability specifications and
tests are parameters that provide assistance in achieving this purpose.
It consists of following factors:
1. Capacity factor
2. Precision\Injection repeatability
3. Relative retention
4. Resolution
5. Tailing factor
6. Theoretical plate number
1. Capacity factor (K’)
K’ = (tR-tO/tf)
The capacity factor is a measure of where the peak of interest is located
with respect to the void volume i.e., elution time of the non retained
components.
2. Precision/Injection repeatability (RSD)
Injection precision expressed as RSD (relative standard deviation)
indicates the performance of the HPLC which includes the pumping, column
and the environmental conditions, at the time the samples are analyzed .It
should be noted that sample preparation and manufacturing variations are not
considered.
3. Relative retention (α)
α = K’1/K’2
Relative retention is a measure of the relative location of two peaks.
This is not an essential parameter as long as the resolution (Rs) is stated.
4. Resolution (Rs)
Rs is a measure of how well two peaks are separated. For reliable
quantitation well separated peaks are essential for quantitation. This is a very
useful parameter if potential inference peaks (s) may be concern.
5. Tailing factor
T = Wx/2f
The accuracy of quantitation decreases with increases in peak
tailing because of the difficulties encountered by the integrator in determine
where/when the peak ends and hence the calculation of the area under the peak.
Integrator variables are present by the analyst for optimum calculation of the
area for the peak of interest. If the integrator is unable to determine exactly
when an upslope for down slope occurs, accuracy drops.
6. Theoretical plate number (N)
N = 16(tR/tw) 2 = L/H
Theoretical plate number is a measure of column efficiency,
that is, how many peaks can be located per unit run-time of the chromatograph.
N- Constant for each peak on the chromatogram with a fixed set of
operating conditions.
H- Height equivalent of a theoretical plate.
LITERATURE REVIEW
K.S. LAKSHMI et al., (2009) have been developed a simple, sensitive
and rapid reverse phase high performance liquid chromatographic method was
developed for the estimation of Metformin Hcl (MET) and Pioglitazone (PIO)
in pure and in pharmaceutical dosage forms. A Gemini C18 column (150x4.6mm, 5μ) was used with a mobile phase containing a mixture of Acetonitrile and Ammonium Acetate buffer (pH-3) in the ratio of 42: 58. The
flow rate was 0.3ml/min and effluents were monitored at 255nm and eluted at
5.17min (MET) and 8.1min (PIO). Calibration curve was plotted with a range
from 0.5-50 μg/ml for MET and 0.3-30 μg/ml for PIO. The assay was validated
for the parameters like accuracy, precision, robustness and system suitability
parameters. The proposed method can be useful in the routine analysis for the
determination on metformin and pioglitazone in pharmaceutical dosage forms.
S Havele et al., (2010) have developed a simple, rapid, and precise
reversed-phase high-performance liquid chromatographic method for
simultaneous analysis of metformin hydrochloride, gliclazide, and pioglitazone
hydrochloride in a tablet dosage form has been developed and validated.
Chromatography was performed on a 25 cm × 4.6 mm i.d.,
5-column with 85:15 (v/v) methanol: 20 mM potassium dihydrogen phosphate
buffer as mobile phase at a flow rate of 1.2 ml/min. UV detection at 227 nm;
metformin hydrochloride, gliclazide, and pioglitazone hydrochloride were
eluted with retention times of 2.15, 3.787, and 4.57 min, respectively. The
method was validated in accordance with ICH guidelines. Validation revealed
the method is specific, rapid, accurate, precise, reliable, and reproducible.
Calibration plots were linear over the concentration ranges 50–
metformin hydrochloride, 3.0 – r gliclazide, and 2–
pioglitazone hydrochloride. Limits of detection were 0.20, 0.04, and 0.10
metformin hydrochloride, gliclazide, and pioglitazone hydrochloride,
suitability of the method for simultaneous analysis of the three drugs in tablets.
Statistical analysis proves that the method is suitable for the analysis of
metformin hydrochloride, gliclazide, and pioglitazone hydrochloride as a bulk
drug and in pharmaceutical formulation without any interference from the
excipients. It may be extended to study the degradation kinetics of three drugs
and also for its estimation in plasma and other biological fluids
G Mubeen et al., (2010) have been developed a simple
Spectrophotometric method has been developed and validated for the
estimation of Metformin hydrochloride in bulk and in tablet formulation. The
primary amino group of Metformin hydrochloride was oxidized using
hydrogen peroxide to form a yellow chromogen , which is determined
spectrophotometrically at 400 nm. It obeyed Beer’s law in the range of
4-26mcg/ml.The percentage recovery of the drug for the proposed method ranged
from 99-101.3% indicating no interference of the tablet excipients. The
proposed method was found to be accurate and precise for routine estimation of
Metformin hydrochloride in bulk and in tablet dosage forms.
MARIA-CRISTINA RANETTI et al., (2009) have been developed a
simple HPLC method for the simultaneous determination of metformin (MTF)
and gliclazide (GCZ) in the presence of glibenclamide, in human plasma, for
the clinical monitoring of MTF and GCZ after oral administration or for
bioequivalence studies. Ion-pair separation followed by UV detection
performed on deproteinised plasma samples was chosen for the determination
of metformin and gliclazide.The mobile phase was acetonitrile: methanol
(1:1v/v) and sodium dodecylsulphate 5mM, pH=3.5 with H3PO4 85% and
gradient elution. The eluent was monitored at 236 nm. The calibration curve
was linear within the range of 0.05-5.00 μg/mL (r2=0.99, n=6). The lowest
limit of quantification (LLOQ) was 50 ng/mL for metformin and 49 ng/mL for
gliclazide.The proposed method was validated and proved to be adequate for
metformin and gliclazide clinical monitoring, bioavailability and
DRUG PROFILE METFORMIN HCL Structure
N
C
H
3
NH
N
H
NH
2
CH
3
NH
Molecular Formula : C14H11N5.HCL
Molecular weight : 165.62g/mol
IUPAC Name : :N,N-dimethylimidodicarbonimidic diamide
Solubility : Freely soluble in water; slightly soluble in
Ethanol;
Category : Anti -diabetic
Mechanism of action:
Metformin improves hyperglycemia primarily through its suppression of
hepatic glucose production (hepatic gluconeogenesis. The "average" person
with type 2 diabetes has three times the normal rate of gluconeogenesis;
metformin treatment reduces this by over one third. Metformin activates
AMP-activated protein kinase (AMPK), a liver enzyme that plays an important role
in insulin signaling, whole body energy balance, and the metabolism of glucose
and fats, activation of AMPK is required for metformin's inhibitory effect on
the production of glucose by liver cells. Research published in 2008 further
elucidated metformin's mechanism of action, showing activation of AMPK is
required for an increase in the expression of SHP, which in turn inhibits the
expression of the hepatic gluconeogenic genes PEPCK and Glc-6-Pase.
Metformin is frequently used in research along with AICAR as an AMPK
agonist. The mechanism by which biguanides increase the activity of AMPK
remains uncertain; however, research suggests that metformin increases the
amount of cytosolic AMP (as opposed to a change in total AMP or total
AMP/ATP.
Adverse effects:
The most common adverse effect of metformin is gastrointestinal
upset, including diarrhea, cramps, nausea, vomiting and increased flatulence;
metformin is more commonly associated with gastrointestinal side effects than
SITAGLIPTIN
Structure:
N N N
N
O
F F
F
F
F F
NH
2
Molecular formulae : C16H15F6N5O
Molecular Weight : 407.314
IUPAC Name : (R)-4-oxo-4-[3-(trifluoromethyl)-5,6
dihydro[1,2,4]triazolo[4,3-a]pyrazin
7(8H)-yl]-1-(2,4,5-)butan-2-amine.
Category : Antidabetic
Dose : 25 to 100 mg.
Solubility : Soluble inwater and N,N Dimethyl formamide;
PHARMACOLOGY:
Mechanism of action:
Sitagliptin works to inhibit the enzyme dipeptidyl peptidase 4 (DPP-4).
This enzyme breaks down the incretins GLP-land GIP, gastrointestinal
hormones released in response to a measure. By preventing GLP-1 and GIP
inactivation, they are able to potentiate the secretion of insulin and suppress the
release of glucagon by the pancreas. This drives blood glucose levels towards
normal. As the blood glucose level approaches normal, the amounts of insulin
released and glucagon suppressed diminishes, thus tending to prevent an
"overshoot" and subsequent low blood sugar (hypoglycemia) which is seen
with some other oral hypoglycemic agents
Side effects:
The most common side effects of sitagliptin are abdominal pain, nausea
diarrhea, vomiting and hypoglycemia. Lactic acidosis is a serious side effect of
metformin that occurs in one out of every 30,000 patients and is fatal in 50% of
cases. The symptoms of lactic acidosis are weakness, trouble breathing,
abnormal heartbeats, unusual muscle pain stomach discomfort,
light-headedness and feeling cold. Patients at risk for lactic acidosis include those
with reduced function of the kidneys or liver, congestive heart failure severe
acute illnesses, and dehydration.
AIM AND PLAN OF WORK
The drug analysis is playing an important role in the development of
drugs, their manufacture and therapeutic use. For the simultaneous estimation
of drugs present in dosage forms , lot of suitable methods are adopted like uv –
spectrophotometer , HPLC , HPTLC etc .These methods are powerful and
rugged method .They are also extremely precise, specific, accurate, linear and
rapid.
A pharmaceutical industry depends upon quantitative chemical analysis
to ensure that the raw material used and the final product obtained meets the
required specification. The drugs will occur as a single component or multi
component dosage forms. The later proves to be effective due to its combined
mode of action on the body.
The number of drugs or drug formulations introduced into the market is
increasing at a fast rate .These may be either new entries in the market or
structural modification of the existing drugs or novel dosage forms or multi
component dosage forms .The complexity in the dosage forms, including that
of the multi component dosage forms creates considerable challenges to the
analytical chemist during the development of assay procedure for its accurate
estimation. The estimation of individual drugs in these multi component dosage
forms becomes difficult due to tedious extraction or isolation procedure.
The combination of Metformin HCL and Sitagliptin was selected for the
present study.
According to the literature survey conducted, it was observed that no
method was reported in RP-HPLC for the estimation of individual drug carried
out. Hence present study aims to develop an accurate, precise, specific, linear,
simple, rapid, validated and cost effective analytical method for Metformin
HCL and Sitagliptin in tablet dosage form by RP-HPLC method. The scope of
RP-HPLC method development was obtained as
Selection and optimization of mobile phase and stationary phase.
Selection of detector wavelength.
Selection of extraction procedure.
Optimization of chromatographic condition.
Estimation of Metformin HCL and Sitagliptin
Method validation.
MATERIALS AND METHODS
Instrumentation:
S.No. Name of instrument Model Make
1 Semi micro balance CPA225D Sartorius
2 pH meter Metler Toledo Thermo Orion
3 HPLC LC-20 AT Shimadzu
4 C 18 Column Phenomenex Gemini
5 Sonicator USB Spectro lab
6 UV 1700 series Shimadzu
Chemicals and reagents:
S.No. Chemicals/Reagents Make/grade
1 Glacial acetic acid Merck(HPLC Grade)
2 Dipotassium hydrogen phosphate Merck(GR Grade)
3 Methanol Merck(GR Grade)
Working/Reference Standards:
S.No Name of Working/reference standards % Purity
1 Metformin HCL Working standard 99.65
2 Sitagliptin Working standard 99.61
Filters:
S
.No Name of the filter
1. 0.45 m GHP membrane filter(Manufactured by PALL)
METHOD DEVELOPMENT GUIDE
Information on sample, define separation goals.
Need for special procedure, sample treatment.
Choose detector and detector settings.
Choose the method: preliminary run: estimate the best separation condition
Optimize separation conditions.
Validate the method.
Table-1
Goal Comment
Resolution Precise and rugged quantitative analysis requires that Rs
be greater than 1.5.
Separation time <5-10 min is desirable for routine procedures
Quantitation
≤2% for assays ;≤5% for less demanding analysis
≤15% for trace analyses.
pressure <150 bar is desirable, <200 bar is usually essential (new column assumed).
Peak height Narrow peaks are desirable for large signal /noise ratios.
Solvent
consumption Minimum mobile-phase use per run is desirable.
POLARITY OF COMMON ORGANIC FUNCTIONAL GROUPS AND
SOLVENTS
Functional Groups Non-Polar Solvent
Aliphatic hydrocarbons Hexane
Olefines Carbon tetrachloride
Aromatic hydrocarbons Ester
Halides Benzene
Sulphides Methyl chloride
Ethers THF
Nitro components Isopropanol
Esters, aldehydes, ketones Chloroform
Alcohols, amines Ethylacetate
Sulphones Acetonitrile
Sulphoxides Methanol
Amides Water
Carboxylic acids
Polar
OPTIMIZATION OF CHROMATOGRAPHIC CONDITIONS
1. Selection of wavelength for detection of components
Solution of Metformin HCL and Sitagliptin were scanned in the UV
region and spectrum was recorded .The solvent used was 0.02M dipotassium
hydrogen phosphate,and acetonitrile in the ratio 55:45. It was seen that at
260nm all compounds have good absorbance, which can be used for the
estimation of compounds by HPLC.
2. Selection of chromatographic method
Proper selection of the method depends on the nature of the sample
(ionic or ionisable or neutral molecules), its molecular weight, pka value and
stability .The drugs selected in the present study are polar and so reversed
phase or ion exchange chromatography can be used. The reverse phase HPLC
was selected for the initial separation because of its simplicity and suitability.
For the literature survey and with knowledge of properties of the
selected drugs, Phenominex Gemini C18 (250 × 4.6mm) 5µ column was
chosen as stationary phase and mobile phase with different compositions such
as Acetonitrile was used. The separations were not observed so use of buffer
was finalized.
For all the data observed, obtained and available the initial separation
condition were set to work around.
3. Initial separation condition
The following chromatographic conditions were fixed initially to
improve the separation of both drugs.
Instrument : Shimadzu prominence
Column : Phenomenex Gemini C18 (250 × 4.6mm), 5µ.
Column oven temperature : Ambient
Wavelength : 260nm
Flow rate : 1.2ml/min
Injection volume : 20µl
Run time : 10 min
Mobile phase : Solvent A - Buffer
Solvent B - Methanol
Solvent C - Acetonitrile
Solvent Ratio : 30:35:35% V/V of A: B: C
TRAILS
Trail-1
The trail was performed using Mobile phase in the ratio 30:35:305using
Phenomenex C18 (250 x 4.6 mm, 5μ) with flow rate of 1.2ml/min.
In this trail, the retention time ofMetformin HCL and Sitagliptin peak
was found to be 0.9, and 4.0 min respectively.
Trail-2
The trail 2 was performed using Mobile phase in the ratio 30:40:30 using
In this trail, the retention time of Metformin HCL and Sitagliptin peak
was found to be 0.7 and2.4 min. respectively.
Trail-3
The trail 3 was performed using Mobile phase in the ratio 55:45of using
Phenomenex C18 (250 x 4.6 mm, 5 μ) with flow rate of 1 ml/min.
In this trail, the retention time of Metformin HCL and Sitagliptin peak was
found to be 4.28and 7.485min respectively.
Trial-4:
The trail 4 was performed using Mobile phase in the ratio of 40:40
:20using Phenomenex (250 x 4.6 mm, 5 μ) with flow rate of 1 ml/min.
In this trail, only two peaks were shown at 2 and 3.2 min.
Out of 4 trails made in the lab, the 3th trail was selected for further studies
because when compared to other trails, the 3th trail was found to be having less
retention time and within the acceptance criteria.
4. Effect of ratio of mobile phase
Under the chromatographic conditions mentioned above the different
ratios of mobile phase were tried .The chromatograms where observed for each
of the trials, out of which 30: 35:35 i.e.; 30 Buffer: 35 Methanol: 35
Acetonitrile was selected as the separation was achieved in minimum retention
time.
5. Effect of pH of mobile phase
Several trials were made using different buffer solutions of pH range
.The best separation was achieved when adjusted the pH to 4.5 with
6. Effect of flow rate on separation
The mobile phase consisting of buffer: methanol: acetonitrile was used
and the chromatograms were recorded at flow rates of 1ml/min, 1.2ml/min. The
sharpest peaks were obtained with 1.5ml/min flow rate.
7. Effect of column (stationary phase) on separation
At the chromatographic conditions of mixed solutions, combination of
Metformin HCL and Sitagliptin were injected and chromatograms were
obtained using C-18 columns.
8. Reference standards
Keeping all other above fixed conditions, external standard was used.
9. Optimized condition
The following optimized parameters were used in a final method for the
simultaneous estimation of Metformin HCL and Sitagliptin.
Instrument : Shimadzu Prominence
Column : Phenominex C18 (250 × 4.6mm), 5µ.
Column oven temperature : Ambient
Wavelength : 260nm
Flow rate : 1ml/min
Injection volume : 20µl
Run time : 10 min
Mobile phase : Solvent A - Buffer
Solvent B- Acetonitrile
Solvent Ratio : 55:45% V/V of A: B
QUANTITATION
Samples obtained from local market.
Metformin HCL -500mg
Sitagliptin-50mg
Preparation of Dipotassium hydrogen phosphate buffer pH 4.5:
Prepare about 0.02M dipotassium hydrogen phosphate in a suitable
conical flask and adjust the pH to 4.5 with orthophosphoric acid.(0.02M of di
potassiumhydrogen phosphate is prepared by taking 1.3602mg of
dipotassiumhydrogen phosphate in a volumetric flask , and make up to 1L with
water).
Preparation of mobile phase:
Prepare a mixture of buffer 4.5 pH, and acetonitrile in the ratio 55:45
filter through 0.45µ membrane filter and degas it.
Diluent preparation: Buffer 4.5 pH, and acetonitrile in the ratio 55:45
Standard preparation:
Weigh accurately about 50mg of Metformin, 50mg Sitagliptin
working standard to a 100ml volumetric flask.Dissolve it completely and
sonicate it. Make up to 100ml mobile phase. Take 3ml from the above flask
and make up to 50ml with mobile phase.
Sample preparation:
Weigh accurately 20 tablets equivalent to 92.4mg to a 100ml
volumetric flask.mobile phase to dissolve it completely and sonicate for 10min
with intermediate shaking Make up to 100ml with mobile phase and filter
Calculation:
Determine the % amount of Metformin HCL and Sitagliptin
in tablets according to the following formula.
AT ×W R × 3 × 100 × 50 × PR × Average Weight
%Assay = × 100
AR × 100 × 50 × WT × 3 × 100 × LA
Where,AT = Area in the test solution
AR = Area in the standard solution
WR = Weight of standard solution (mg)
WT = Weight of sample in test preparation (mg)
PR = Purity of working standard (%)
LA = Labeled amount of Metformin HCL and Sitagliptin per Tablets.
VALIDATION OF THE DEVOLOPED METHOD
SPECIFICITY
Specificity is the ability to measure accurately and specifically the
analyte of interest in the presence of other components that may be expected to
be present in the sample matrix. The other component may include excipients,
impurities, degradation product etc.
Peak purity test may be useful to show that the analyte chromatographic
peak is not contributed by more than one component (e.g. .diode array, mass,
Standard preparation:
Weigh accurately about 50mg of Metformin, 50mg
Sitagliptin working standard to a 100ml volumetric flask.Dissolve it completely
and sonicate it. Make up to 100ml mobile phase. Take 3ml from the above
flask and make up to 50ml with mobile phase.
Table - 2
Sample Metformin HCL Sitagliptin
Avg area %Drug
Content Avg area
%Drug
Content
Standard 352.914
100.18
440.46
99.67
Sample 354.469 436.16
Acceptance Criteria:
There is no interference in the standard peak.
LINEARITY:
Linearity is the ability of the method to elicit test results that are directly
proportional to analyte concentration within a given range.
Linearity is generally reported as the variance of the slope of the
regression line. Linearity should be evaluated by visual inspection of a plot of
signal as a function of analyte concentration. The correlation coefficient,
y-intercept, slope of the regression line and the residual sum of squares should be
Linearity of Metformin HCL and Sitagliptin
Weigh accurately about 50mg of Metformin, 50mg Sitagliptin working
standard to a 100ml volumetric flask.Dissolve it completely and sonicate it.
Make up to 100ml mobile phase. Take 3ml from the above flask and make up
to 50ml with mobile phase.
Table - 3
LEVEL Metformin Sitagliptin
80% 1773.542 164.743
90% 1996.980 1848.657
100% 2221.836 2053.140
110% 2466.998 2251.260
120% 2663.495 2478.061
Y – intercept 1548 1430
Slope 22.48 207.7
Correlation
Coefficient 0.999 0.999
Linearity Graph
RANGE:
Range is the interval between the upper and the lower levels of analyte
that have been demonstrated to be determined with precision, accuracy and
linearity using the method.
The range is normally expressed in the same unit as the test results
[image:44.595.120.515.220.522.2]concentration levels, along with certain minimum specified ranges .For assay
tests the minimum specified range is 80 – 120%of the target concentration .
Preparation of working standard solution
To get a concentration of 80%, 100%, 120%, of drug, pipette out 4ml,
5ml, 6ml, of mixed standard stock solution into separate 100ml volumetric
flask and volume is made up with mobile phase. Further dilute 3ml of the
solution to 100ml of mobile phase.
Acceptance Criteria:
The %RSD for the individual recoveries of each level and mean
recovery should not be more than 2.0%.
The % recovery at each level and mean recovery should be in
between 98.0% to 102.0%.
LIMIT OF DETECTION (LOD)
The limit of detection (LOD) is defined as the lowest concentration
of an analyte in a sample that can be detected, though not necessarily
quantitated. It is a limit test that specifies whether or not an analyte is above or
below a certain value.
ICH has recommended some method for determining the limit of
detection. The method may be either instrumental or non-instrumental. They
are
Visual Evaluation
Signal – to – Noise ratio convention
Based on Standard deviation of the response and the slope of
calibration curve
Limit of detection (LOD) based on standard deviation of the response and
3.3 s
LOD =
S
Where
s = Standard deviation of the response
S = Slope of calibration curve
[image:46.595.101.433.372.432.2]
Table - 4
Limit of detection study:
LOD Metformin HCL:(µg) Sitagliptin(µg)
1. 1.05 7.12
LIMIT OF QUANTITATION (LOQ)
The limit of Quantitation (LOQ) is defined as the lowest concentration
of the analyte in a sample that can be determined with acceptable precision and
accuracy under the stated operational conditions of the method.
Limit of Quantitation (LOQ) is also based on standard deviation of
the response and the slope of calibration curve.
10 s
LOQ =
S
s = Standard deviation of the response
S = Slope of calibration curve
Table - 5
Limit of Quantitation study:
LOQ Metformin HCL(µg) Sitagliptin(µg)
1. 5.6 3.5
PRECISION
Precision is the measure of the degree of repeatability of an analyte
method under normal operation and is normally expressed as percent relative
standard deviation for a significant number of the samples.
According to the ICH precision should be performed at three
different levels: Repeatability, Intermediate precision, Reproducibility
System precision
The system precision was evaluated by measuring the peak response of
Metformin HCL and Sitagliptin Hydrochlorothiazide, WS solution prepared as
per the proposed method and chromatograms were recorded.
Determination
Weigh accurately about 50mg of Metformin,
50mg Sitagliptin working standard to a 100ml volumetric flask.Dissolve it
completely and sonicate it. Make up to 100ml mobile phase. Take 3ml from the
s.no Metformin Sitagliptin
1 2051.31 2218.08
2 2061.14 2228.22
3 2047.51 2230.72
4 2055.83 2229.53
5 2043.94 2212.8
6. 2039.57 2217.84
AVG 2049.88 2222.86
STD/%RSD 0.33/0.33 0.37/0.38
Method Precision
Weigh accurately 20 tablets equivalent to 92.4mg to a 100ml volumetric
flask.mobile phase to dissolve it completely and sonicate for 10min with
intermediate shaking Make up to 100ml with mobile phase and filter through
[image:48.595.101.531.48.380.2]0.45µ GHP filter. Further dilute 3ml with 50ml mobile phase.
Table - 6
Method Precision for Metformin HCL:
Sample. No % Assay
Sample Preparation – 1 100.14
Sample Preparation – 2 100.1.8
Sample Preparation – 3 100.71
Sample Preparation – 5 100.51
Sample Preparation – 6 100.56
Avg 100.76
SD 0.688
% RSD 0.70
[image:49.595.132.503.50.188.2]
Table - 7
Method Precision for Sitagliptin:
Sample. No % Assay
Sample Preparation – 1 97.67
Sample Preparation – 2 98.60
Sample Preparation – 3 97.62
Sample Preparation – 4 98.65
Sample Preparation – 5 97.20
Sample Preparation – 6 97.24
Avg 97.80
SD 0.712
% RSD 0.730
Acceptance Criteria:
The % RSD for the individual recoveries of each level and mean
recovery should not be more than 2 %.
The % recovery at each level and mean recovery should be in between
ACCURACY
Accuracy is the measure of exactness of an analytical method, or the
closeness of agreement between the measured value and the value that is
accepted either as a conventional, true value or an accepted reference value.
The accuracy may be determined by application of analytical method to
an analyte of known purity (example: reference standard) and also by
comparing the results of the method those obtained using an alternative
procedure that has been already validated.
To document accuracy, the ICH guideline on methodology recommends
collecting data from a minimum of nine determinations over a minimum of
three concentration levels covering the specified range.
Result: Refer range of calculations.
Preparation of working standard solution
To get a concentration of 80%, 100%, 120% of drug, pipette out 4ml,
5ml, 6ml, of mixed standard stock solution into separate 100ml volumetric
flask and volume is made with mobile phase. Further dilute 3ml this solution to
Recovery values of Sitagliptin
Table 8
Concentration Avg Area Amount
Recovery % Recovery
80 1679.874 3.96 99.78
100 2086.258 4.96 99.24
120 2565.329 6.08 101.18
Mean 100.06
SD 0.79
%RSD 0.79
Table – 9
Recovery values of Metformin
Concentration Avg Area Amount
Recovery % Recovery
80 1777.467 39.89 99.93
100 2210.760 49.50 99.05
120 2694.174 59.99 100.03
Mean 99.66
SD 0.44
Acceptance Criteria:
The % RSD for the individual recoveries of each level and mean
recovery should not be more than 2 %.
The % recovery at each level and mean recovery should be in between
98.0% to 102%.
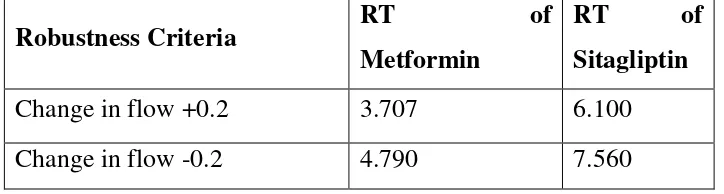
ROBUSTNESS
Robustness is the capacity of a method to remain unaffected by small
deliberate variations in method parameters.
The robustness of a method is evaluated by varying method parameters
such as percent organic solvent, pH, ionic strength or temperature and
determining the effect on the results of the method. Robustness tests were
generally introduced to avoid problems in linear laboratory studies and to
identify the potentially responsible factors.
Determination of robustness
Robustness was performed by varying the
- PH
[image:52.595.136.498.654.751.2]- Flow rate
Table - 10
Robustness study for Metformin HCL and Sitagliptin:
Robustness Criteria RT of Metformin
RT of
Sitagliptin
Change in flow +0.2 3.707 6.100
Change in wavelength by -PH 4.27 7.44
Change in wavelength by + PH 4.28 7.48
Acceptance Criteria:
Shall comply the system suitability parameters.
Measured variation to be reported with appropriate recommendations
RUGGEDNESS
Ruggedness of analytical method is the degree of reproducibility of the
results obtained by the analysis of the same samples under a variety of test
conditions such as different laboratories, analysts, instruments, temperature,
different days etc.
Determination of Ruggedness
The Ruggedness of an analytical method was determined by the
analysis of aliquots from homogenous lots in different laboratories by different
analysts using operational and environmental condition that may differ but are
still within the specified parameters of the assay. The degree of reproducibility
of the results is then determined as a function of assay variables. This
reproducibility may be compared to the precision of assay under nor