BIS RESEARCH PAPER NUMBER 286
Returns to Maths and English Learning (at level 2 and below) in Further Education
Augusto Cerqua and Peter Urwin
The views expressed in this report are the authors’ and do not necessarily reflect those of the Department for Business, Innovation and Skills.
Department for Business, Innovation and Skills, 1 Victoria Street London SW1H 0ET
Contents
List of Tables ... 4
Executive Summary ... 9
1. Introduction ... 15
2. Data and Method ... 17
2.1 Creation of the ILR-WPLS dataset ... 17
2.2 Econometric Analysis ... 17
3. Maths and/or English as Complementary Learning ... 21
3.1 L1/L2 Maths and/or English returns for FL2, FL3 and other Achiever Populations ... 21
3.2 Disaggregation of Maths and English returns by Sector ... 30
4. Maths and English as a Highest Learning Aim ... 38
4.1 Findings for Amalgamated Groups of Entry Level/L1/L2 English and/or Maths learning ... 39
4.2 Disaggregated Entry Level/L1/L2 Maths and/or English returns ... 43
4.3 L1/L2 Maths and/or English as routes to further FE learning ... 48
5. Conclusion ... 53
5. Appendix ... 56
5.1 L1/L2 Numeracy and/or Literacy Certificates and Key Skills ... 56
5.2 L1/L2 English and/or Maths learners in Populations of FL2 or FL3 achievers ... 59
5.3 Entry Level/L1/L2 Maths and/or English returns, within Below Level 2 and L2 highest aim populations, by age ... 62
5.4 Returns to L1/L2 English and/or Maths learners within disaggregated populations of Full Level 2 and Full Level 3 Achievers. ... 69
List of Tables
Table 1: Returns to daily earnings for L1/L2 English and/or Maths achievers [within populations of (i) FL2 (ii) L3 (iii) FL3 and (iv) L4+ achievers] ... 21 Table 2: Estimated employment probability premiums for L1/L2 English and/or Maths
achievers [for populations of (i) FL2 (ii) L3 (iii) FL3 and (iv) L4+ achievers] ... 24 Table 3: Returns to daily earnings for L1/L2 English and/or Maths achievers [for a
population of FL2 achievers] ... 25 Table 4: Estimated employment probability premiums for L1/L2 English and/or Maths
achievers [for populations of FL2 achievers] ... 26 Table 5: Returns to daily earnings for L1/L2 English and/or Maths achievers [for a
population of FL3 achievers] ... 27 Table 6: Estimated employment probability premiums for L1/L2 English and/or Maths
achievers [for populations of FL3 achievers] ... 28 Table 7: Estimated probability of Ll/L2 English and/or Maths achievers being on active
benefits, compared to non-achievers [for a population of FL2 achievers] ... 29 Table 8: Estimated probability of L1/L2 English and/or Maths achievers being on active
benefits, compared to non-achievers [for a population of FL3 achievers] ... 30 Table 9: Estimated earnings premium for L2 English and/or Maths Achievers, by Sector
Subject [for the population of Full Level 2 Achievers] ... 31 Table 10: Estimated probability of L1 English and/or Maths Achievers being on Active
Benefits, compared to non-achievers, by Sector Subject [for the population of Full Level 2 Achievers] ... 35 Table 11: Estimated probability of L2 English and/or Maths Achievers being on Active
Benefits, compared to non-achievers, by Sector Subject [for the population of Full Level 2 Achievers] ... 35 Table 12: Estimated probability of L2 English and/or Maths Achievers being on Active
Benefits, compared to non-achievers, by Sector Subject [for the population of Full Level 3 Achievers] ... 36 Table 13: Sub-categories of highest learning aim, within ‘Below Level 2’ and ‘L2’ ... 38 Table 14: Daily earnings premium for English and/or Maths achievers, relative to
non-achievers: within the Below Level 2 and L2 highest aim populations ... 40 Table 15: Employment Probability premiums for English and/or Maths achievers, relative
to non-achievers: within Below Level 2 and L2 highest aim populations ... 40 Table 16: Daily earnings premium for English and/or Maths achievers (aged 19-24),
Table 18: Employment Probability premiums for English and/or Maths achievers (aged 19-24), relative to non-achievers: within the Below Level 2 and L2 highest aim populations... 42 Table 19: Employment Probability premiums for English and/or Maths achievers (aged
25+), relative to non-achievers: within the Below Level 2 and L2 highest aim populations... 43 Table 20: Daily earnings premiums for achievers V non-achievers, for sub-divisions of the Below Level 2 and L2 highest aim populations ... 44 Table 21: Employment probability premiums for achievers V non-achievers, for
sub-divisions of the Below Level 2 and L2 highest aim populations ... 46 Table 22: Estimated probability of Achievers being on Active Benefits, compared to
non-achievers, for sub-divisions of the Below Level 2 and L2 highest aim
populations... 47 Table 23: Proportion of L1 English and/or Maths Achievers and Non-achievers (aged 19
to 24) progressing into continued FE learning... 49 Table 24: Proportion of L1 English and/or Maths Achievers and Non-achievers (aged 25+)
progressing into continued FE learning ... 50 Table 25: Proportion of L2 English and/or Maths Achievers and Non-achievers (aged 19
to 24) progressing into continued FE learning... 51 Table 26: Proportion of L2 English and/or Maths Achievers and Non-achievers (aged 25+)
progressing into continued FE learning ... 52 Table 27: Returns to daily earnings for L1/L2 Literacy and/or Numeracy achievers [for a
population of FL2 achievers] ... 56 Table 28: Returns to daily earnings for subgroups of L1/L2 Literacy and/or Numeracy
achievers [for population of L3 achievers] ... 57 Table 29: Returns to daily earnings for subgroups of L1/L2 Literacy and/or Numeracy
achievers [for population of FL3 achievers]... 58 Table 30: Returns to daily earnings for subgroups of L1/L2 Literacy and/or Numeracy
achievers [for population of L4+ achievers] ... 58 Table 31: Numbers with learning aims in L1/L2 English and/or Maths amongst the
population of FL2 achievers, by sector subject category ... 59 Table 32: Numbers with learning aims in L1/L2 English and/or Maths amongst the
population of FL3 achievers, by sector subject category ... 60 Table 33: Raw employment and benefit proportions for Entry-level/L1/L2 achievers and
non-achievers within populations of FL2 and FL3 achievers ... 61 Table 34: Raw employment and benefit proportions for Entry-level/L1/L2 achievers and
non-achievers with highest learning aims in English and/or Maths ... 62 Table 35: Daily earnings premiums for achievers V non-achievers, for sub-divisions of the Below Level 2 and L2 highest aim populations (aged 19-24) ... 63 Table 36: Estimated employment probability premium for achievers V non-achievers, for
Table 37: Estimated probability of Achievers being on Active Benefits, compared to non-achievers, for sub-divisions of the Below Level 2 and L2 highest aim
populations (aged 19-24) ... 65 Table 38: Daily earnings premium for achievers V non-achievers, for sub-divisions of the
Below Level 2 and L2 highest aim populations (aged 25+) ... 66 Table 39: Estimated employment probability premium for achievers V non-achievers, for
sub-divisions of the Below Level 2 and L2 highest aim populations (aged 25+) ... 67 Table 40: Estimated probability of Achievers being on Active Benefits, compared to
non-achievers, for sub-divisions of the Below Level 2 and L2 highest aim
populations (aged 25+) ... 68 Table 41: Returns to daily earnings for L1/L2 English and/or Maths achievers [for a
population of FL2 achievers – Classroom-based learning] ... 69 Table 42: Estimated employment probability premiums for L1/L2 English and/or Maths
achievers [for populations of FL2 achievers – Classroom-based learning] ... 70 Table 43: Estimated probability of Ll/L2 English and/or Maths achievers being on active
benefits, compared to non-achievers [for a population of FL2 achievers –
Classroom-based learning] ... 71 Table 44: Returns to daily earnings for L1/L2 English and/or Maths achievers [for a
population of FL3 achievers – Classroom-based learning] ... 72 Table 45: Estimated employment probability premiums for L1/L2 English and/or Maths
achievers [for populations of FL3 achievers – Classroom-based learning] ... 73 Table 46: Estimated probability of Ll/L2 English and/or Maths achievers being on active
benefits, compared to non-achievers [for a population of FL3 achievers –
Classroom-based learning] ... 74 Table 47: Returns to daily earnings for L1/L2 English and/or Maths achievers [for a
population of FL2 or FL3 achievers – Classroom-based learning] ... 75 Table 48: Estimated employment probability premiums for L1/L2 English and/or Maths
achievers [for populations of FL2 or FL3 achievers – Classroom-based learning] ... 76 Table 49: Estimated probability of L1/L2 English and/or Maths achievers being on active
benefits, compared to non-achievers [for a population of FL3 achievers –
Classroom-based learning] ... 76 Table 50: Returns to daily earnings for L1/L2 English and/or Maths achievers [for a
population of FL2 achievers – Apprenticeships] ... 77 Table 51: Estimated employment probability premiums for L1/L2 English and/or Maths
achievers [for populations of FL2 achievers – Apprenticeships] ... 78 Table 52: Estimated probability of Ll/L2 English and/or Maths achievers being on active
benefits, compared to non-achievers [for a population of FL2 achievers –
Apprenticeships] ... 79 Table 53: Returns to daily earnings for L1/L2 English and/or Maths achievers [for a
Table 54: Estimated employment probability premiums for L1/L2 English and/or Maths achievers [for populations of FL3 achievers – Apprenticeships] ... 81 Table 55: Estimated probability of L1/L2 English and/or Maths achievers being on active
benefits, compared to non-achievers [for a population of FL3 achievers –
Apprenticeships] ... 82 Table 56: Returns to daily earnings for L1/L2 English and/or Maths achievers [for a
population of FL2 or FL3 achievers – Apprenticeships] ... 83 Table 57: Estimated employment probability premiums for L1/L2 English and/or Maths
achievers [for populations of FL2 or FL3 achievers – Apprenticeships] ... 84 Table 58: Estimated probability of L1/L2 English and/or Maths achievers being on active
benefits, compared to non-achievers [for a population of FL3 achievers –
Apprenticeships] ... 84 Table 59: Daily earnings premium for IT achievers, relative to non-achievers: within the
Below Level 2 and L2 highest aim populations ... 85 Table 60: Employment Probability premiums for IT achievers, relative to non-achievers:
%,6([SHUW3HHU5HYLHZIRU
(YDOXDWLRQ
7KH%,6([SHUW3HHU5HYLHZ*URXSIRU(YDOXDWLRQUHYLHZVDOO%,6LPSDFWHYDOXDWLRQ
SXEOLFDWLRQVDQGSURYLGHVDQLQGHSHQGHQWDVVHVVPHQWRIWKHPHWKRGRORJLFDOTXDOLW\RIWKH HYDOXDWLRQ
7KLVSXEOLFDWLRQZDVSHHUUHYLHZHGE\3URI$QQD9LJQROHVDQG'U6WHYHQ0F,QWRVK
<RXFDQILQGWKHSHHUUHYLHZHUV¶DVVHVVPHQWRQWKH*298.ZHEVLWH
KWWSVZZZJRYXNJRYHUQPHQWFROOHFWLRQVELVUHVHDUFKSDSHU
Executive Summary
Background
Previous work identifies good labour market returns for FE learners who gain qualifications at Full Level 2 and above - summarised in Figure 1 below. (Bibby, Buscha, Cerqua,
Thomson and Urwin (2014) - from here referred to as BBCTU). For instance, a learner who achieves a full Level 2 (FL2)1 qualification will earn 11% more than a similar person
who has the same learning aim, but who did not achieve2. Figure 1 also shows that FL2
achievers are 2 percentage points (ppt) more likely to be in employment and 2 ppt less likely to be observed on benefits, between three and five years after learning.
Fig. 1: Summary of three to five year averages for aggregated qualification categories
3-5 year average Learning Level Earnings Returns
Employment probability premiums
Benefit Probability
gaps Below Level 2 (including English
and/or Maths) 2% 0 ppts 0 ppt Thin Level 2 (including English
and/or Maths) 1% 1 ppt -1 ppt
Full Level 2 (FL2) 11% 2 ppt -2 ppt
Thin Level 3 3% 1 ppt -1 ppt
Full Level 3 (FL3) 9% 4 ppt -2 ppt
Level 4+ 8% 1 ppt -1 ppt
All figures in bold are statistically significant
Estimates of the returns to learning at ‘Below Level 2’ and ‘Thin Level 2’ - which include English and Maths qualifications - were positive but not so strong – though it should be noted that many of these qualifications are of a very short duration.This report presents the findings from a project that investigates labour market returns to these English and Maths qualifications, in two different situations:
• Complementary Learning i.e. when combined with higher level qualifications3,
• Highest Learning Aim - when they are studied as a person’s highest FE qualification (i.e. not taken with a higher qualification)4.
1 A Full Level 2 (FL2) qualifications is equivalent to 5 GCSE’s A*-C; Thin level 2 is equivalent to 1- 4 GCSEs; Full Level (FL3) is equivalent to 2 A-levels; Thin level 3 is equivalent to one A level or AS level; Level 4 is at foundation degree level (although usually shorter). Below L2 (often called Foundation Level) includes English/Maths at Entry Level and L1 plus many other qualifications.
2 BBCTU test the robustness of this econometric approach and the findings suggest estimates are very reliable. For more details please refer to Section 2 of this report; and to Chapter 6 of BBCTU and to Bibby et. al. (2015) “The impact of skills and training interventions on the unemployed – phase 1 report”
3 Many individuals take Maths and/or English qualifications at L1 and L2 as forms of ‘complementary learning’. For instance, there will be many individuals taking a highest qualification aim at Full Level 3 as a route into HE, and alongside this they may be attempting to rectify poor performance at secondary level in GCSE English/Maths.
Maths and/or English as Complementary Learning
L1/L2 English and Maths qualifications when studied alongside higher level qualifications, produce significant earnings benefits for achievers (Figure 2)5
Figure 2: Three to five year earnings and employment returns for L1/L2 English and/or Maths achievers, within populations of FL2, L3, FL3 and L4+ achievers
Level Earnings Employment
L1/L2 English and/or Maths achievement (amongst Full
Level 2 achievers) 4.2% -0.1 ppt
L1/L2 English and/or Maths achievement (amongst Thin
Level 3 achievers) 3.1% 0.0 ppt
L1/L2 English and/or Maths achievement (amongst Full
Level 3 achievers) 1.2% 0.0 ppt
L1/L2 English and/or Maths achievement (amongst Level
4+ achievers) 5.1% 0.1 ppt These Figures do not include ESOL learning; All figures in bold are statistically significant
Amongst the populations of Thin L3 and FL3 achievers, the estimated earnings returns (of 3.1% and 1.2%) in Figure 2 likely understate the true value added, because of the
problems we have capturing progression to HE and part-time working. This may also be the reason why we do not observe an employment premium; although, achievement of the highest learning aim may be more important in determining whether an individual secures employment, and the additional L1/L2 Maths and/or English achievement allows the individual to secure a higher earnings return, when in employment. Returns to English and/or Maths qualifications when taken with FL2 or FL3 qualifications are higher for apprenticeship learners than for classroom-based learners (Figure 3)
Figure 3: Three to five year returns for L1/L2 English and/or Maths achievers, within populations of FL2 and FL3 achievers comparing classroom and apprenticeship learning.
3-5 year average returns
Learning Level
Earnings Returns Emp probability premiums Benefit Probability gaps Classroom-based learning Apprentice ship Learning Classroom-based learning Apprentice ship Learning Classroom-based learning Apprentice ship Learning Eng/Maths achievers
within FL2 Achievers 2.2% 5.9% 0.0 ppts -1.3 ppts -1.0 ppt -1.0 ppts
Eng/Maths achievers
within FL3 Achievers 0.7% 3.0% 0.2 ppts 0.1 ppts -0.4 ppt -0.5 ppts
These Figures do not include ESOL learning; All figures in bold are statistically significant (see Appendix 5.4)
4 We separate out the returns to Maths and/or English qualifications as highest learning aims, within the categories of ‘Below Level 2’ and ‘L2’ in Figure 1; uncovering the heterogeneity of returns that underpin the 2% and 1% earnings returns for ‘Below Level 2’ and ‘L2’ in Figure 1.
5 Taking the example of Full Level 3, we select all those who, between 2002 and 2012, Achieve their highest learning aim of a Full Level 3. Amongst these Full Level 3 Achievers, we identify all learners with an overlapping L1/L2 English and/or Maths aim. The estimate of value added compares the outcomes for those who Achieve their L1/L2 English and/or Maths aims, with those who Do not AchieveL1/L2 English and/or Maths; amongst this population of FL3 achievers.
Labour market returns in the first year after learning are generally significant for most sector subjects, as can be seen from Figure 4. Even when we cannot present 3 to 5 year averages, we do identify statistical significance of impacts in the first years after learning. This analysis by sector pushes the data to its limits and for many sectors the numbers in our regression equations fall too low to produce robust estimates beyond the first year. Figure 4: Estimated earnings premium and probability of being on Benefits, for L2 English and/or Maths Achievers, by Sector Subject [for the population of Full Level 2 Achievers]
L2 English and/or Maths Achievers combined with Full L2 in…
First Tax Year after learning (earnings) First tax year after learning (benefits) 3-5 year average earnings premium 3-5 year active benefit ppt difference
Adult social care 5.6% -2.3 ppt N/A N/A Engineering and manufacturing 6.1% -1.4 ppt N/A N/A Information & Communication Technology 7.2% -1.8 ppt# N/A N/A Retailing and Wholesaling 5.2% -1.8 ppt N/A N/A Hospitality and Catering 6.7% -1.5 ppt 5.3% -1.1 ppt
Hair and beauty 7.9% -2.0 ppt# 5.2% -0.9 ppt Admin/ secretarial 5.8% -1.7 ppt 4.2% -1.2 ppt
Customer service 5.5% -1.4 ppt 6.8% -0.7 ppt These Figures do not include ESOL learning; All figures in bold are statistically significant
# 3 months after learning
Current policy is to make English and Maths learning compulsory for apprenticeships. We might expect English/Maths to be more helpful in more technical subjects, but we also flag why this may not be the case in our Conclusion. Unfortunately, the analysis of earnings and employment returns only produces 3-5 year average return estimates for the less technical subjects, presented in Figure 3. For these less technical subjects there are good returns to Maths and/or English achievement at L2, with earnings returns ranging between 4.2% for those achieving a FL2 in the area of Admin/Secretarial, to 6.8% for those in Customer Service.
Maths and English as a Highest Learning Aim
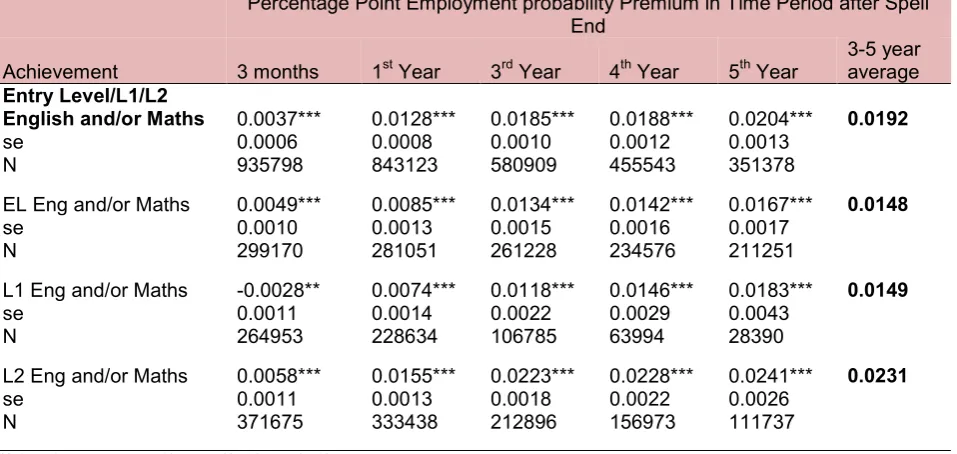
Figure 5 presents estimated returns for learners who have a highest learning aim of Entry-level/L1/L2 Maths and/or English. The results underline the widespread and persistent nature of statistically significant impacts for Maths and/or English learning at Entry, Level 1 and Level 2 when held as a highest learning aim; particularly for younger learners.
Figure 5: Three to five year earnings and employment premiums for those achieving Entry Level/L1/L2 English and/or Maths as a highest learning aim
Earnings Employment Highest learning aim 19 to 24 Aged 25+ 19 to 24 Aged 25+
Entry Level/L1/L2 English and/or Maths 7.1% 4.6% 1.7 ppt 1.9 ppt
Entry Level Eng and/or Maths 5.0% 3.1% 1.0 ppt 1.5 ppt
L1 Eng and/or Maths N/A 7.8% 1.7 ppt 1.5 ppt
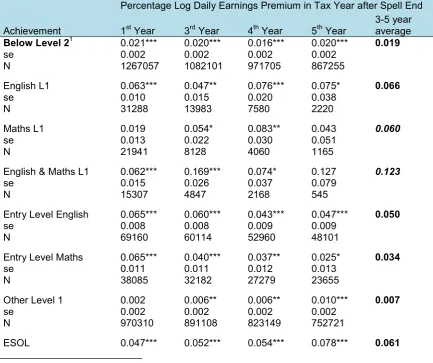
Figure 6 presents estimated earnings returns, employment premiums and differences in benefit outcomes, for disaggregations of the categories presented previously in Figure 4. Figure 6 underlines the fact that when we dig down into these categories of Below Level 2 and L2, we identify good returns for those taking Maths and/or English at Entry level, L1 and L2 as a highest learning aim; together with good earnings returns to ESOL learning.
Figure 6: Three to five year earnings and employment premiums for those achieving Entry Level/L1/L2 English and/or Maths as a highest learning aim [disaggregated categories]
Earnings Employment Benefits
All Below L2 of which 1.9% 0.3 ppt -0.3
Entry Level Eng 5.0% 1.7 ppt -0.5 Entry level Maths 3.4% 0.0 ppt -0.5
L1 English 6.6% 1.7 ppt -0.6 L1 Maths 6.0% 1.3 ppt N/A L1 Eng & Maths 12.3%# 1.6 ppt N/A ESOL 6.1% 0.2 ppt -0.1 Other L1 0.7% 0.2 ppt -0.3
All Thin L2 1.3% 0.9 ppt -0.6
L2 English 7.4% 2.0 ppt -1.3 L2 Maths 3.8% 2.6 ppt -0.9 L2 Eng & Maths 4.9% 0.9 ppt -1.1
Other L2 0.8% 0.8 ppt -0.5 # this finding should be considered with some caution as it is based on small numbers
The figures for English/Maths do not include ESOL learning, as it is analysed separately. All figures in bold are statistically significant
Alongside the statistically significant earnings and employment returns for Maths and English learning at Entry Level, L1 and L2; the Other Level 1 and Other Level 2 categories secure positive, but relatively low, returns. These ‘Other’ categories account for the vast majority of Below L2 and Thin L2 learning, often referred to as “foundation learning” or “employability learning”. Within these remaining categories, there is likely to be further substantial heterogeneity of returns.
L1/L2 Maths and/or English as routes to further FE learning
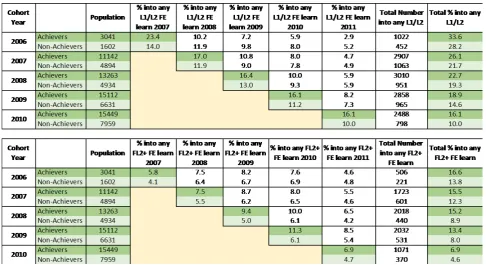
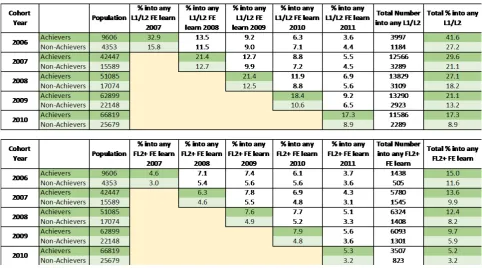
We tracked several cohorts to gauge the extent to which L1/L2 Maths and/or English learners progress to further learning within FE. Figure 7 looks at the progression of one such cohort (from 2007) who have a learning aim of L1 English and/or Maths6 and finds that achievers (of all ages) are more likely to be observed in subsequent (i) L1/L2 and (ii) FL2 or higher FE learning across all the years considered, when compared to
non-achievers. However, considerable proportions of both achievers and non-achievers are engaged in further learning.
6 Which is their highest learning aim up to the date from which we track them.
Figure 7: Proportion of L1 English and/or Maths Achievers and Non-achievers progressing into continued FE learning
Cohort Year
Total % into any L1/L2 learning between 2007 and 2011 (19 to
24)
Total % into any FL2+
learning, 2007 to 2011
(19 to 24)
Total % into any L1/L2 learning between 2007 and 2011 (25+)
Total % into any FL2+
learning, 2007 to 2011
(25+)
2007 Achiever Non- 26.09 15.46 29.60 13.62
achiever 21.72 12.28 21.10 9.91
The categories of L1 English and/or Maths Achievers and Non-achievers, do not include ESOL learning, but the destination state of Any L1/L2 FE does include ESOL7. Please note these are ‘raw’ figures and no
attempt has been made to control for differences between achievers and non-achievers
Figure 8 considers the progression of a 2007 cohort of L2 English and/or Maths
Achievers and Non-achievers, observed in subsequent FE learning at (i) L1/L2 or (ii) FL2 or higher. Here we observe an unusual result, as 19-24 Achievers are less likely to progress than non-achievers, but 25+ achievers are more likely to progress. This is likely driven by the high proportion of 19 to 24 year old achievers who progress to Higher Education and these findings should be considered alongside those of Smith et al.
(2015)8. Again, considerable proportions of achievers and non-achievers go on to further
learning.
Figure 8: Proportion of L2 English and/or Maths Achievers and Non-achievers progressing into continued FE learning
Cohort Year
Total % into any L1/L2 learning between 2007 and 2011 (19 to
24)
Total % into any FL2+
learning, 2007 to 2011
(19 to 24)
Total % into any L1/L2 learning between 2007 and 2011 (25+)
Total % into any FL2+
learning, 2007 to 2011
(25+)
2007 Achiever Non- 16.53 21.45 21.52 18.46
achiever 18.20 21.53 18.85 15.38
The categories of L1 English and/or Maths Achievers and Non-achievers, do not include ESOL learning, but the destination state of Any L1/L2 FE does include ESOL. Please note these are ‘raw’ figures and no attempt has been made to control for differences between achievers and non-achievers
7 Though we would expect a negligible number of learners to move to ESOL from non-ESOL English.
8https://www.gov.uk/government/publications/progression-of-further-education-students-to-higher-education
https://www.gov.uk/government/publications/progression-of-apprentices-to-higher-education-second-cohort
Conclusion
L1/L2 English and Maths qualifications when studied alongside higher level
qualifications, produce significant earnings benefits for achievers. Even though analysis by sector pushes the data to its limits, there is still evidence of significant earnings returns, and a significantly lower probability of being on benefits, across many of the sectors
analysed.
Statistically significant labour market returns are also widespread and persistent for Maths and/or English learning at Entry, Level 1 and L2 when held as a highest learning aim; particularly for younger learners.
ESOL learning also produces good earnings returns; whilst learning at Other Level 1 and Other Level 2 secures positive, but relatively low, returns.
Readers are encouraged to consider the detail of the tables within the report, as in many areas where we cannot present 3 to 5 year averages, we do identify statistical significance of impacts in the first years after learning.9 Similarly, first year impacts apply across a
number of cohorts of learners, as we observe a first year of earnings, employment and benefits information for all cohorts.
There a number of issues that this study raises that need to be considered going forward (not least the need for data that allows us to observe moves to Higher Education and/or other forms of non-FE learning/training). Any future study would ideally introduce more data from HESA identifying (i) the specific destination of FE learners who move on to HE and (ii) the drop-out rate of these learners. In this report we are concentrating on earnings, employment and active benefit outcomes, but for many FE learners, HE is an important and valuable outcome.
However, even with these data limitations, we are able to present compelling evidence that Entry Level, Level 1 and Level 2 Maths and/or English learning in FE provides significant value added for those who achieve their learning aims.
9 The “gold standard” criteria for impact (i.e. that statistical significance must be observed over many years
and also that in each year it must be relatively stable), is very rigorous and more than many studies are able to achieve.
1. Introduction
This report presents the results of an analysis of labour market returns for individuals achieving qualifications at ‘Below Level 2’ and ‘Level 2’ in English Further Education10;
extending the analysis of Bibby, Buscha, Cerqua, Thomson and Urwin, (2014)11 [from here
referred to as BBCTU]. Using the 2002-2012 ILR-WPLS administrative dataset12 we
estimate separately the (i) earnings, (ii) employment probability and (iii) probability of being on active benefits, for those who achieve their learning aim whilst studying at an English Further Education Institution (FEI), relative to those who have the same learning aim, but do not achieve; with a particular focus on this estimate of value added for those achieving Entry-level, Level 1 (L1) and Level 2 (L2) Maths and/or English qualifications13.
We report estimated returns for the first, third, fourth and fifth tax year after learning. Returns in the first year are an important benchmark for comparison across studies, and we choose the 3 to 5 year average as our measure of value added, as it balances an implicit trade-off - we require estimated premiums that (i) persist sufficiently far into the future, but (ii) are not over-reliant on a small number of cohorts that completed learning many years ago14. For each learner we have 7 academic years (2004/2005 to 2010/2011)
when they can possibly exit learning (as an achiever or non-achiever) and over these academic years, a learner can have multiple ILR learning spells. Across all of the learning spells for each individual, we select the highest learning aim. We then adopt two broad approaches to the estimation of labour market returns.
First, Section 3 presents estimates of the labour market returns to L1/L2 Maths and/or English qualifications, when these are not held as an individual’s highest learning aim. BBCTU presented estimates using a [L1/L2 Maths and/or English] achiever V non-achiever comparison, but only for a population of learners with a highest learning
achievement of Full Level 2 (FL2) and Full Level 3 (FL3). More specifically, Maths and/or English qualifications taken at L1 and L2 are often forms of ‘complementary learning’. For instance, there will be many individuals taking a highest qualification aim at Full Level 3 as a route into HE, and alongside this they may be attempting to rectify poor performance at secondary level in GCSE English and/or Maths15. As a result, we investigate achiever V
10 A Full Level 2 (FL2) qualifications is equivalent to 5 GCSE’s A*-C; Thin level 2 is equivalent to 1- 4
GCSEs; Full Level 3 (FL3) is equivalent to 2 A-levels; Thin level 3 is equivalent to one A-level or AS level; Level 4 is at foundation degree level (although usually shorter). Below L2 (often called Foundation Level) includes English/Maths at Entry Level and Level 1 plus many other qualifications.
11 Bibby, D., Buscha, F., Cerqua, A., Thomson, D. and Urwin, P. (2014), “Estimation of the labour market
returns to qualifications gained in English Further Education”, Department for Business, Innovation and Skills, Research Paper No. 195.
12 For more details see Bibby et. al. (2014) and the Data and Method Section of this Report.
13 Throughout the report we adopt the terminology of ‘English’ and ‘Maths’, rather than ‘Numeracy’ and
‘Literacy’.
14 We only observe labour market returns five years on from the end of learning for cohorts that finished their
learning a number of years ago, during the 2006/2007 academic year or before.
15 See Smith et al (2015), for an indication of the numbers of FE learners progressing to HE.
https://www.gov.uk/government/publications/progression-of-further-education-students-to-higher-education https://www.gov.uk/government/publications/progression-of-apprentices-to-higher-education-second-cohort
non-achiever comparisons for individuals undertaking L1/L2 Maths and/or English, who have achieved higher learning aims.
Continuing the example of Full Level 3, we first select all those who, between 2002 and 2012, achieve their highest learning aim of a Full Level 3 Qualification. Within this group of Full Level 3 Achievers, we then identify all learners who also have a L1/L2 English and/or Maths aim (not held as their highest learning aim). We then create an estimate of value added by comparing the outcomes for those who Achieve their L1/L2 English and/or Maths aims, with those who Do not Achieve L1/L2 English and/or Maths aim; amongst this
population of FL3 achievers. Section 3.1 extends the analysis of BBCTU to cover
additional populations of highest aim achievers; creating estimates using a [L1/L2 Maths and/or English] achiever V non-achiever comparison, for the populations of learners with a highest achievement of Level 3 and also Level 4+16. Section 3.2 has the same approach to
analysis, but disaggregates the results by sector subject area of the highest learning aim achieved, where numbers permit17.
Second, Section 4 extends the analysis in Bibby et. al. (2014) for those who achieve ‘Below Level 2’ or ‘L2’ qualifications, as their highest learning aim. We may reasonably expect many of those who take a qualification at, or below, Level 2 as their highest learning aim, to have particularly limited labour-market prospects. As a result, it is often hard to identify accurate estimated returns (especially in survey-based studies) - it is very difficult to find a robust control or comparison group that provides us with an accurate estimate of the outcomes that these [particularly disadvantaged] individuals would have secured, in the absence of learning. The ILR-WPLS data allow us to identify a group, who provide a more robust estimate of these ‘counterfactual’ outcomes; because non-achievers select into the same qualification18. The findings from BBCTU suggest that, even with this
more appropriate approach to estimation, we still observe relatively low returns for those whose highest learning aim is ‘L2’ or ‘Below Level 2’. However Sections 4.1 and 4.2 show that, when we separate out the returns to Maths and/or English qualifications at this level, we uncover much more favourable estimates of value added (Section 5.3 of the Appendix sets out the results of an analysis using the same approach, but with estimates presented separately for (i) those aged 19 to 24 and (ii) those aged 25+).
Finally, Section 4.3 gives some idea of the value that L1/L2 Maths and/or English
qualifications have as a route to higher qualifications within FE. Taking a cohort approach, we select all individuals with a L1/L2 Maths and/or English spell aim that finishes during year X (focusing on those who have no prior FE learning aim, either at the same or lower level, and who have no accompanying aim that is at a level higher than L2). We do this for each year X and then create figures on the number/proportion of achievers that we see in various forms of FE learning in X+1, X+2, X+3 etc. years from the end of learning.
16 Also presenting the results for more disaggregated categories of Maths and English qualifications. 17 The derived Industry Sector classification we have used has the SSA variable in the ILR at its route, but
also uses the title of the highest learning aim and the SSC footprint where SSA is missing or uninformative.
18 It is worth emphasizing that the majority of non-achievers are ‘drop-outs’, as opposed to ‘failing’ a
qualification. See Chapter 6 of BBCTU for more detail on the strengths and weaknesses of the achiever V non-achiever (drop-out) approach, and the findings from tests of its robustness using
difference-in-differences and Coarsened Exact Matching (CEM) approaches.
2. Data and Method
This report extends and deepens the analysis set out in Bibby et. al. (2014), and as such, it is based on the same underlying dataset and approach to method. Section 2.1 sets out a brief reminder of this underlying approach to data creation (pointing readers to BBCTU, and an accompanying Report, for more detail); and Section 2.2 describes the econometric method we use to uncover more detailed estimates of value added from Maths/English learning at Entry Level, Level 1 and Level 2 in English FE.
2.1 Creation of the ILR-WPLS dataset
We create the ILR-WPLS dataset linking FE learner information, benefit and PAYE
employment histories for tens of millions of individuals. A pre-requisite for the construction of such a dataset is the creation of an over-arching Person-key to link records in the data sources (the Individualised learner Record (ILR) together with the Work and Pensions Longitudinal Study (WPLS)) reliably to the same individual. This Person-key identifies the same individual in the various data sources and is now used by BIS for in-house analysis. The creation of the ILR-WPLS dataset requires complex processes of imputation and merging. Details of the imputation processes and procedures to arbitrate between
competing matching possibilities are described at length in Buscha and Urwin (2013) and Thomson et. al. (2010).
2.2 Econometric Analysis
As suggested in the introduction, the starting point for our analysis of this data is the use of non-achievers as a control group that provides an accurate representation of
counterfactual outcomes for those achieving a certain qualification19. We estimate
separately the (i) earnings, (ii) employment and (iii) benefit premiums secured by those who achieve a particular learning aim whilst studying at an English Further Education Institution (FEI), relative to those who have the same learning aim, but do not achieve. In comparing the returns of those who select into a qualification and achieve, with the returns of those who select into the same qualification and do not achieve, we have the potential to overcome some of the problems of selection experienced elsewhere in the literature. Many studies that utilise data from the Labour Force Survey identify negligible returns to some level 1 and level 2 vocational qualifications. However, this may be partly driven by the possibility that control groups in these studies contain many individuals who are not a realistic comparison group for those who select into level 1 and 2 vocational qualifications, particularly when this is their highest learning aim.
19 The estimate of what an individual would have earned in the absence of a qualification or training, is called
the ‘counterfactual’, because it is counter to the factual state of the world (we can’t observe individuals taking the qualification, and not taking the qualification). To create credible estimates of counterfactual outcomes, we choose a comparison group that does not have the qualification, but provides a credible estimate of what the individuals with the qualification would have earned, if they had not taken the qualification.
If individuals who would gain a lower wage (independent of their level of learning) are more likely to select into certain vocational qualifications, then estimated returns may be falsely deflated if we compare them to a control group who do not select into this
qualification (and do not manage to control for the implied differences within a multivariate framework). This study may arguably provide a better comparison group because it
overcomes some of the biases arising from these selection effects. However, there are weaknesses in comparing those who achieve, with those who fail to achieve or drop out, if we do not effectively control for ability and other unobservable factors.
BBCTU test the validity of this approach to the estimation of Value Added, and their work has been subjected to a rigorous process of peer-review by four academic experts. The findings suggest that regression-based techniques, which compare achievers and non-achievers using ILR-WPLS data, produce robust estimates of value added. The more advanced techniques used to test this assertion, are Coarsened Exact Matching (CEM) and difference-in-differences methods (see BBCTU, Chapter 6 for more details). The results suggest that estimates obtained from the following standard regression approach (estimated using Ordinary Least Squares, OLS), provide robust estimates of value added:
where the dependant variable, , takes one of the following forms:
• Log of deflated daily earnings (top and bottom 1% removed) in the whole financial tax year 1, 3, 4 and 5 years after the end of a learning spell.
• The probability of being employed (binary) exactly 1, 3, 4 and 5 years after the end of a learning spell20.
• The probability of being on job-seeking [‘Active’] benefits (binary) exactly 1, 3, 4 and 5 years after the end of a learning spell.
The qualification variables, , are inserted as dummies where a value of 1 represents those who achieved their spell aim, whilst a value of 0 represents those who had the same spell aim, but failed to achieve any qualification within that spell. The coefficient then represents an estimate of the return (or premium) to that qualification level. The nature of our setup (achievers vs. non-achievers) requires each qualification level to be estimated in its own regression model, for each year after the end of learning.
As suggested in the introduction, we adopt three variations on this approach to estimation, which allow us to uncover the value added of English and Maths qualifications.
20 Some regressions have binary variables on the left-hand side. These models are also estimated using
OLS resulting in a linear probability model (LPM). Such models have the disadvantage that out-of-bound predictions can occur (probabilities greater than 1 or less than 0) and also suffer from heteroskedasticity. However, the sheer size of these data make logit/probit modelling with marginal effects highly
computationally intensive; particularly as our identification strategy requires each qualification level to be estimated in its own regression equation. LPM models generally performed well and we report robust standard errors.
i i i x i
y = +α Qual′β+x′γ +ε
i
y
i
Qual
β
Section 4: BBCTU mostly take a ‘highest aim’ approach to evaluation of the returns to learning in FE. For each learner we have 8 academic years (2004/2005 to 2011/2012) when they can possibly exit learning (as an achiever or non-achiever) and over these academic years, a learner can have multiple ILR learning spells. Across all of the learning spells for each individual we select the highest learning aim. The estimate of value added is obtained by comparing the returns of those who have a particular highest learning aim and achieve; with the returns of those who have the same highest learning aim, but do not achieve.
Considering the categories of learner with highest learning aims of either ‘L2’ or ‘Below Level 2’, individuals in these groups are unique, as they have very limited labour market prospects – we observe them attempting a highest level of learning in FE that is below what is expected from a school leaver. The suggestion in BBCTU is that for L2 we observe an average 1% earnings return and 2% for Below Level 2 (for individuals who have these as their highest learning aims). But there is pronounced heterogeneity of returns within these broad categories, and in this report when we break the groups down to identify returns to (i) Entry Level Maths, (ii) Entry Level English, (iii) L1 Maths, (iv) L1
English/Literacy, (v) L2 Maths, (vi) L2 English/Literacy (held as the highest learning aim) we uncover much higher returns; with a group of ‘other L1’ and ‘other L2’ responsible for the lower returns seen at the more aggregated level21.
Section 3: We want to get a better idea of the returns to L1/L2 Maths/English, but many individuals take these qualifications alongside higher aims. For instance, individuals engaged in Full Level 3 also trying to rectify poor performance in Maths/English GCSEs, and a range of other combinations. Taking a highest aim approach misses these returns. Section 3 presents the results of an analysis that captures separate returns for (i) Entry Level Maths, (ii) Entry Level English, (iii) L1 Maths, (iv) L1 English/Literacy, (v) L2 Maths, (vi) L2 English/Literacy; within wider populations of (a) all those achieving FL2 as a highest learning aim: (b) those achieving L3 as a highest learning aim:(c) those achieving FL3 as a highest learning aim: and (d) those achieving L4+ as a highest learning aim. More specifically, we select (for instance) the population of all FL2 achievers and, within this population, identify achievers and non-achievers who have L1/L2 Maths/English learning aims that overlap the achieved FL2 spell.
Finally in Section 4.3, we capture the value of L1/L2 Maths and English qualifications as a route to continued FE learning, using a cohort analysis, with descriptive statistics (rather than as part of an econometric analysis). For instance, of the cohort who achieve a L1 Maths/English aim in 2007/2008, we consider the proportion who are observed in FE learning at FL2 or above over the following 5 years; and compare this to the proportion of L1 Maths/English non-achievers from the same cohort, who are observed in FE learning at FL2+ over the next five years22.
21 Though this is not the end of the story for these qualifications, as a proposed extension to this analysis,
differentiating returns by FE provider, has the potential to uncover further heterogeneity in these ‘other L1’ and ‘other L2’ categories – not least because these include ICT courses.
22 With some attempt to ensure that this is not overly impacted by issues of duration dependence (arising
from the fact that we are recording the end, rather than the start of learning, for achievers and non-achievers).
3. Maths and/or English as
Complementary Learning
BBCTU create estimates using a [L1/L2 Maths and/or English] achiever V non-achiever comparison, for populations of learners with highest learning achievement of FL2 or FL3. Tables 1 and 2 (in this section) present extensions to this analysis, with estimates also presented for populations of L3 and L4+ achievers. Tables 3 to 8 then break these findings down into more detailed categories of Maths and/or English learners, for the populations of FL2 and FL3 achievers. Section 3.2 disaggregates the findings for L1/L2 Maths and/or English learners amongst our populations of FL2 and FL3 achievers, by the sector subject area of the FL2 or FL3 aim being studied (where numbers allow).
3.1 L1/L2 Maths and/or English returns for FL2, FL3 and other Achiever
Populations
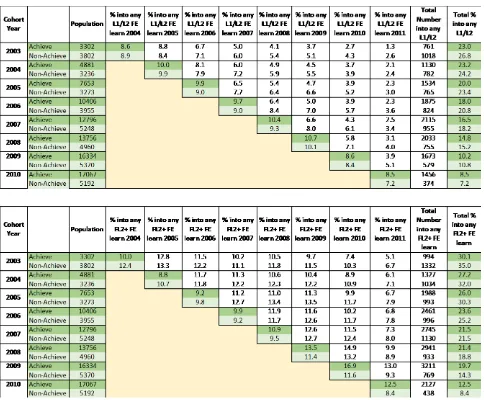
Table 1 confirms the more favourable estimated earnings returns for an amalgamated group who achieve L1/L2 Maths and/or English, when taken as a complementary form of learning; uncovered by BBCTU23. For instance, the first row of Table 1 estimates the value
added of L1/L2 Maths and/or English qualifications; with the population of individuals included in the regression equations restricted to those who have achieved a highest aim of Full Level 2 [which overlaps the English/Maths learning]. The 3 to 5 year average earnings return of 4.2% is therefore the earnings premium secured by those who achieve a L1/L2 Maths and/or English qualification, relative to those who do not achieve their L1/L2 Maths and/or English qualification (with this estimate relevant for a population of FL2 achievers).
Table 1: Returns to daily earnings for L1/L2 English and/or Maths achievers24 [within
populations of (i) FL2 (ii) L3 (iii) FL3 and (iv) L4+ achievers]
Percentage Log Daily Earnings Premium in Tax Year after Spell End Achievement 1st Year 3rd Year 4th Year 5th Year 3-5 year average
FL2 Achievers 0.060*** 0.035*** 0.048*** 0.042*** 0.042
s.e. 0.005 0.006 0.007 0.008 N 180267 78721 55138 37285
L3 Achievers -0.003 0.026** 0.033** 0.035** 0.031
s.e. 0.010 0.011 0.011 0.012
23 A Full Level 2 (FL2) qualifications is equivalent to 5 GCSE’s A*-C; Thin level 2 is equivalent to 1- 4
GCSEs; Full Level 3 (FL3) is equivalent to 2 A-levels; Thin level 3 is equivalent to one A-level or AS level; Level 4 is at foundation degree level (although usually shorter). Below L2 (often called Foundation Level) includes English/Maths at Entry Level and Level 1 plus many other qualifications.
24 Tables 1 and 2 do not include ESOL English qualifications in the category of L1/L2 English and/or Maths,
for which returns are estimated. The estimates for FL2 and FL3 populations are the same as those in BBCTU, as they also exclude ESOL learning.
Percentage Log Daily Earnings Premium in Tax Year after Spell End Achievement 1st Year 3rd Year 4th Year 5th Year 3-5 year average
N 41799 30499 25289 19967
FL3 Achievers -0.002 0.001 0.018*** 0.017*** 0.012
s.e. 0.003 0.004 0.004 0.005 N 385245 226940 168144 113293
L4+ Achievers 0.005 0.042* 0.045* 0.065* 0.051
s.e. 0.016 0.019 0.022 0.029 N 16404 8714 5774 3239
*** Significant at the 0.1% level; ** 1% and * 5%
The 3 to 5 year averages are constructed from regression estimates of returns up to five years from the end of learning. For instance, the figure of 0.060 in the top left-hand corner of Table 1 is a coefficient obtained from a regression equation for individuals whose highest qualification achievement, across all their learning spells, is Full Level 2 and who have an accompanying/overlapping L1/L2 Maths and/or English aim. Amongst this
180,267 individuals, we estimate the return to achievement of L1/L2 Maths and/or English, relative to those who fail to achieve. The coefficient of 0.060 is therefore an estimate of the additional earnings that achievers receive in the first tax year after the learning spell ends, compared to the earnings of those who fail to achieve the aim, controlling for a variety of additional factors in our regression equation25. Those achieving a L1/L2 Maths and/or English aim earn, on average, 6% more than those who do not achieve this stated aim in the first year after the learning spell ends (with this estimate relevant for a population of FL2 achievers).
The figure of 6% is therefore our estimate of the difference between (i) the post-
qualification earnings of individuals who obtain L1/L2 Maths and/or English, compared to (ii) the earnings of the same individuals if they had not taken this qualification (otherwise known as the ‘counterfactual’26), amongst a population of FL2 achievers. Moving along this first row of Table 1, the results of three more regression equations, suggest that this
earnings premium stays relatively stable between the third and fifth year after the end of learning (between 3.5% and 4.8%); following a slight dip from 6% to 3.5% from the first to third years after learning. As with all the tables in this report, the final column of Table 1 presents the earnings return averaged over the period three to five years on from learning. It is important to note that the return in the first year after learning will, necessarily, include all cohorts of learners (because we observe a first year of earnings for even those whose learning spell finishes in 2010-2011). However, by the fifth year after learning our estimate
25 We control for sex; age; interaction sex-age; ethnicity; disability; region; type of funding (none, LCS, ESF,
both); mode of attending (FT/PT); offender; spell duration; number of previous FE learning spells; prior education level; year dummies; Index of Multiple Deprivation (IMD); Indicators derived from Sector Subject Area (SSA); the number of days an individual was on active benefits in the year before learning; whether an individual has an inactive benefit spell in the year before learning; and how many days an individual has spent in sustained (6 months) employment just before learning.
26 Called the ‘Counterfactual’, because it is ‘counter’ to the ‘factual’ state of the world. We never observe the
counterfactual, but use various econometric estimation techniques to get as close an estimate as possible.
is based on learners who complete prior to the 2007/2008 academic year (as these are the only learners for whom we observe five or more years of earnings). This is an issue to which we return, as we face limitations later in the report when numbers drop too low for analysis to be possible beyond the first year.
All the results in the first row of Table 1 are statistically significant at the 0.1% level (i.e. 99.9% level of confidence) and we are therefore confident of a strong correlation between achievement of a qualification aim and higher earnings (with the standard error or ‘s.e.’ in the Tables providing an indication of the expected variability around this estimate, and used to create confidence intervals).
NB/ In all tables, the 3 to 5 year average is,
• Highlighted in Bold if we consider it to be a robust estimate, with both (i) statistically significant impacts across the three to five year period that are relatively stable27 and
(ii) a sufficient number of learners to provide a sizeable control group of non-achievers (exactly what constitutes a ‘sufficient’ number of learners varies for each set of analysis and we return to this later in the report, when it becomes more of an issue)
• Highlighted in Bold Italics if we consider the finding to be relatively robust, with (i) statistical significance across the majority of estimated impacts between three and five years and (ii) a control group that is on the margins of our considerations of size. • Not highlighted in bold or italics, when there are concerns over the robustness of the
findings, but between three and five years we have some evidence of at least one significant impact, with sufficient numbers. Where this is the case, we highlight in bold those earnings, employment or benefit returns from the individual regressions that are statistically significant, in the years after the end of learning.
• Not Available (N/A) when we have results that are not robust enough to produce a three to five year average. Where this is the case, we again highlight in bold those earnings, employment or benefit returns (usually in the first tax year after learning), that are statistically significant.
• When there is no suggestion of statistical significance, but numbers are sufficient, the 3 to 5 year average is set to zero.
Amongst the population of FL3 achievers (in the third row of Table 1), there is a
recognition (flagged by BBCTU), that the estimated return (of 1.2%) likely understates the true value added, because of the problems we have capturing progression to HE and part-time working28. Similarly, our new estimate in the second row of Table 1 suggests that
27 One can have a set of return estimates between three and five years that are statistically significant, but
vary from negative to positive: these are not findings we would consider particularly robust (though in the case of L3 and FL3 populations we do seem to have a clear explanation of why this may occur).
28 In BBCTU we were able to identify progression to HE for a small subset of learners. However, when
estimating across the entire population, our results are impacted by unobserved moves to HE or some other form of (non-FE) learning. If we do not identify those who go on to HE learning from FE learning at Full Level 3 (and to a lesser extent from FL2 to other forms of non-FE learning or training), we have a significant number in the treatment (achievers) who will be (i) less likely to be employed following
amongst the population whose highest achievement is Level 3, those achieving a L1/L2 Maths and/or English qualification secure a 3.1%, 3 to 5 year, average earnings return. These estimated returns for populations of L3 and FL3 achievers seem to be artificially depressed in the first two to three years after learning, and then recover thereafter – a pattern that is consistent with the issue of HE students working part-time. This is an issue to which we return, when digging further down into these findings. For the population of Level 4+ achievers, the return to L1/L2 Maths and English is estimated to average 5.1% between 3 and 5 years after learning.
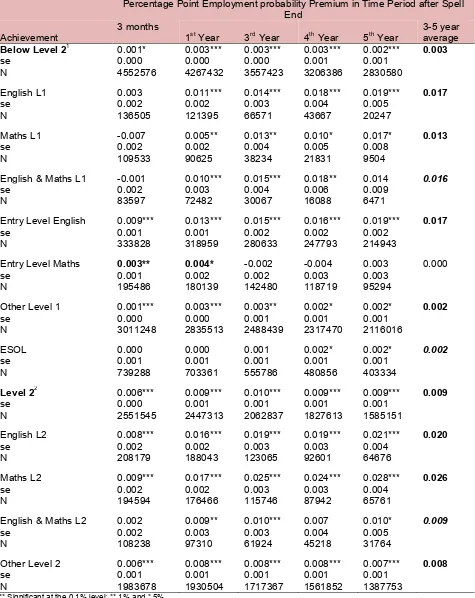
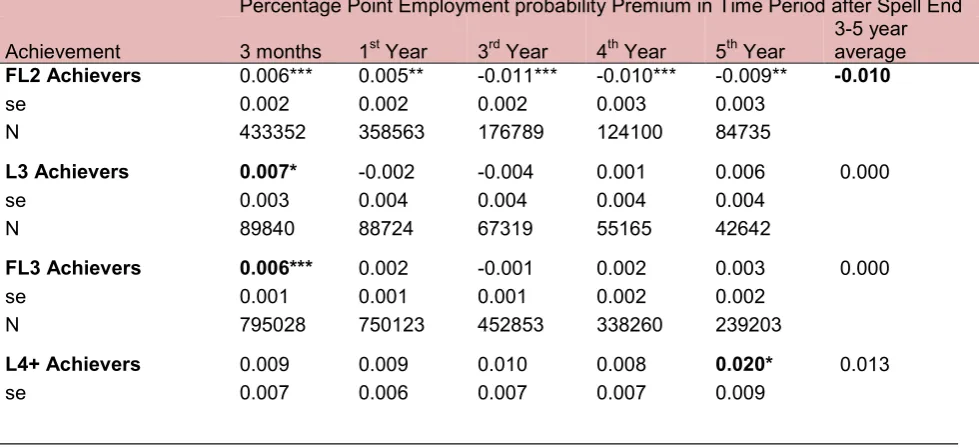
[image:24.595.59.549.426.650.2]Table 2 suggests that there is little, if any systematic percentage point employment probability premium for L1/L2 Maths and English achievers over non-achievers, amongst our populations with higher learning aims achieved. There are many reasons why we might observe this lack of employment premium, alongside a more systematic earnings premium. One possible explanation, that we return to, is the HE/PT issue flagged in the discussions around Table 1 above. In addition, it is also possible that achievement of the highest learning aim may be more important in determining whether an individual secures employment; and the additional L1/L2 Maths and/or English achievement allows the individual to secure a higher earnings return, when in employment. Whilst there are some patches of significance here and there in Table 2, they are conflicting, and the size of any implied impact is small.
Table 2: Estimated employment probability premiums for L1/L2 English and/or Maths achievers [for populations of (i) FL2 (ii) L3 (iii) FL3 and (iv) L4+ achievers]
Percentage Point Employment probability Premium in Time Period after Spell End Achievement 3 months 1st Year 3rd Year 4th Year 5th Year 3-5 year average
FL2 Achievers 0.006*** 0.005** -0.011*** -0.010*** -0.009** -0.010
se 0.002 0.002 0.002 0.003 0.003 N 433352 358563 176789 124100 84735
L3 Achievers 0.007* -0.002 -0.004 0.001 0.006 0.000
se 0.003 0.004 0.004 0.004 0.004 N 89840 88724 67319 55165 42642
FL3 Achievers 0.006*** 0.002 -0.001 0.002 0.003 0.000
se 0.001 0.001 0.001 0.002 0.002 N 795028 750123 452853 338260 239203
L4+ Achievers 0.009 0.009 0.010 0.008 0.020* 0.013
se 0.007 0.006 0.007 0.007 0.009
achievement and (ii) those who are employed will more likely be working in (relatively poorly paid) PT jobs (whilst they are HE students or engaged in other forms of training).
27 contd This has the potential to understate (i) employment returns and (ii) earnings returns, relative to a control
who may be more likely to exit to FT jobs. In BBCTU we observe negative and significant earnings returns (for FL3 and L3) in the initial years following the end of learning, with returns tending to pick up 3 to 4 years from the end of learning (when the treatment will have finished HE or other forms of non-FE training), and this supports this explanation. The employment returns did not seem to be so negatively impacted, possibly because the control (of FL3 non-achievers) where similarly less likely to secure employment.
Percentage Point Employment probability Premium in Time Period after Spell End Achievement 3 months 1st Year 3rd Year 4th Year 5th Year 3-5 year average
N 28726 27875 16332 11619 7581
*** Significant at the 0.1% level; ** 1% and * 5%
Tables 3 through to 8 present a more detailed breakdown of the estimated returns for subgroups of learners within this wider ‘L1/L2 Maths and/or English’ category of learning aim – focusing on the populations of FL2 and FL3 achievers. For instance, in Table 3, amongst the population of FL2 achievers, we identify a 4.6% average [3 to 5 year] earnings return for those achieving a L2 English qualification and for those taking both English and Maths at L2, the figure is 7.3%. For other subcategories in Table 3 the
[image:25.595.59.492.321.604.2]suggestion is that returns are of a similar magnitude, but as we move on to the second and third year after learning, we lose statistical significance, as a result of the drop in numbers. Table 3: Returns to daily earnings for L1/L2 English and/or Maths achievers [for a population of FL2 achievers]2930
Percentage Log Daily Earnings Premium in Tax Year after Spell End Achievement 1st Year 3rd Year 4th Year 5th Year 3-5 year average
English L1 0.054*** 0.015 0.033 0.072 N/A
se 0.017 0.028 0.049 0.188 N 9645 3153 1291 190
Maths L1 0.071** 0.058 0.118 0.083 N/A
se 0.022 0.039 0.072 0.176 N 6812 1864 851 178
English & Maths L131 0.061*** 0.044** 0.016 0.018 0.026
se 0.008 0.016 0.023 0.035 N 52097 12602 6375 2501
English L2 0.064*** 0.043*** 0.050*** 0.045*** 0.046
se 0.007 0.009 0.010 0.011 N 56471 31902 24930 19338
Maths L2 0.056*** 0.030 0.036 0.032 N/A
se 0.014 0.018 0.022 0.026 N 14621 6409 4345 2831
29 Tables 3 to 8 do not include ESOL qualifications in the categories of L1/L2 English for which returns are
estimated.
30 Our category of English L1 in Tables 3 to 8 contains all learners who have a English L1 aim overlapping a
FL2 spell (but no overlapping Maths aim); whilst the English & Maths L1 category includes all those who have English L1 and Maths L1 aims overlapping a FL2 spell (the same applies to the English & Maths L2 category). As a result, each category of learner is mutually exclusive and no learner can appear in more than one category.
31 For categories such as L1 English, achievement and non-achievement is straightforward. However, for
the category of L1 Maths and English we can obviously have a combination of achieve/non-achieve groups. The majority of non-achievers taking both, fail both, and majority of achievers taking both, pass both. Non-achievers are therefore those with both Maths and English aim, who fail to achieve either English or Maths, or both. Variations on this approach do not alter our findings.
Percentage Log Daily Earnings Premium in Tax Year after Spell End Achievement 1st Year 3rd Year 4th Year 5th Year 3-5 year average
English & Maths L2 0.063*** 0.067*** 0.079*** 0.073*** 0.073
se 0.008 0.010 0.011 0.013 N 40621 22791 17346 12247
For the population of FL2 achievers, Table 4 suggests a mostly insignificant employment effect from achievement of various L1 English and/or Maths combinations. However, for L2 English and/or Maths combinations, we observe achievers with significantly lower levels of employment three to five years on from the end of learning. In contrast, when we consider employment returns to these qualifications for the population of FL3 achievers in Table 6, the main message is one of insignificant employment effects.
Table 4:Estimated employment probability premiums for L1/L2 English and/or Maths achievers [for populations of FL2 achievers]
Percentage Point Employment probability Premium in Time Period after Spell End
Achievement 3 months 1st Year 3rd Year 4th Year 5th Year 3-5 year average
English L1 0.0010 -0.001 -0.0179* 0.0050 -0.0203 0.0111
se 0.0054 0.0059 0.0090 0.0126 0.0237 N 21907 19141 7780 3880 1317
Maths L1 0.0084 0.0025 -0.0057 -0.0272 -0.0232 N/A
se 0.0071 0.0078 0.0134 0.0188 0.0384 N 15434 13086 4277 2140 747
English & Maths L1 0.0018 0.0060* 0.0091 0.0097 -0.0072 0.000
se 0.0023 0.0029 0.0052 0.0075 0.0110 N 141212 92610 26123 14071 6544
English L2 0.0072** 0.0033 -0.0103** -0.0110** -0.0080* -0.0098
se 0.0026 0.0027 0.0033 0.0036 0.0040 N 125606 114782 70032 53536 40211
Maths L2 0.0073 0.0046 -0.0163* -0.0275*** -0.0088 -0.0175
se 0.0045 0.0048 0.0066 0.0078 0.0096 N 37330 34266 17014 11414 7519
English & Maths L2 0.0067* 0.0003 -0.0203*** -0.0205*** -0.0132** -0.0180
se 0.0031 0.0032 0.0038 0.0042 0.0048 N 91863 84678 51563 39059 28397
*** Significant at the 0.1% level; ** 1% and * 5%
report). In much of our analysis to date this has mainly been flagged as an issue when we consider returns to FL3 and L3, as they are the main point of transition to HE (see Smith et al (2015))32. However, as Buscha and Urwin (2013: Section 3.5) emphasise in their study
of unobserved HE impacts for a subset of learners, this also has potential to impact those: “who have an ‘FE highest-aim’ of …Full Level 2, but who have achieved a higher level of learning elsewhere (for instance as part of their Secondary education) which then allows them to move to Higher Education”.
In Table 4, our negative and significant employment effects (amongst a population of FL2 achievers) occur three to five years on from achievement, which is consistent with this suggestion that many more L2 English and/or Maths achievers continue some form of activity outside of FE; which eventually leads to lower employment levels 3 to 5 years on, when they move to HE33. In Table 6, it is likely that individuals achieving their L2 English
and/or Maths qualifications amongst the population FL3 achievers, are more likely to make the move to (unobserved) HE learning and this reduces the proportion of achievers we observe in employment; to the point where we have insignificant employment impacts. Table 5: Returns to daily earnings for L1/L2 English and/or Maths achievers [for a population of FL3 achievers]
Percentage Log Daily Earnings Premium in Tax Year after Spell End Achievement 1st Year 3rd Year 4th Year 5th Year 3-5 year average
English L1 0.035 -0.062 -0.114 N/A N/A
se 0.032 0.058 0.135
N 2986 797 242 30
Maths L1 -0.004 -0.078 -0.178 N/A N/A
se 0.037 0.066 0.136
N 2438 736 295 39
English & Maths L1 0.083** 0.052 -0.204 N/A N/A
se 0.032 0.075 0.217
N 2733 550 152 18
English L2 -0.007 0.004 0.006 0.011 0.000
se 0.006 0.007 0.008 0.009 N 99044 60251 44230 30374
Maths L2 -0.023** -0.009 0.027** 0.026** 0.015
se 0.008 0.008 0.009 0.009 N 67838 45742 36497 27035
English & Maths L2 0.020*** 0.011* 0.030*** 0.029*** 0.023
32 https://www.gov.uk/government/publications/progression-of-further-education-students-to-higher-education https://www.gov.uk/government/publications/progression-of-apprentices-to-higher-education-second-cohort
33 The population of FL2 achievers cannot, by definition, be engaged in higher level FE learning before we
observe their earnings returns, as FL2 is the highest FE learning aim we observe for them between 2002 and 2012. The implication is that those achieving FL2 and their L2 Maths/English aim, engage in
subsequent learning at L3/FL3 outside of FE, and this gains them access to HE approximately three years on from their FE achievement.
Percentage Log Daily Earnings Premium in Tax Year after Spell End Achievement 1st Year 3rd Year 4th Year 5th Year 3-5 year average
se 0.004 0.005 0.005 0.006 N 210206 118864 86728 55797
*** Significant at the 0.1% level; ** 1% and * 5%
In Table 5 we do not observe enough individuals studying L1 English and/or Maths aims within our population of FL3 achievers, to make estimation of returns possible. However, for the category of English & Maths L2 (and to a lesser extent Maths L2) we capture some of the positive earnings impact (2.3% in the case of English & Maths L2 achievement), but this is likely an underestimate. Individuals who achieve FL3, but do not achieve
complementary English & Maths L2 are probably less likely to progress to HE and would therefore seem more likely to search for, and subsequently secure, employment that pays relatively well. In contrast, those achieving their FL3 and the accompanying English & Maths L2 are probably more likely to progress to HE and we will only observe earnings for those working PT – falsely depressing our estimated earnings returns before the fourth year after learning.
Table 6:Estimated employment probability premiums for L1/L2 English and/or Maths achievers [for populations of FL3 achievers]
Percentage Point Employment probability Premium in Time Period after Spell End Achievement 3 months 1st Year 3rd Year 4th Year 5th Year 3-5 year average
English L1 0.0180 0.0112 0.0008 0.0334 -0.0061 N/A
se 0.0107 0.0110 0.0176 0.0259 0.0662 N 6645 6359 2411 1134 299
Maths L1 0.0046 0.0115 0.0164 0.0343 0.0688 N/A
se 0.0118 0.0120 0.0202 0.0288 0.0538 N 5722 5444 1995 1058 393
English & Maths L1 -0.0037 0.0001 -0.0099 0.0304 N/A N/A
se 0.0107 0.0111 0.0198 0.0357
N 6166 5693 1808 626 155
English L2 0.0020 -0.0025 -0.0027 0.0018 0.0060* 0.0017
se 0.0023 0.0022 0.0025 0.0027 0.0030 N 217438 213817 130705 97216 68423
Maths L2 0.0110*** 0.0025 0.0007 0.0021 0.0025 0.000
se 0.0029 0.0028 0.0030 0.0031 0.0033 N 142534 138299 89642 70550 53103
English & Maths L2 0.0079*** 0.0031* -0.0014 -0.0003 -0.0017 0.000
se 0.0016 0.0015 0.0017 0.0019 0.0021 N 416523 380511 226292 167676 116830
*** Significant at the 0.1% level; ** 1% and * 5%
![Table 3: Returns to daily earnings for L1/L2 English and/or Maths achievers [for a population of FL2 achievers]29 30](https://thumb-us.123doks.com/thumbv2/123dok_us/30167.2396/25.595.59.492.321.604/table-returns-earnings-english-maths-achievers-population-achievers.webp)
![Table 10: Active Benefits, compared to non-achievers, by Sector Subject [for the population Estimated probability of L1 English and/or Maths Achievers being on of Full Level 2 Achievers]](https://thumb-us.123doks.com/thumbv2/123dok_us/30167.2396/35.595.59.565.540.784/benefits-compared-achievers-population-estimated-probability-achievers-achievers.webp)